Deepvue Features: Every Tool on the Platform, and Where to Find It
The Deepvue features cover a growth trader’s whole workflow: reading the market, finding candidates, judging a stock, asking the awkward questions, and sizing the trade. The apps are sorted into four groups named Core, Research, Tools and Visualizations, and every one of them can run on a dashboard you build yourself.
Two more pieces stand outside the app catalog: the customizable dashboard that holds everything, and the Model Book, where past setups are saved and studied. One plan at $49 a month covers all of it.
and open every tool on the platform today, with no tiers and no upsells.
The Deepvue platform, in numbers:
Key Takeaways
Plenty of trading platforms amount to a screener with extras. Deepvue started from the other end: map what a growth trader does from the morning read to the order, then give each step a tool. That is why the Research group outnumbers the rest.
- ✓Four app groups: Core for the daily essentials, Visualizations for pictures of a universe, Research for market context, and Tools for specific jobs.
- ✓Every group has its own hub, and every app inside it has a walkthrough of its own.
- ✓Screening draws on 1,152 data points, with 169 presets to start from.
- ✓The AI Terminal is native, part of Core beside the chart and the screener.
- ✓The Model Book is separate: its own module for studying past setups, outside the dashboard catalog.
- ✓Everything is one plan. Start with Deepvue and nothing is held back.
The Deepvue Platform at a Glance
- Core Features
- Screener, Charts, AI Terminal, Watchlist and Alerts
- Visualizations
- Bubble Chart, Performance Chart, Heat Map and Mini Chart
- Research
- Market Brief, Theme Tracker, Market Breadth, Industry Ranks, Top Movers, Stage Analysis, Upgrades / Downgrades, New Highs / Lows, Reports, Data Panel, COT Positioning and NAAIM Exposure
- Tools
- Position Size Calculator, Stats Table, Economic Calendar and Earnings Calendar
- Customizable Dashboard
- Where any combination of apps runs together, linked by color group
- Model Book
- Its own module where chart setups are saved, tagged and reviewed
Start Here: The Quick Start Guide
Rather be shown than told? The Quick Start Guide covers the platform end to end and is the fastest orientation available.
WatchQuick Start Guide: the whole platform in one walkthroughCore Features: The Daily Five
The daily working set. Most sessions run through these five in order: scan for names, judge them on a chart, park the keepers in a list, set alerts on levels, and turn to the AI Terminal when something needs explaining.
- •Charts: a charting engine built in house, carrying growth stock studies, bar by bar replay and anchored VWAP.
- •Screener: 1,152 data points to filter on, 169 presets to start from, and every result charted as you step through.
- •Watchlist: one list split into sections, columns you choose, and 34 preset lists to borrow from.
- •Alerts: set from a screener row, a watchlist or a trendline drawn on the chart.
- •Deepvue AI Terminal: uses what is in your lists and screens, answers questions and turns a sentence into a working screen.
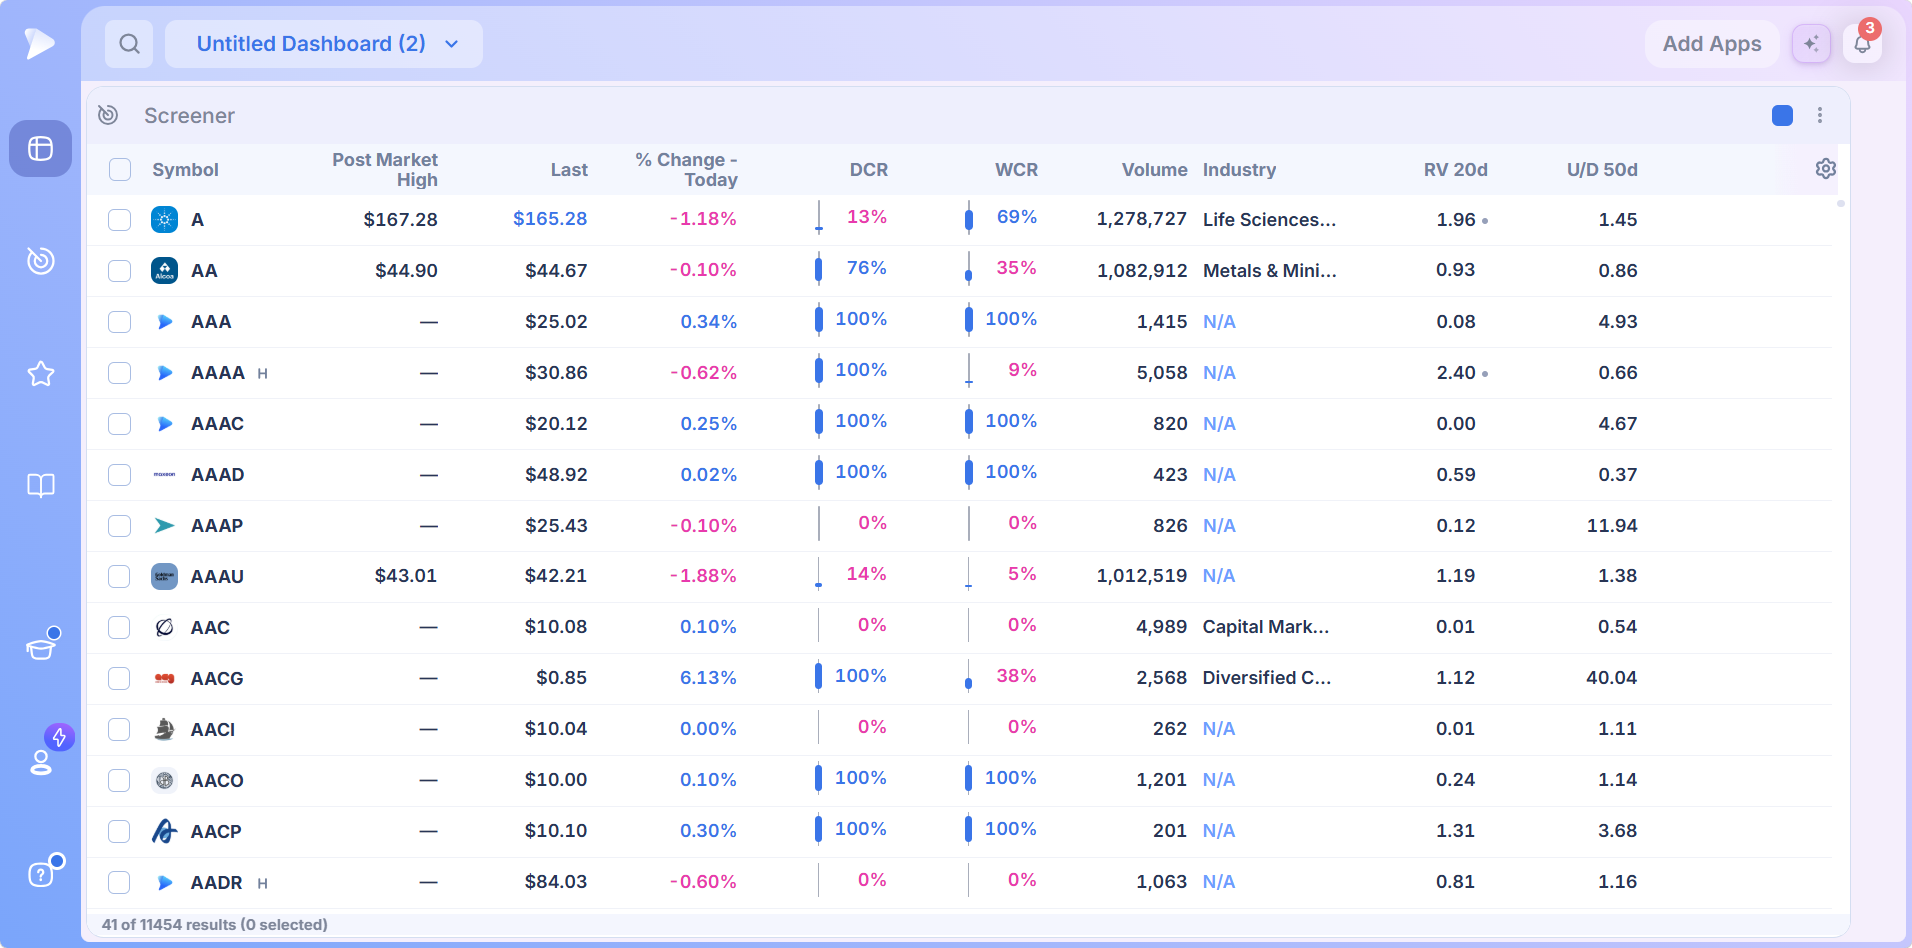
Go deeper on all five in the Core Features hub.
Create your Deepvue account and set the core five up on day one.
Visualizations: Seeing a Universe Rather Than Reading One
Pictures instead of rows. The Heat Map, Bubble Chart and Performance Chart each draw a screen or list you pick, showing at once whether strength is broad or narrow and which names lead on more than one measure. The Mini Chart does the opposite job, holding one symbol in a small space.
- •Performance Chart: bars for every stock on a single measure, sorted strongest first.
- •Heat Map: blocks for sectors and industries, with color and tile size set independently.
- •Bubble Chart: position from two data points, size from a third, moving as the session trades.
- •Mini Chart: one symbol in a compact chart; add several, each set up its own way.
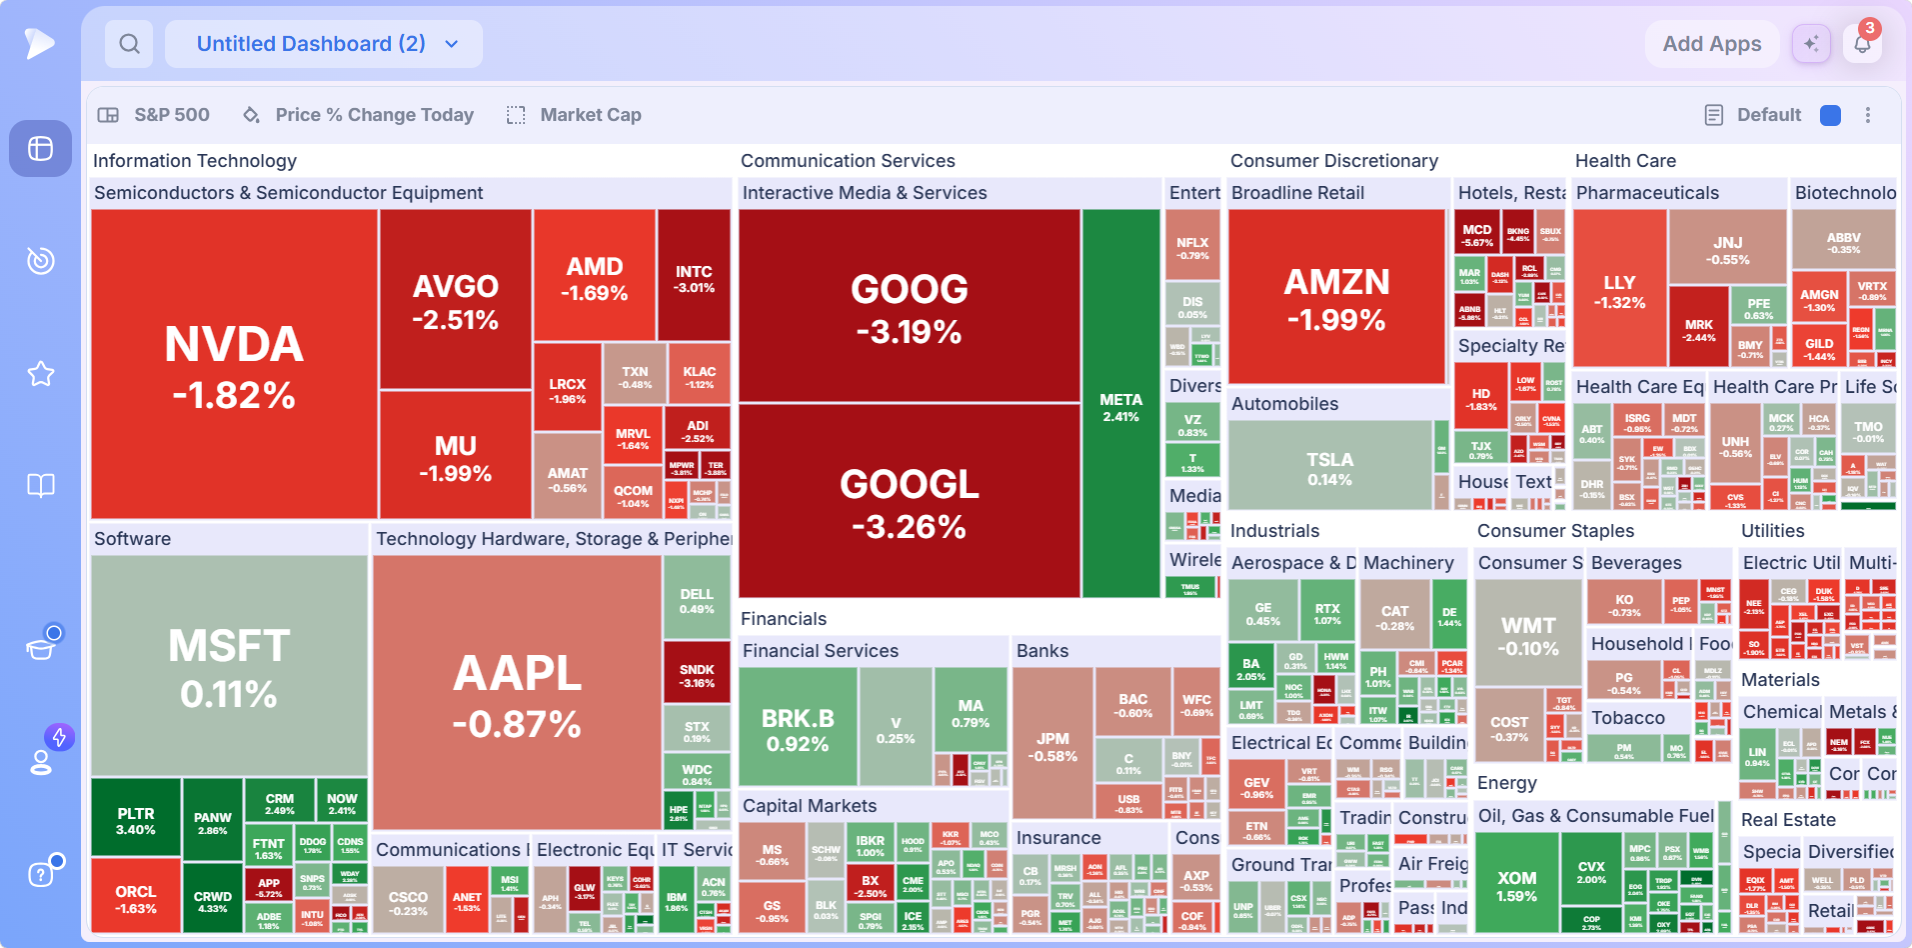
Each of the four gets a full walkthrough from the Visualizations hub.
Research: Reading the Market Before You Trade It
The largest group, and the reason Deepvue is more than a screener with charts. Every app here tackles one question, whether conditions reward new positions and which groups are attracting capital, at a different zoom level, from a written morning summary to stage counts for every industry. Agreement between two or three of them is worth more than any single reading.
- •Market Brief: an AI summary of the day’s news and its tone, updated every 15 minutes.
- •Theme Tracker: 31 curated themes compared over five timeframes.
- •Industry Ranks: sectors down to sub industries ranked against each other, with each day’s rank change.
- •Market Breadth: how many stocks are joining a move rather than how far the index went.
- •Stage Analysis: how every group divides between the market stages.
- •Top Movers: the session’s largest movers with the reason for each move.
- •Upgrades / Downgrades: analyst calls and price target changes, with a summary of the ones that count.
- •New Highs / Lows: where fresh highs and lows are clustering right now.
- •Reports: how many names pass each screen you track, updated live.
- •Data Panel: the metrics you choose for the selected stock, in saved layouts.
- •COT Positioning and NAAIM Exposure: the two most recent apps in the group.
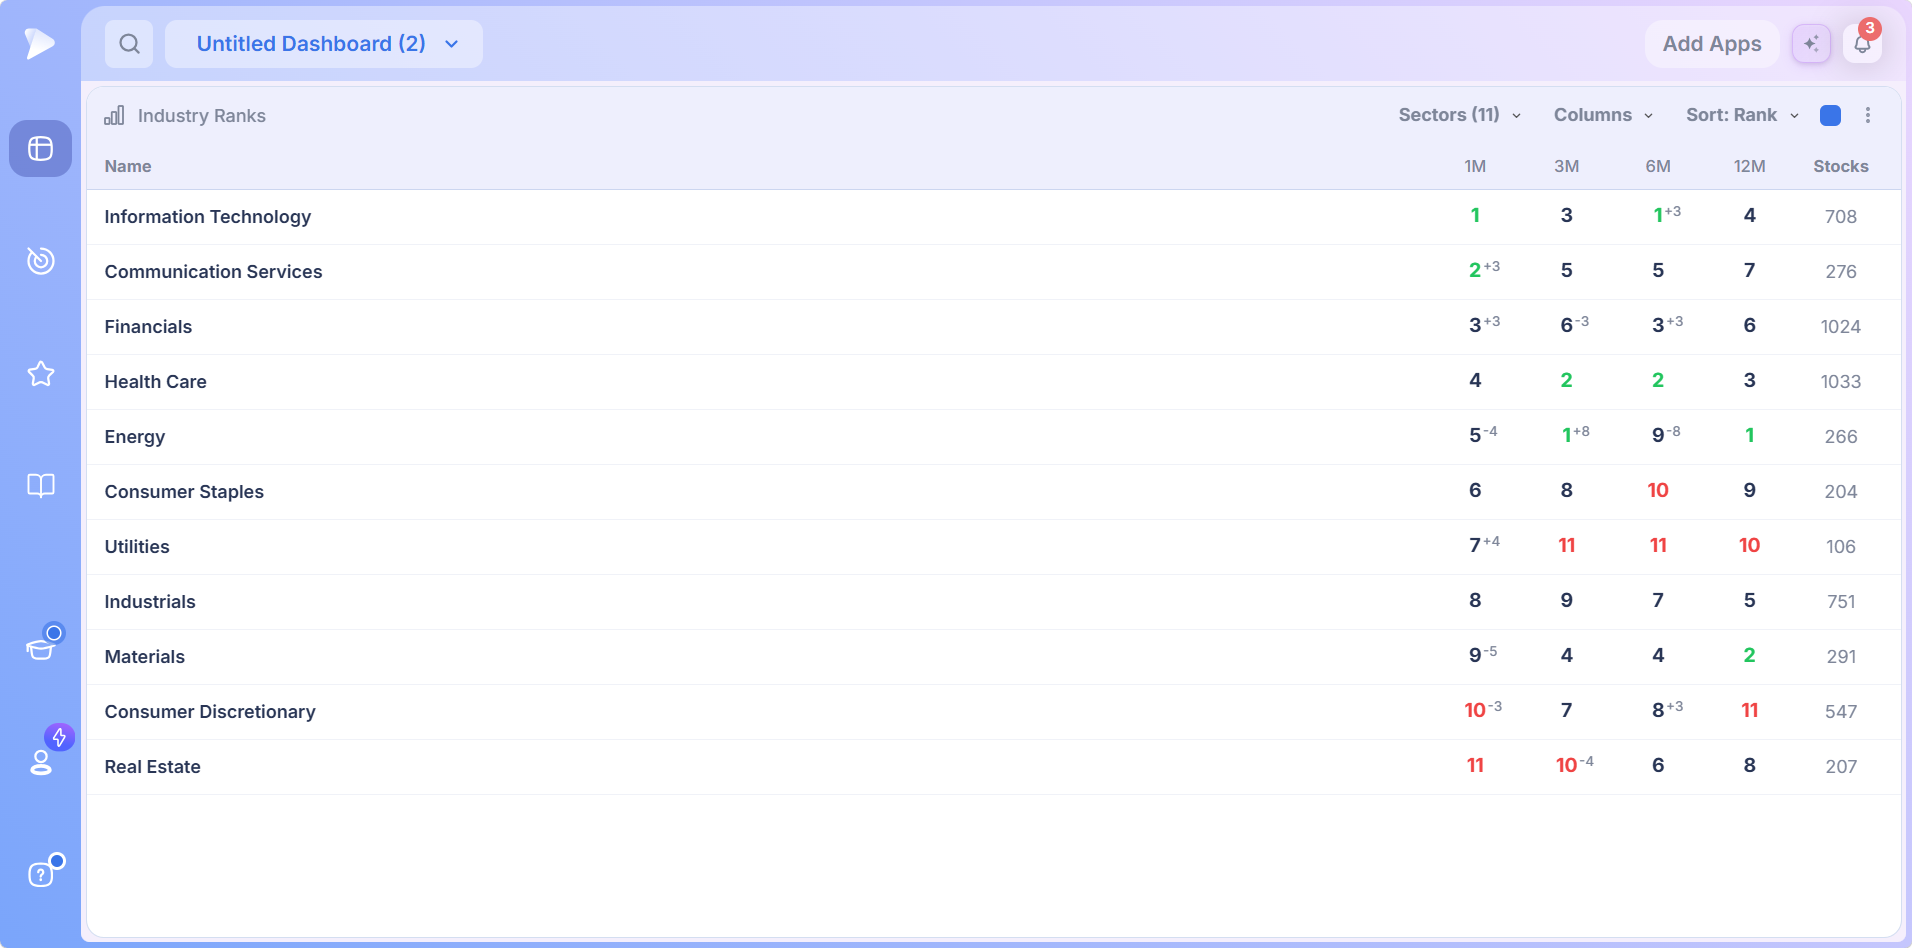
The Research hub takes each of these apart.
WatchPlatform update: the AI Terminal, Industry Ranks and the new dashboardSubscribe to Deepvue and put a market context board together from the Research group.
Tools: Four Specific Jobs
The narrowest group. These do not find stocks or read the market; they settle the last few questions about a candidate you already like: the reported numbers, the share count your risk allows, the next earnings date, and any macro release on the calendar.
- •Stats Table: a company’s reported and forecast earnings and sales, each with its growth rate.
- •Position Size Calculator: account, risk and stop in, share count out, with a ceiling on position size.
- •Earnings Calendar: the week’s reports by day, graded once results arrive.
- •Economic Calendar: macro releases showing the print against its forecast and prior reading.
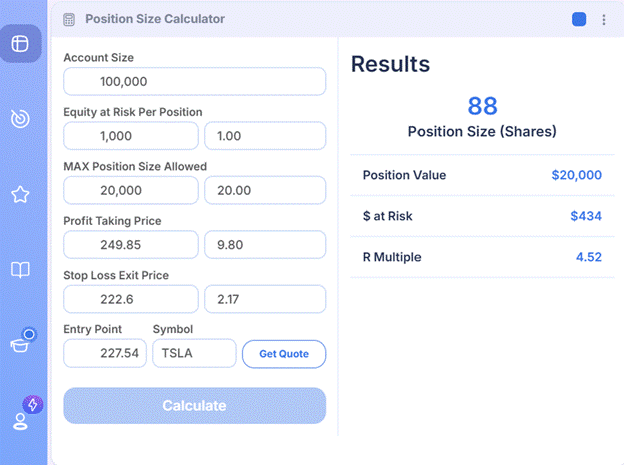
The Tools hub runs through all four.
Customizable Dashboard: Arranging It All
Any app from the catalog can go on a customizable dashboard. Pick the apps, configure each one a single time, and decide which ones move together: a shared color group means selecting a name anywhere updates the chart, Data Panel, Stats Table and every other linked app.
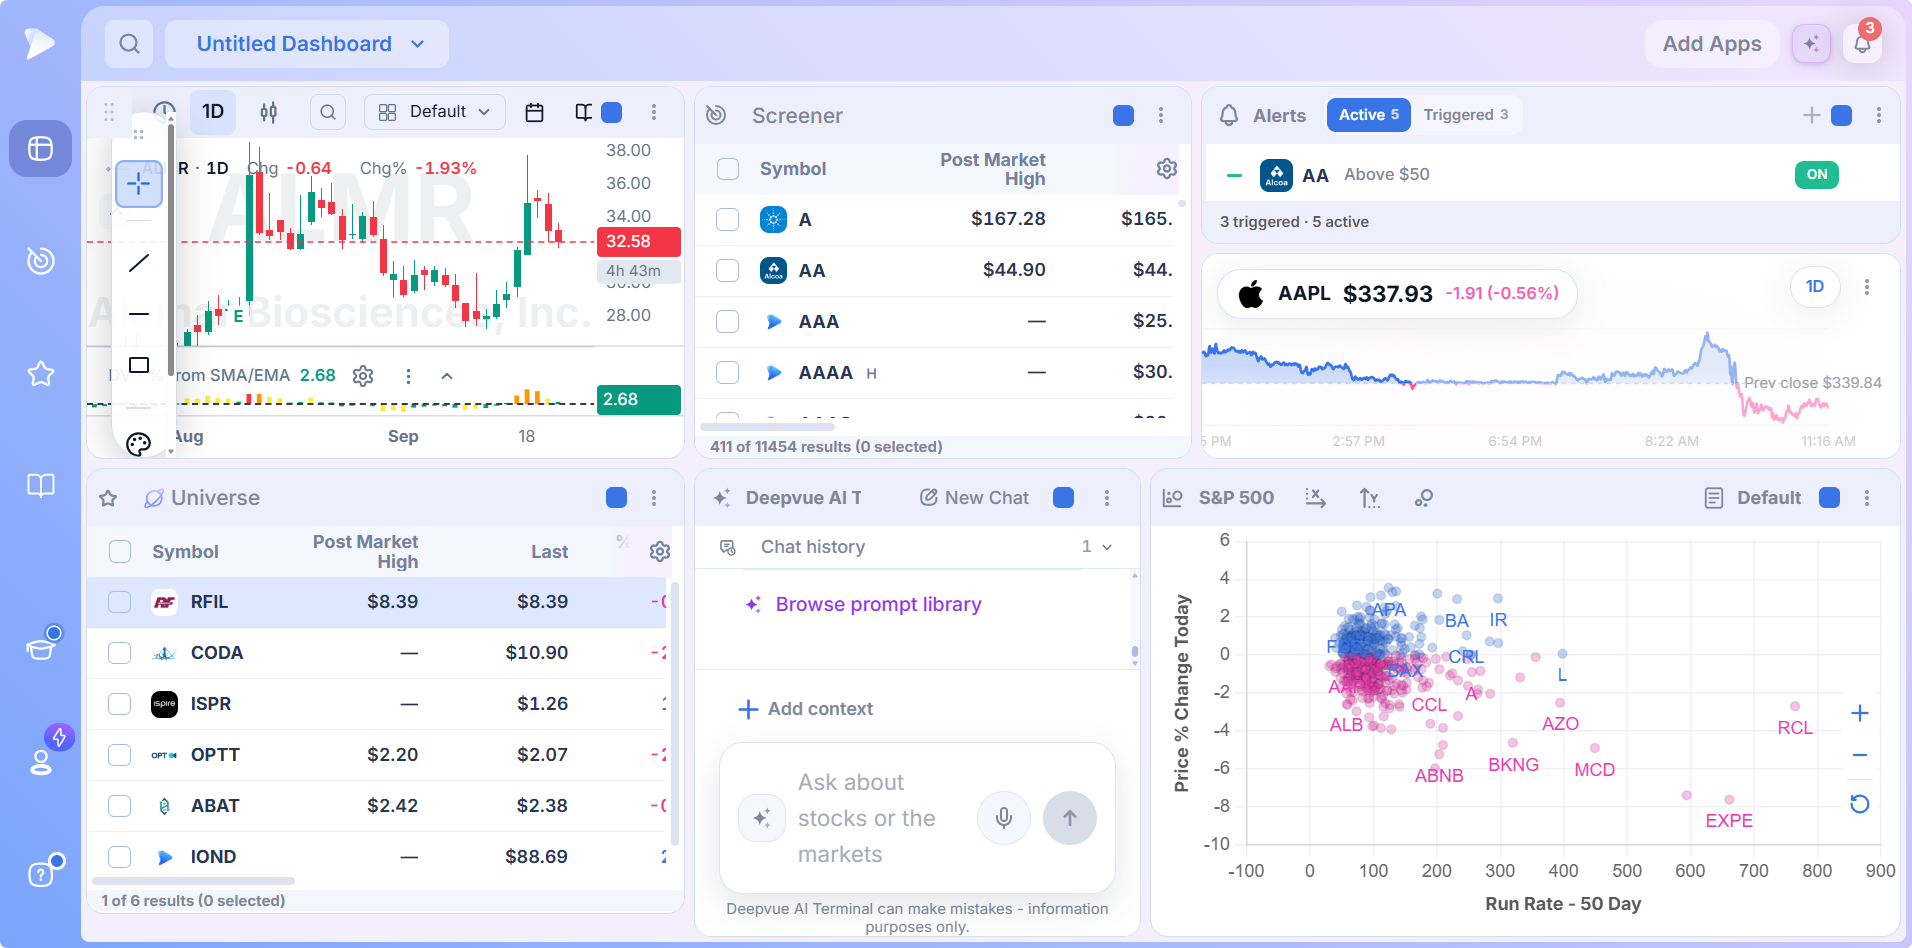
Run separate dashboards for separate jobs, or start from a ready made preset, built by Deepvue or by traders such as Richard Moglen, and adjust it. Thecustomizable dashboard guide covers the full catalog, color groups, presets and layouts worth copying.
Model Book: Your Own Library of Setups
The Model Book is separate from the dashboard apps: a dedicated module for studying past setups. Save a chart exactly as configured, drawings included, then add notes, tags and a measured move so you can filter the library later.
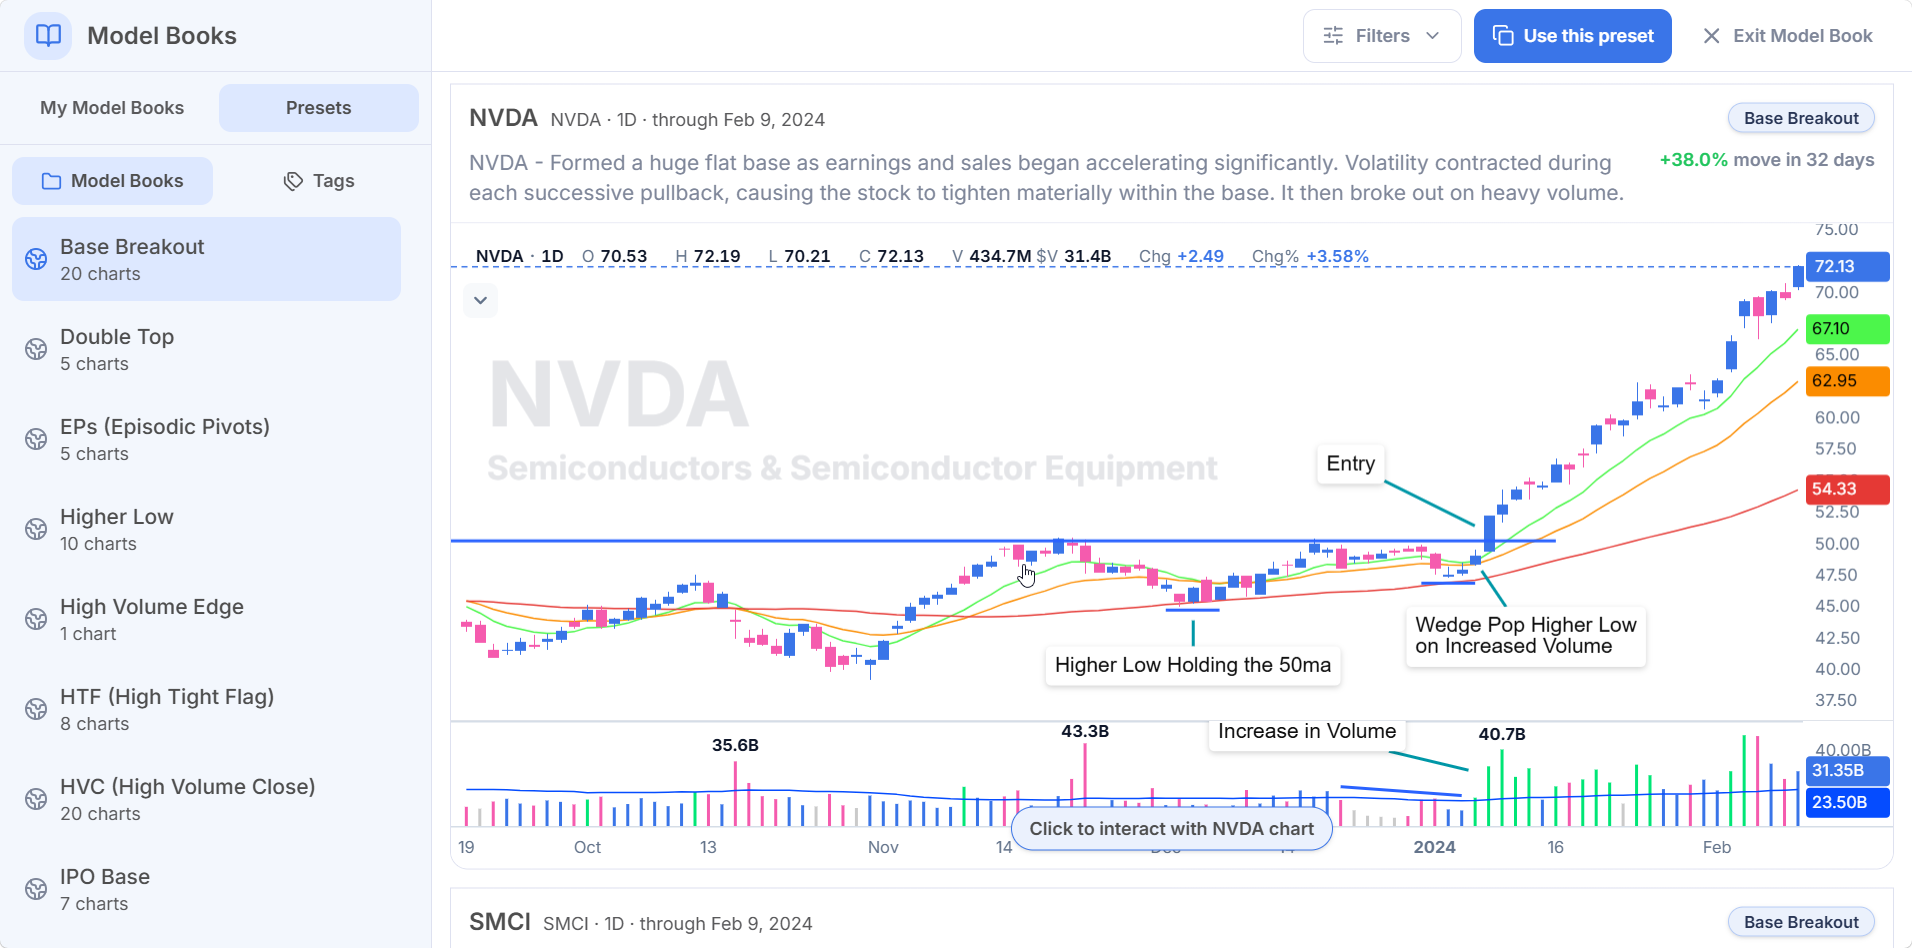
Snapshots stay interactive, so an old chart can be reworked with newer tools. Ten preset books ship with it, from base breakouts and IPO bases to high tight flags, parabolic shorts and undercut and rally setups, and any book can be shared by link. TheModel Book guide covers the module in full.
How the Deepvue Platform Features Fit Together
Individually each tool is useful. As a set they matter because they map onto a sequence, and the output of one is the input of the next.
| The job | The question it answers | The features that do it |
|---|---|---|
| Read the market | Should I be adding exposure, and which areas are leading? | Market Brief, Theme Tracker, Heat Map, Market Breadth, Industry Ranks, New Highs / Lows, Stage Analysis |
| Find candidates | Which specific stocks qualify? | Screener, Watchlist, Top Movers, Upgrades / Downgrades, Performance Chart, Bubble Chart |
| Judge a stock | Is this one actually set up? | Charts, Data Panel, Stats Table, Mini Chart, Reports |
| Ask questions | Why did this happen, and what am I missing? | AI Terminal |
| Watch the calendar | Which scheduled events could hit this position? | Earnings Calendar, Economic Calendar |
| Size and manage | How many shares, and what happens next? | Position Size Calculator, Alerts |
| Arrange it all | How do I see the pieces I need together? | Customizable dashboards |
| Study and improve | What did the last hundred of these look like? | Model Book, Charts with replay mode |
A Day Using Deepvue
Read the Market Brief for overnight developments and whatever is driving prices, in one pass.
Scan Top Movers and the day’s analyst actions, downside first if you hold positions.
Read leadership: the Theme Tracker for themes, Industry Ranks for classifications, Stage Analysis for structural condition.
Run a screen inside whichever areas came out strongest.
Work the results beside a chart, stepping through names with the spacebar and judging each setup.
Ask the AI Terminal about anything you cannot explain, and move the survivors into a watchlist.
Size anything you intend to buy, then set alerts on the names still short of their trigger.
Not one step needs another tab or another login. That is the practical case for one wide toolset over four separate subscriptions.
Which Deepvue App Features Matter Most for How You Trade
Nobody uses every one of the Deepvue app features. Here is where each style tends to concentrate, based on how the tools are built rather than a marketing segmentation.
| If you trade this way | Start with these | Add these once settled |
|---|---|---|
| Swing trading, days to weeks | Screener, Watchlist, Charts, Theme Tracker, Position Size Calculator | Market Brief, Top Movers, Alerts |
| Position trading, months | Industry Ranks, Stage Analysis, Charts, Data Panel | Market Brief, Market Breadth, Watchlist sections |
| Chasing the strongest names | Theme Tracker, Heat Map, Screener, Charts | Industry Ranks sorted by rank change, AI Terminal |
| CANSLIM and growth methodology | Screener with the CANSLIM presets, Data Panel, Stats Table, Charts | Industry Ranks, Model Book |
| Limited screen time around a job | Market Brief, Watchlist, Alerts, Position Size Calculator | Theme Tracker, AI Terminal |
| Studying rather than trading yet | Model Book, Charts with replay mode, Stage Analysis | AI Terminal for explaining historical moves |
The pattern worth noticing: everyone needs a chart and a list. What differs is which context tool decides where you point them. The Deepvue for hub gathers workflows by trading style.
WatchA full session working through the platform against a live marketWho Deepvue Is Built For
- ✓Traders of growth stocks who combine chart work with fundamentals.
- ✓CANSLIM traders following the William O’Neil method.
- ✓Swing and position traders holding trends for a few weeks to a few months.
- ✓MarketSurge users who want a modern, regularly updated platform at a third of the price.
- ✓TradingView users after growth specific ratings and studies rather than general purpose indicators.
Day traders will find the Deepvue tools aimed elsewhere, and so will anyone who touches a portfolio twice a year. Deepvue places no orders either: it is research software, independent of any broker, working alongside the account you already have.
Getting Up to Speed
- •A one to one session with someone on the team, setting up your first dashboards around how you trade.
- •An onboarding email series introducing the platform one area at a time.
- •Weekly live sessions taking a single area apart in depth, with recordings afterward.
- •The Deepvue Knowledge Base for written documentation on every module.
- •The AI Terminal itself, which can answer questions about the platform too.
The advice from people who have done it: pick the one tool that solves your most annoying problem, use only that for a week, then add the next. Adopting everything at once is how people end up using three apps.
What Makes the Deepvue Features Different
- ✓Built by active traders who use the platform every day, around the growth stock and CANSLIM niche.
- ✓Market context as a whole group, not an afterthought bolted onto a screener.
- ✓Proprietary ratings such as RS Rating, EPS Rating and Composite Rating built in.
- ✓Native AI with right click research on any chart bar, a capability unique in its niche.
- ✓Original tools like the Theme Tracker, created by Deepvue before others copied them.
- ✓Regular updates and a price of $49 a month against $149 for MarketSurge.
Side by side matchups with TrendSpider, MarketSurge, Finviz, TC2000 and TradingView have their own pages under the Deepvue comparisons hub.
What Traders Say About Deepvue
Independent views on the platform as a whole.
“Deepvue feels extremely well tailored to momentum trading and CANSLIM investing.”
A verified reviewer on G2. On G2
“The interface is very well thought out and highly customizable.”
u/NeosDemocritus, r/CANSLIM. Open the thread
“Deepvue is the most economical and impressive trading platform I have used.”
From the App Store, late 2024. Apple App Store
“I believe DeepVue is purpose built for swing or position trading.”
u/DLightman1983 on r/swingtrading. Read the thread
The Deepvue reviews wall tallies 220 plus verified reviews; the mean score is 4.8, and nearly every reviewer (97 percent) would recommend Deepvue.
What the Deepvue Features Cost
Every Deepvue feature arrives together for $49 monthly, with a discounted annual option. Deepvue runs exactly one tier, so no tool is reserved for anybody paying more and none carries its own price tag.
That one plan covers:
- •The screener and its 1,152 data points.
- •Charts, watchlists, and alerts, all of them unrestricted.
- •Fully customizable dashboards, with every app in the catalog.
- •The Theme Tracker, Market Brief, and AI Terminal, the last with unbounded usage.
Deepvue has one plan, so there are no tiers to compare. For reference, MarketSurge, the legacy platform in this niche, runs $149 per month.
New subscribers also get a one on one onboarding session with a Deepvue team member, an onboarding email series covering platform features and use cases, and weekly live webinars that each go deep on one part of the platform.
Put the Whole Deepvue Toolset to Work
What makes the Deepvue trading platform features worth having together rather than separately is that each one hands off cleanly to the next. Market read becomes group, group becomes screen, screen becomes chart, chart becomes question, and question becomes a position with a size attached. Assembling that chain anywhere else usually means three or four separate bills.
One plan, every tool. Create a Deepvue account for $49 a month, start with whichever group solves your most annoying problem, and add the rest as you need them.
↑ Back to contentsFrequently Asked Questions
Straight answers about the platform and the plan.
What are the main Deepvue features?
The main Deepvue features are apps covering the whole research process, grouped as Core for charting, screening, lists, alerts and AI; Visualizations; Research for market conditions; and Tools for reported numbers, sizing and calendars. The customizable dashboard and Model Book complete the platform.
What does a stock trading platform need to have?
A stock trading platform needs three things at minimum: a way to find candidates, a way to judge them, and a way to read the conditions they trade in. Most platforms cover the first two; Deepvue’s Research group is its answer to the third.
Are all Deepvue features included in one plan?
Yes, all Deepvue features are included in one plan. A single price of $49 monthly covers everything, with nothing withheld for people paying more and nothing sold as a separate line item.
How many prebuilt screens does Deepvue have?
Deepvue has 169 prebuilt screens, filed into nine categories spanning its own methodology, top traders’ approaches, technical setups, fundamentals, momentum, earnings, day trading scans, extended hours and index universes.
How many data points does the screener have?
The Deepvue screener has 1,152 data points, organized into ten categories covering identifiers, classification, price and volume, technicals, earnings, sales, fundamentals, ownership, proprietary ratings and pre and post market activity.
What makes the AI Terminal different from a general AI chatbot?
What makes the Deepvue AI Terminal different from a general AI chatbot is what it knows and what it can do. The symbol on your screen is already available to it, a whole list or screen can be handed over in one keystroke, and anything it names becomes clickable.
What is a model book and does Deepvue have one?
Model books are curated libraries of chart examples showing what a setup looks like before it works, and Deepvue has a dedicated module for one. Save charts as live snapshots, tag them, note the catalyst, measure the move, and share any book by link.
Can I design my own dashboard layout?
Yes, you can design your own dashboard layout. Every Deepvue app can be put on a dashboard, where you choose the mix, configure each app and link apps through color groups, across as many dashboards as you want.
Can I share screens and lists with someone else?
Yes, you can share screens and lists with someone else. Deepvue watchlists, screens, data panel setups, column arrangements and model books can each be shared as a link, and the recipient adds it to their own account.
Is Deepvue suitable for day trading?
No, Deepvue is not built for day trading. It assumes a holding period of weeks to months; a few tools report intraday, but that information informs a multi week decision rather than timing an entry inside the session.
Does Deepvue place trades?
No, Deepvue does not place trades. It is research software, independent of any brokerage by design, so it complements the account you already have, and nothing it produces is financial advice.
Does Deepvue backtest strategies?
No, Deepvue does not backtest strategies. There is no strategy testing engine; the platform is built for finding and evaluating candidates in the current market, while replay mode and the Model Book support studying history by eye.
Which markets does Deepvue cover?
Deepvue covers US listed stocks; every screen, chart and ranking on the platform is built around US listings.
How steep is the learning curve?
The learning curve is gentle if you take it one tool at a time. The Deepvue Quick Start Guide handles orientation in a single session, and every account comes with a setup call, an email series and a weekly live session on a single area.