Deepvue Research Features: Read the Market Before You Pick a Stock
The Deepvue research features are the apps grouped under Research in the app catalog, from the Market Brief and Theme Tracker to Industry Ranks, Stage Analysis, Market Breadth and Top Movers.
Between them they answer the question that comes before every trade: is this an environment worth pressing in, and where is the money going? They read it at every resolution, from a written news summary to a stage by stage breakdown of every industry, and all of them are part of one $49 per month subscription.
and read the market from every angle before you pick a stock.
The Deepvue research apps, in numbers:
Key Takeaways
Most platforms in this category are strong at finding stocks and weak at telling you whether it is a good time to buy any of them.
Research is the biggest group in the Deepvue catalog, and it is what separates the platform from a screener with charts bolted on. Each app reads the market from a different angle, and when independent readings agree, that agreement is what gives you the confidence to size up.
- ✓Many apps, one question: is this an environment worth pressing in, and where is money going?
- ✓Different resolutions: a written brief, curated themes, formal GICS rankings, stage counts, breadth internals, new highs and lows, the day’s biggest moves, analyst actions, per stock metrics and screen counts.
- ✓Themes and ranks read sector rotation from opposite ends: the Theme Tracker curated, Industry Ranks formal.
- ✓Performance and condition are not the same thing. Rankings describe results; Stage Analysis and Market Breadth describe health, and the disagreements are where the information is.
- ✓Every app drills down, so a group level read turns into a list of names in one click.
- ✓All in the one plan. Open the research apps in Deepvue.
Research at a Glance
- Data Panel
- Your chosen metrics for whichever stock is selected
- Market Breadth
- Participation and internals across the whole market
- New Highs / Lows
- Where new highs and new lows are clustering, on several timeframes
- Theme Tracker
- 31 curated themes ranked by performance on five timeframes
- Reports
- A running count of the stocks passing each chosen screen
- Industry Ranks
- Every GICS classification scored against the rest, with daily rank change
- Market Brief
- The day’s news condensed into one summary with a sentiment read
- Stage Analysis
- The share of each group in every market stage
- Top Movers
- Largest percentage moves of the session, each with its catalyst written out
- Upgrades / Downgrades
- The day’s analyst actions with a written interpretation
- Also in the group
- NAAIM Exposure and COT Positioning, the newest additions to Research
What Are the Deepvue Research Features?
They are the market context tools in the Deepvue app catalog: apps that describe the environment, the groups and the flows before you look at a single chart. Research is one of four app groups, alongside Core, Visualizations and Tools, all indexed on the Deepvue features hub.
Every research app runs as a dashboard app, so any mix of them can run on one screen and track one symbol through a color group.
Who the Research Apps Are For
- ✓Growth stock traders on a weeks to months horizon, who need to know whether the environment rewards new positions.
- ✓CANSLIM® traders for whom market direction and group leadership come before the individual stock.
- ✓Swing traders who want the day’s catalysts and analyst actions without opening a news tab per ticker.
- ✓Position traders tracking whether the groups behind their holdings are still healthy.
- ✓MarketSurge users who want market context beyond a single index view.
Orders are not part of it. Deepvue is research software, deliberately broker independent, so it works beside your existing account rather than instead of it.
Data Panel
Key metrics for the selected stock, organized into named category cards covering company details, trading data, momentum readings, earnings and revenue trends, and ownership changes. Layouts can be saved for different purposes, and trader built presets show what named traders keep beside a chart.
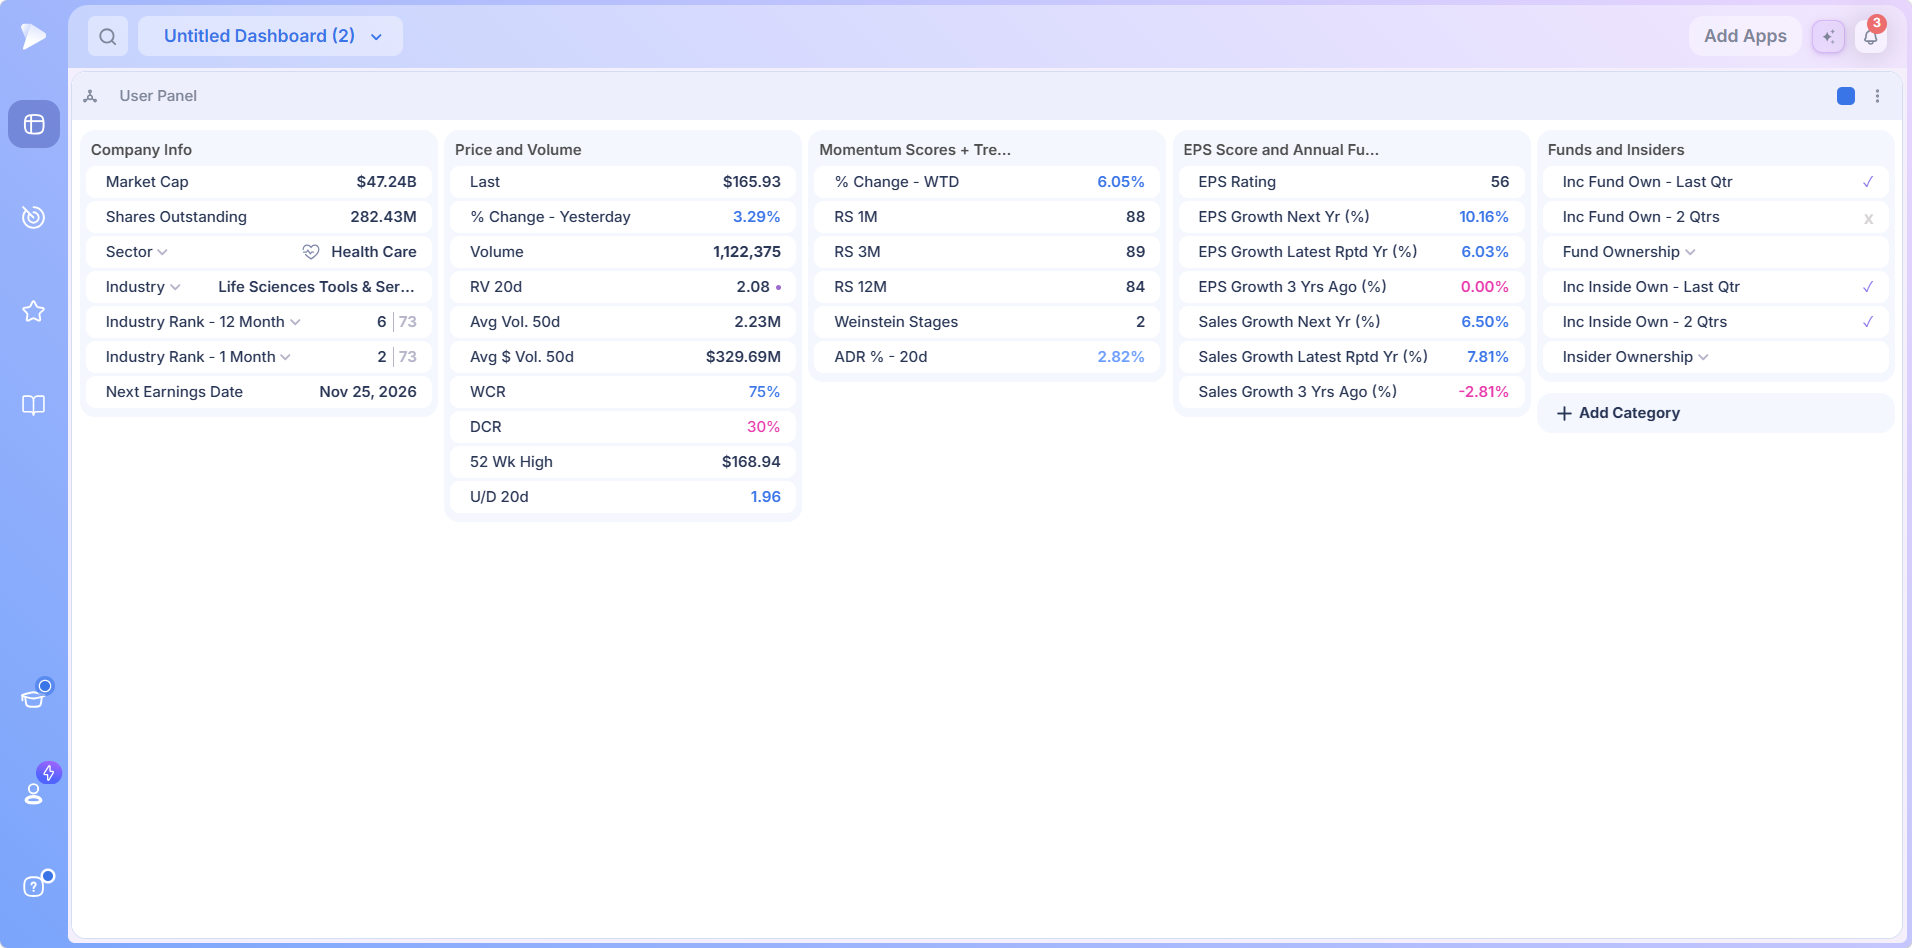
Paired with a chart, it lets you review price action and the numbers behind it without jumping between screens.
Learn more about the Data Panel.
Market Breadth
Internals and participation across the market: how many stocks are actually taking part in a move, not just how far an index has risen or fallen.
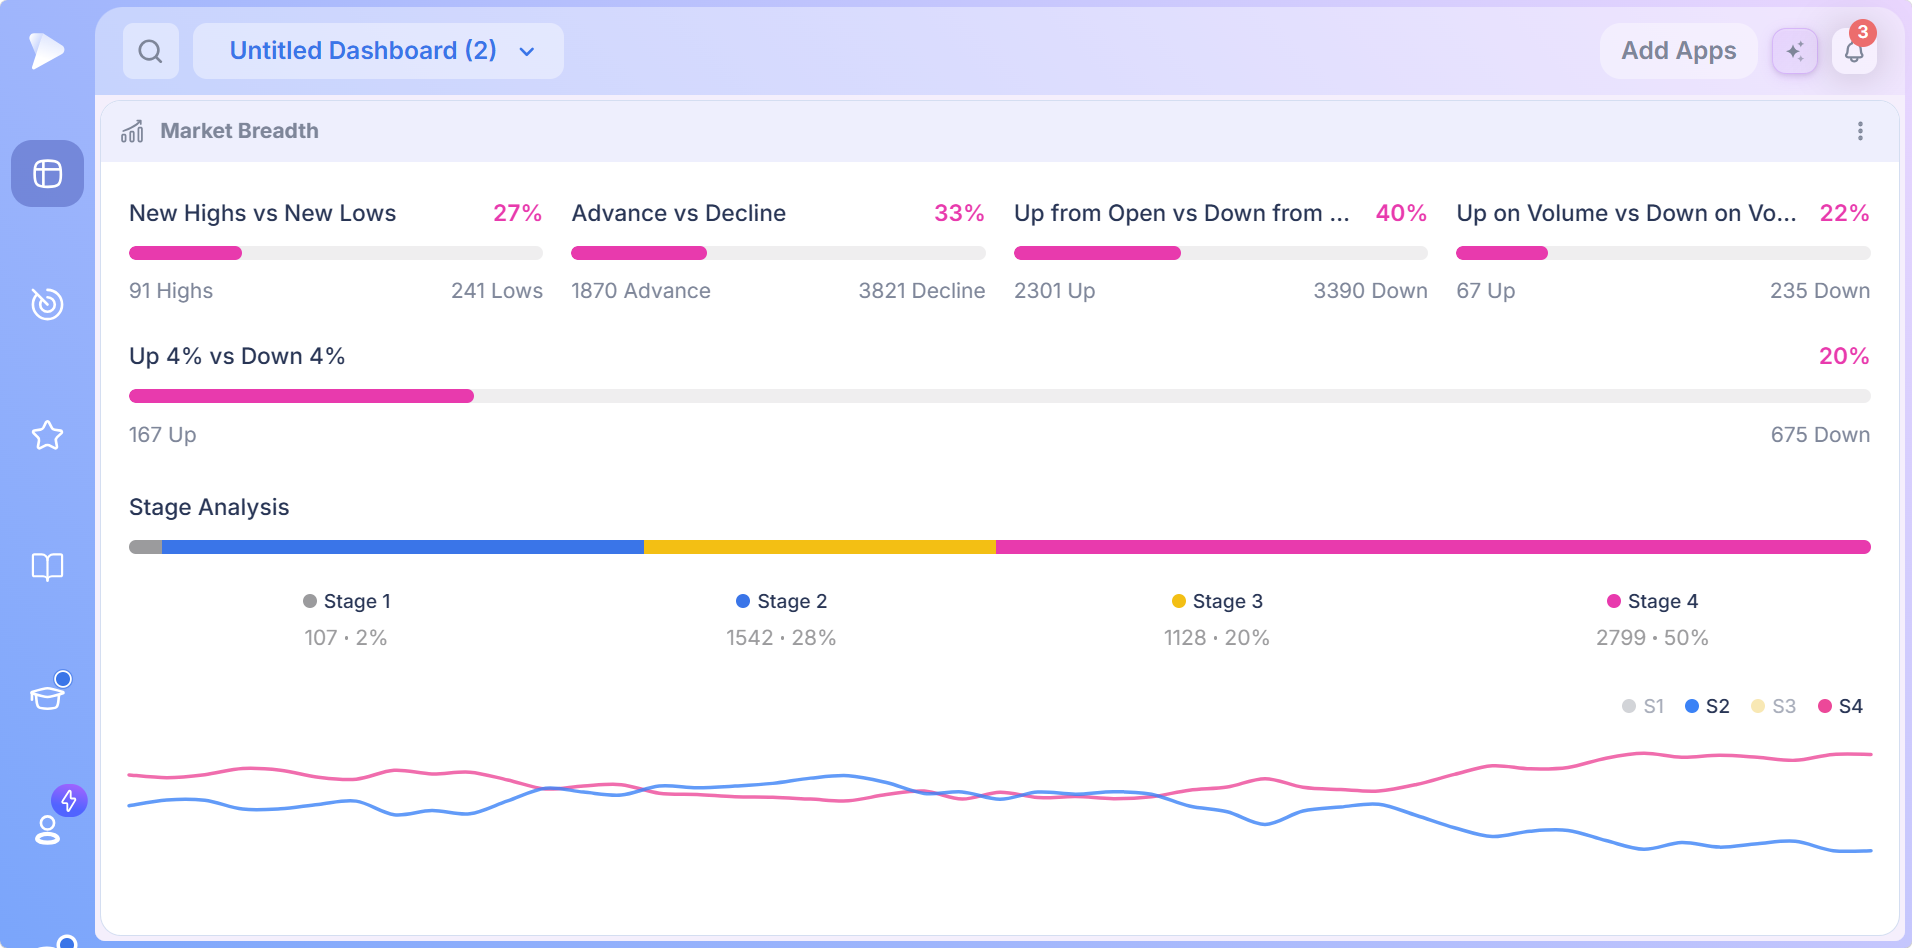
It puts everything else in the group in perspective. The strongest group in a weakening market is not the same opportunity as the strongest group in a healthy one, and an index can look strong while being carried by a handful of large stocks.
Learn more about Market Breadth.
New Highs / Lows
Stocks making new highs and new lows across different timeframes, a quick view of where market strength and weakness are concentrated.
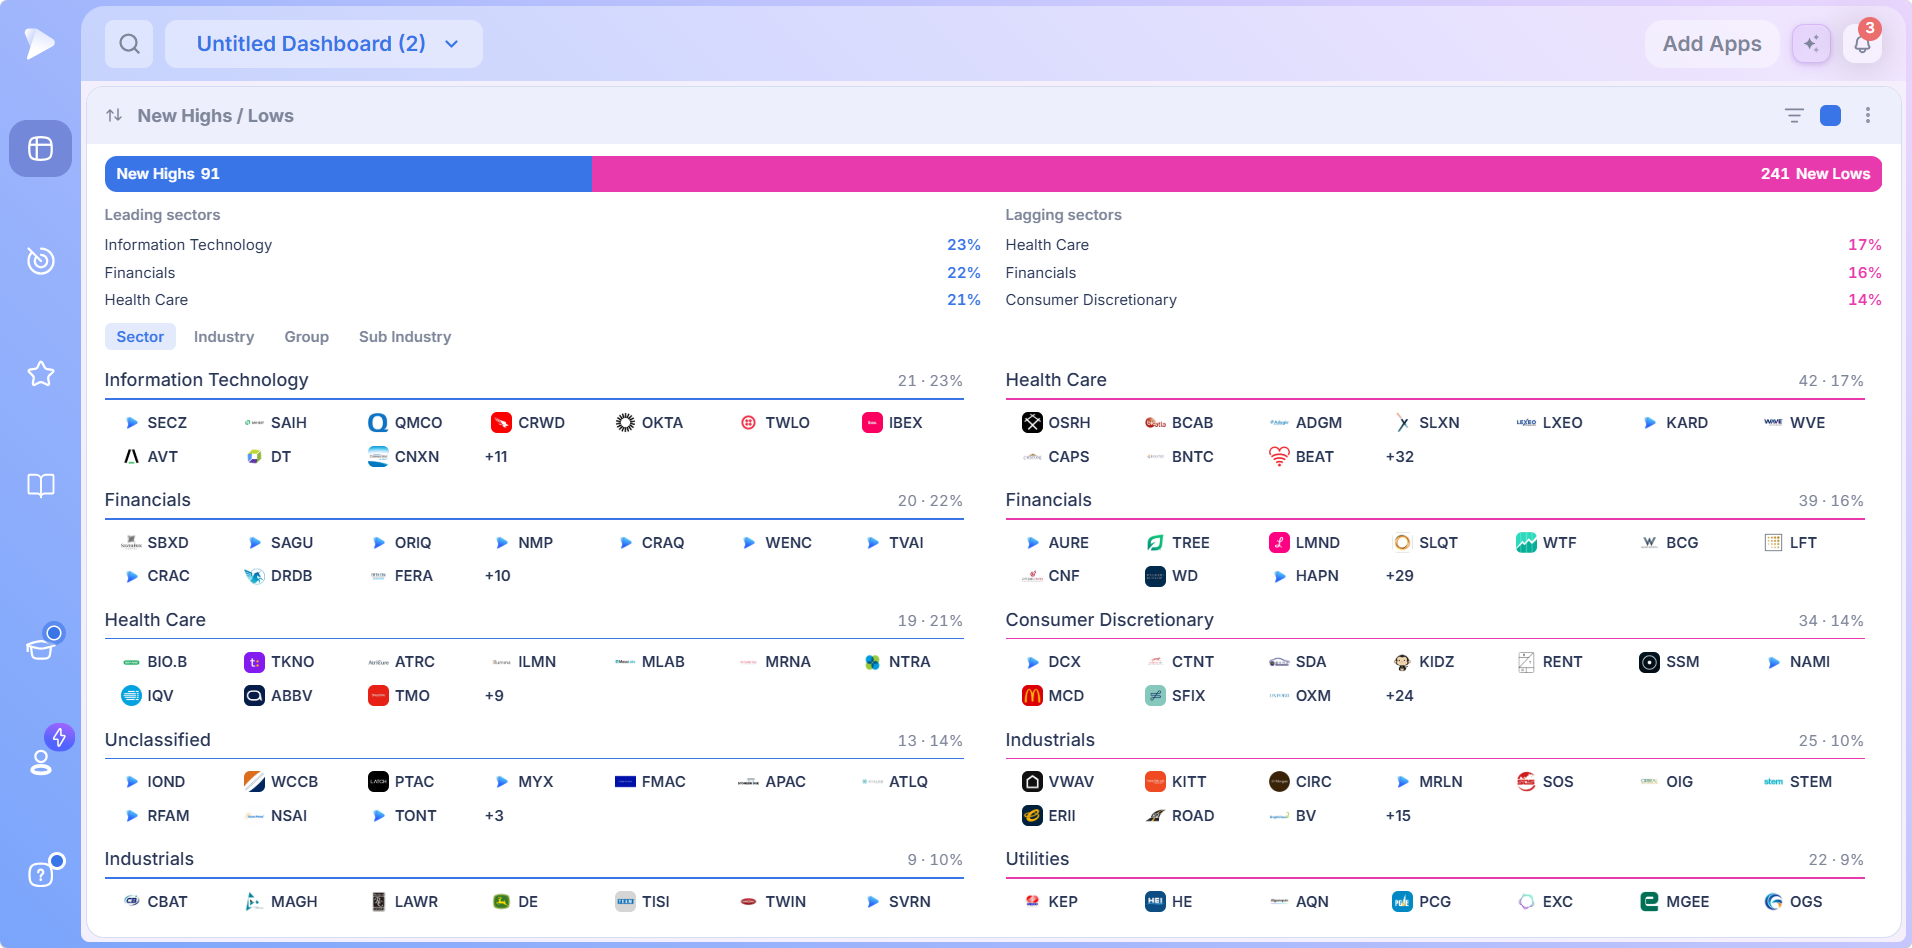
Ranked lists separate the two sides, and a quick menu on each row lets you tag a stock, add it to a watchlist or copy the ticker without leaving the app.
Learn more about New Highs / Lows.
Theme Tracker
Curated market themes ranked across five timeframes, from the current session through year to date, updating live while the market is open. Select a theme to see the stocks inside it ranked by performance.
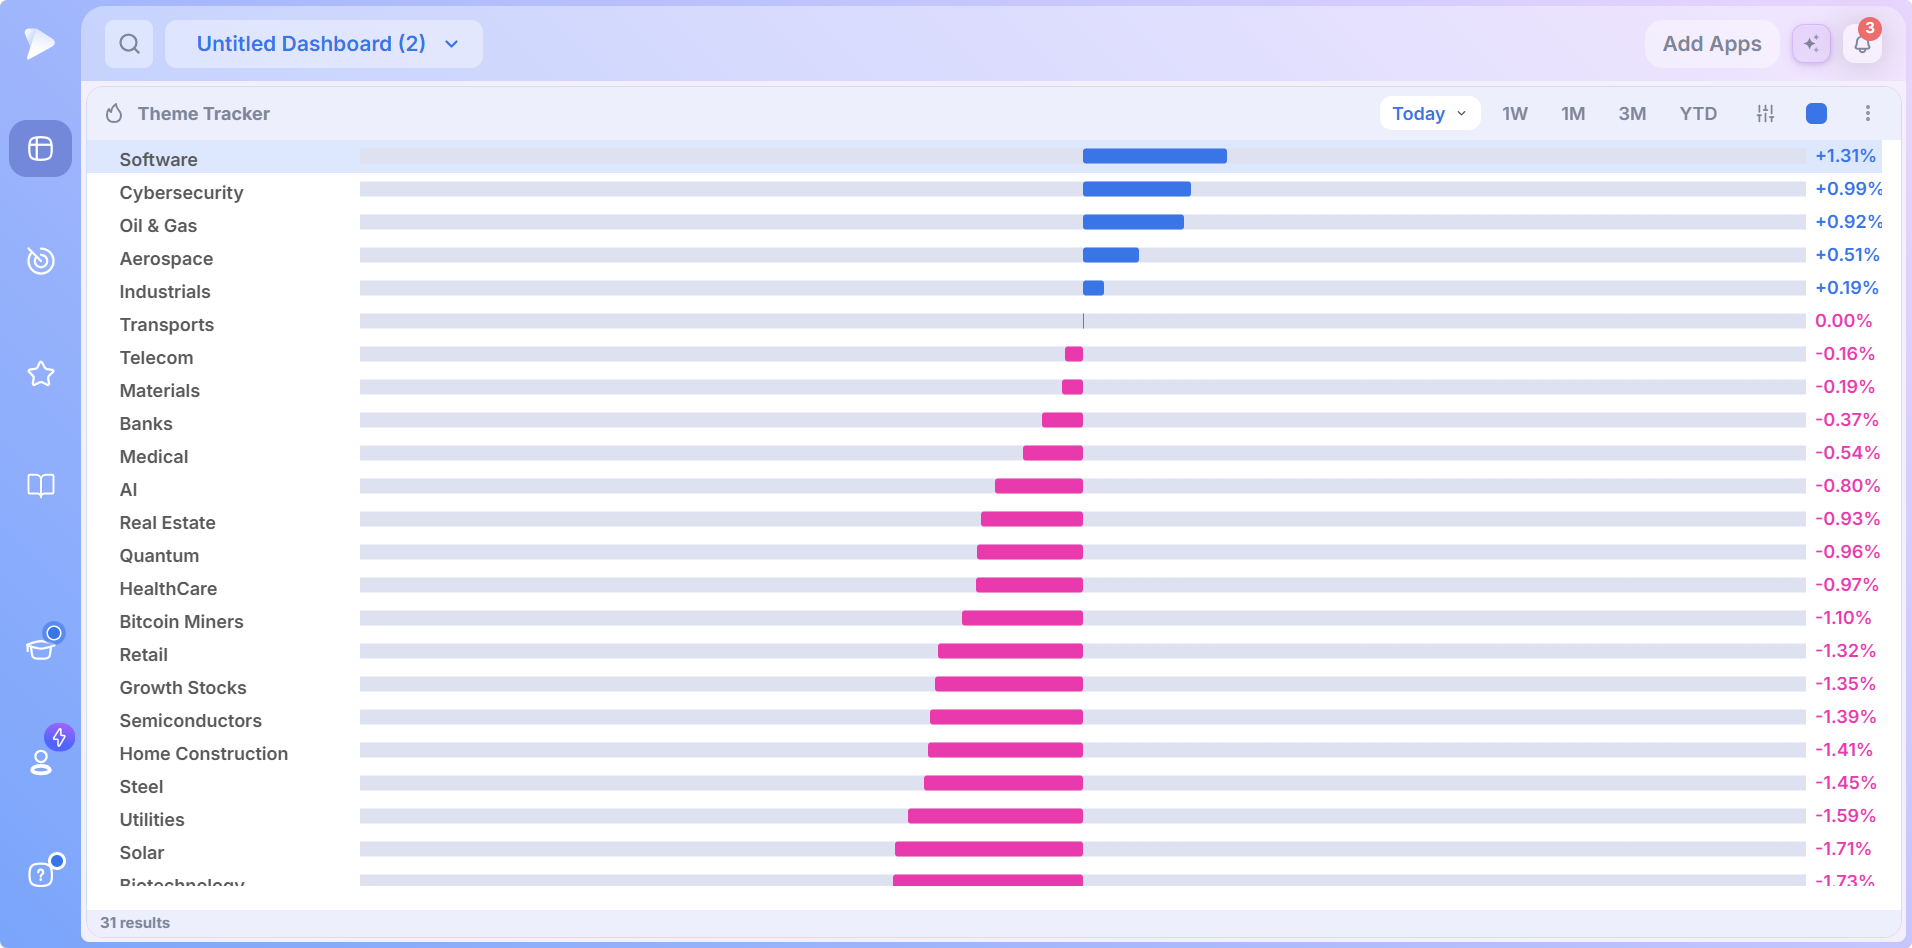
The goal is to spot areas gaining or losing momentum before the trend becomes obvious. Because the themes are curated rather than tied to formal sector classifications, narrower trends can be tracked on their own, and the daily view can measure from the previous close or from today’s open to separate overnight moves from the session itself.
Learn more about the Theme Tracker.
Reports
A live count of the stocks that pass each screen you select, shown together on one card, including every one of the 169 screener presets and your saved screens.
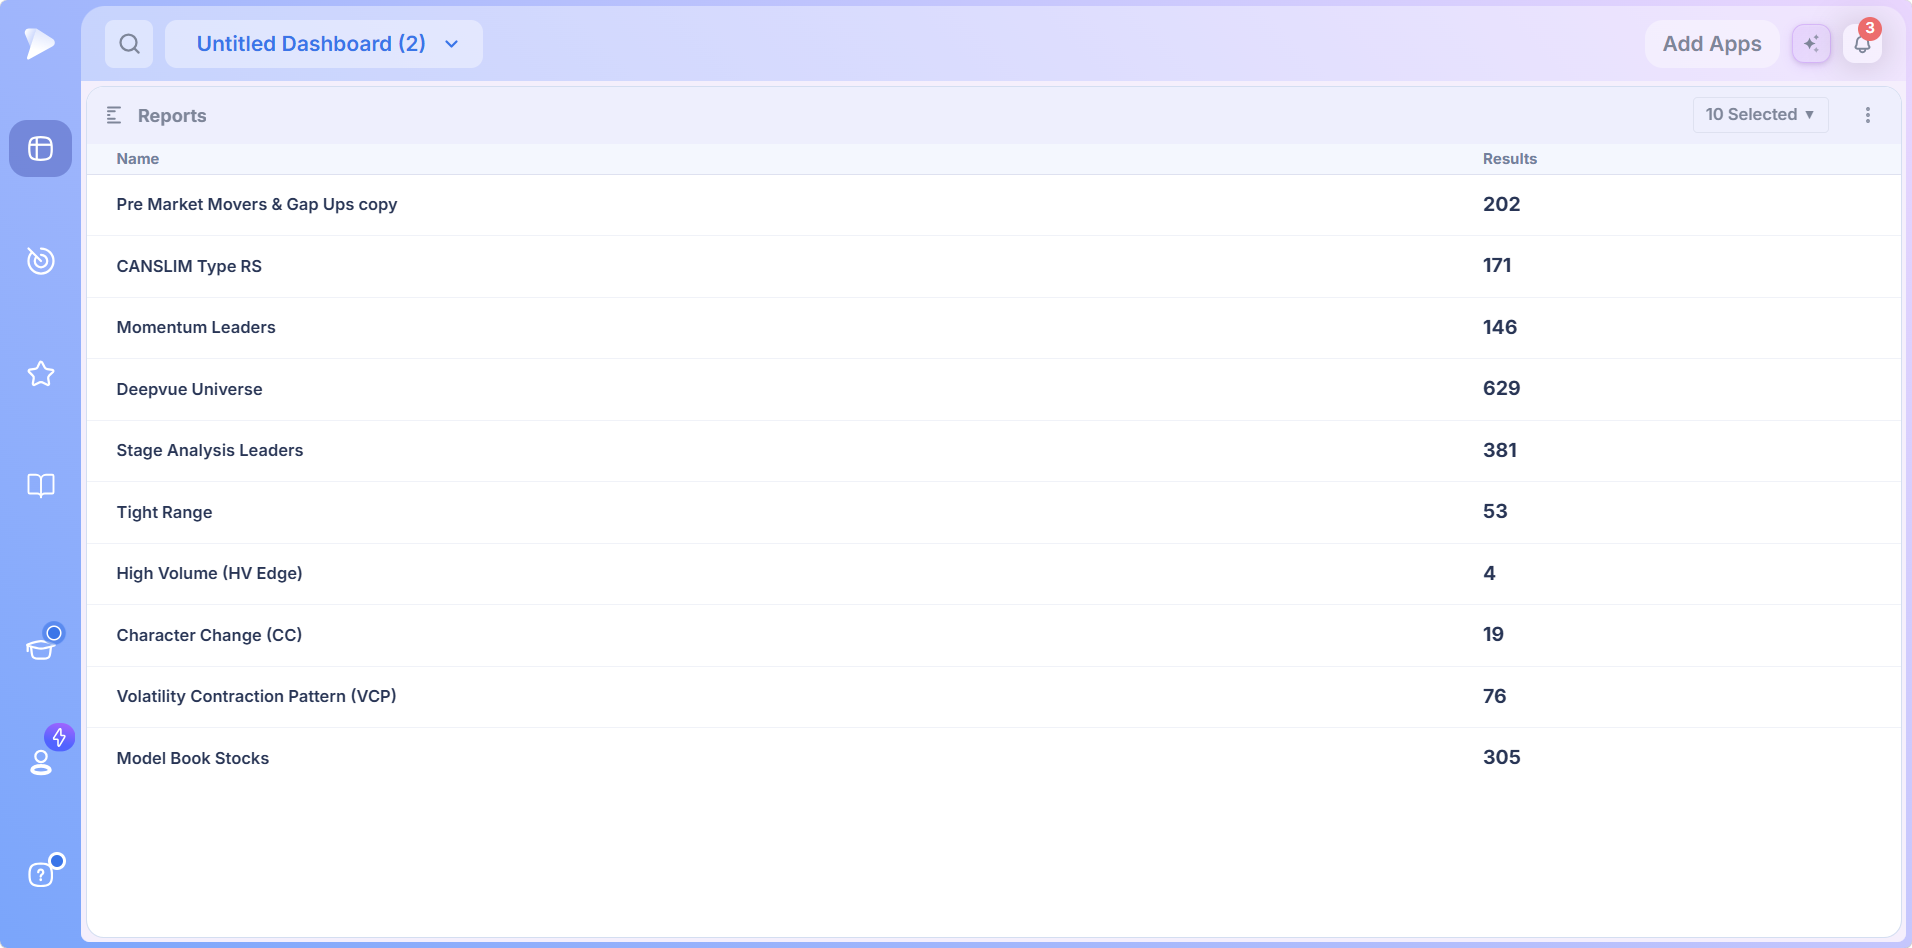
Changes in those counts are market context in their own right. If more stocks start meeting your criteria, conditions may be improving; if the number keeps falling, opportunities are getting scarcer.
Learn more about Reports.
Open a Deepvue account and add these research apps to your first dashboard.
Industry Ranks
Ranks market groups by relative performance across four levels of the GICS hierarchy, 11 sectors, 25 industry groups, 73 industries and 164 sub industries, with performance measured across up to six timeframes.
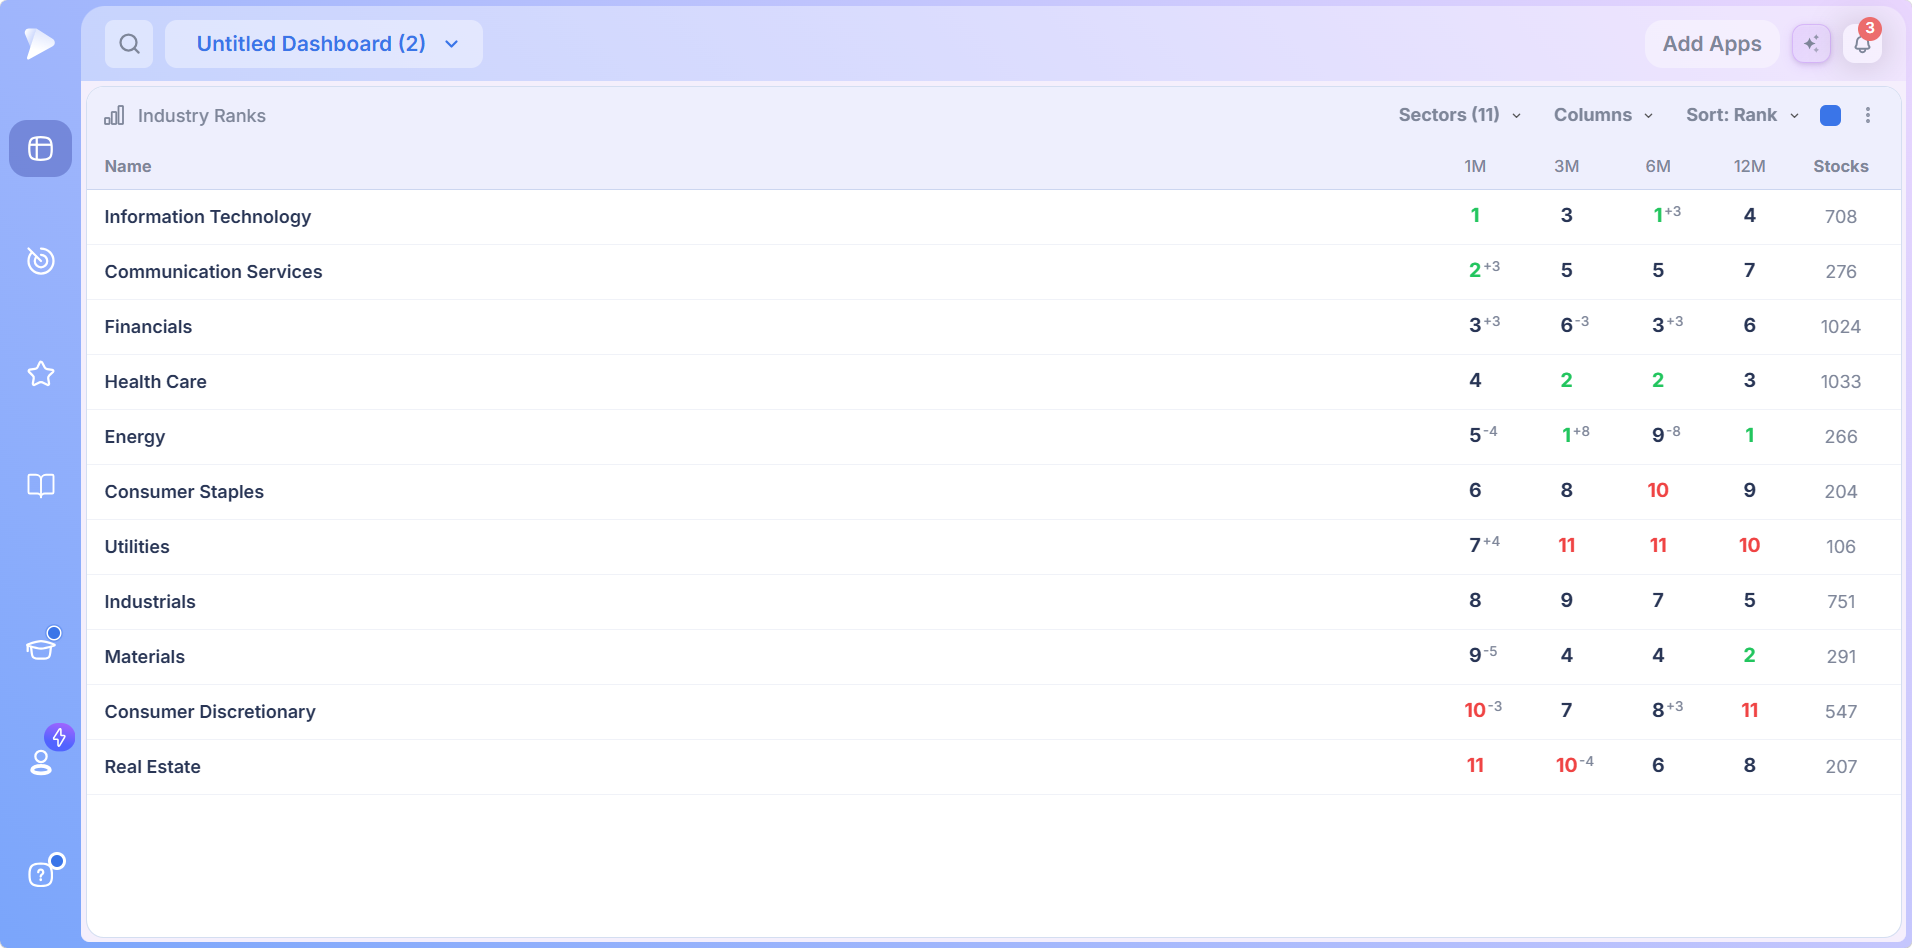
Each group also shows how much its rank has changed since the previous daily update, so you see not only which industries lead but which are climbing or falling fastest. A useful approach is two lists side by side, one sorted by rank and one by rank change: groups strong on both combine performance with improving momentum.
WatchFind leading themes to trade with the Industry Ranks widgetLearn more about Industry Ranks.
Market Brief
Updated every 15 minutes, the Market Brief uses AI to summarize the day’s market coverage, highlight what is driving price action, assess the overall tone of the session and surface key headlines, each tagged positive or negative.
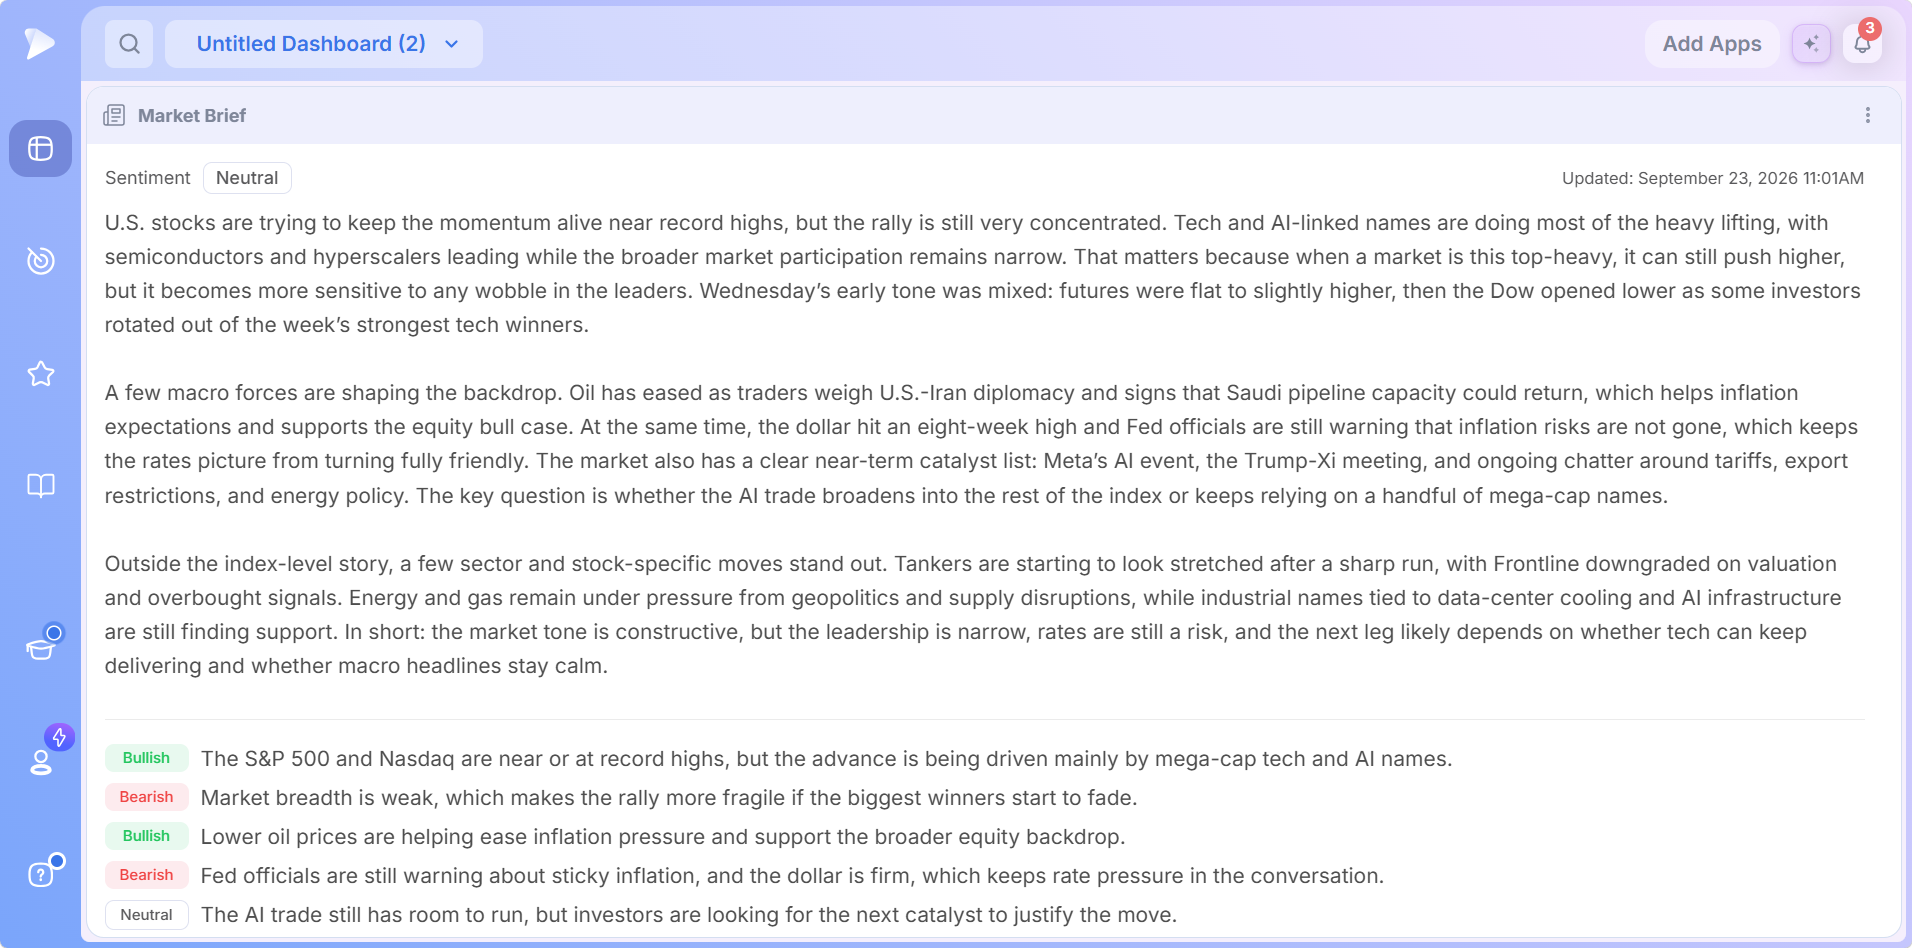
It is a quick way to understand what is shaping the market without working through several news sources, and because it updates through the session, the summary changes as new information and reactions develop.
WatchDeepvue Market Brief walkthroughLearn more about the Market Brief.
Stage Analysis
Every stock in Deepvue is assigned a market stage based on its current technical condition. Stage Analysis groups those classifications so you can see how many stocks are advancing, basing, weakening or declining within a selected group.
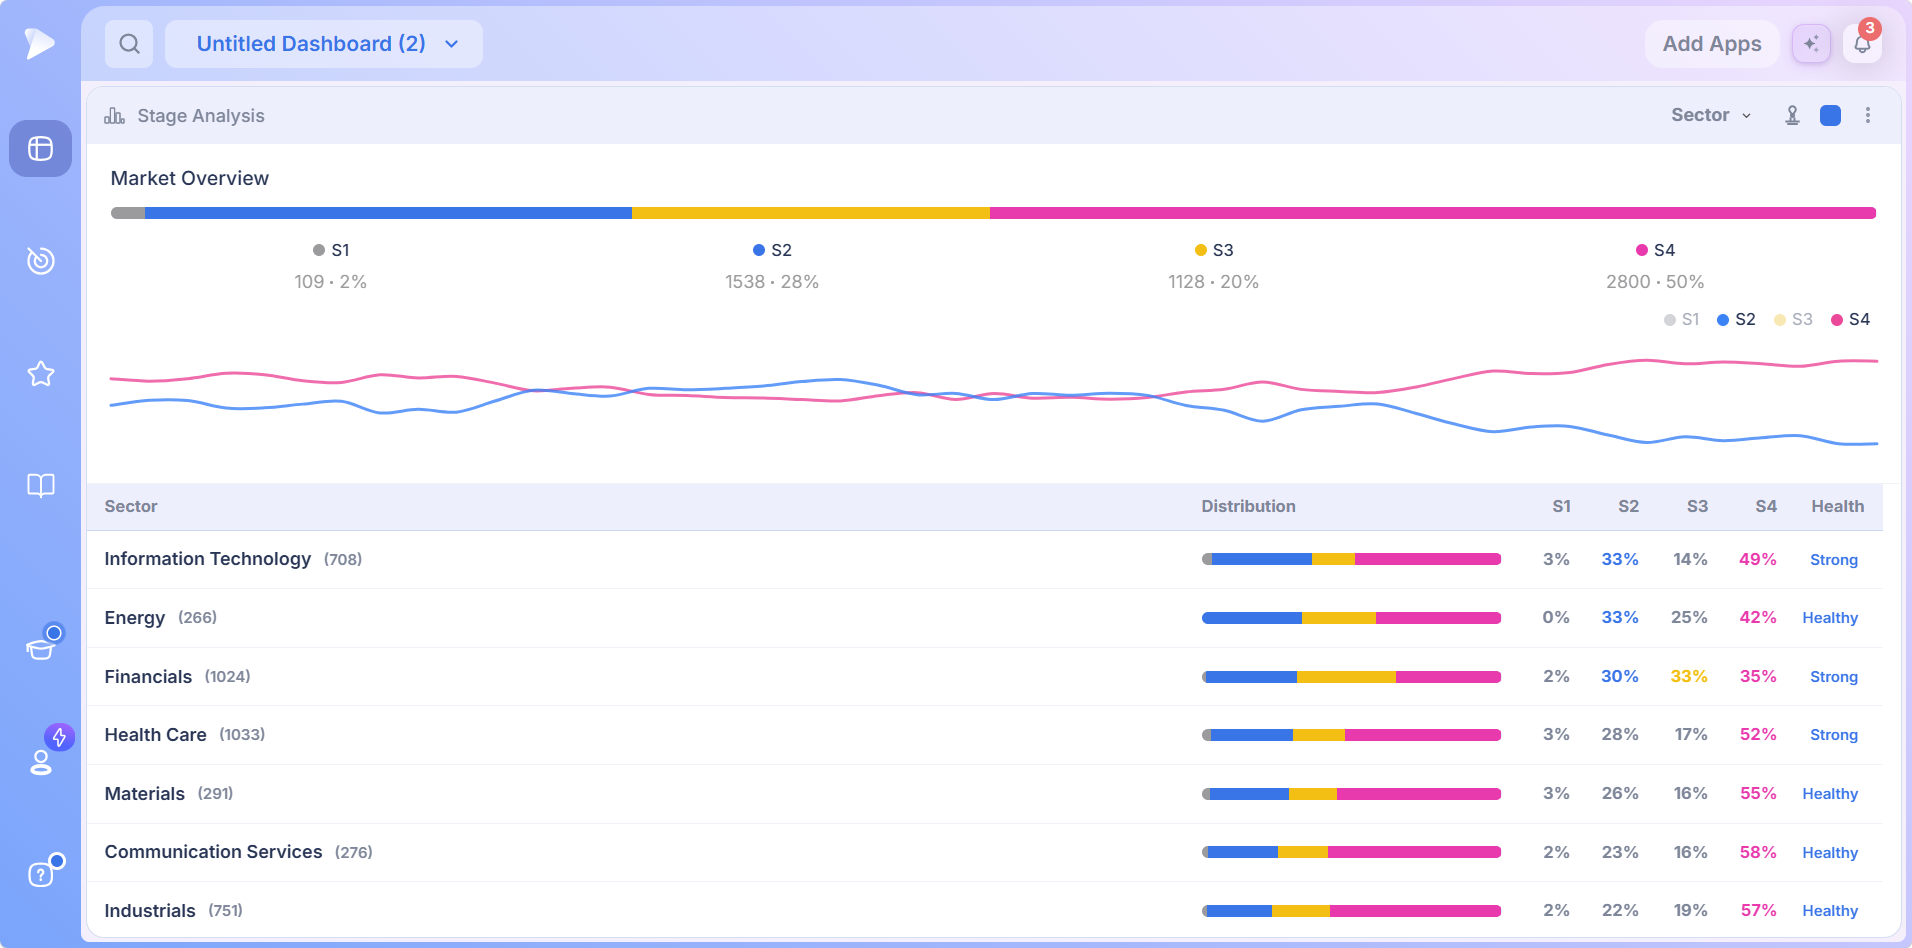
It adds context that performance rankings cannot. A group can still rank highly while more of its stocks start to weaken, and another can improve before that strength shows up in its performance. Results appear as percentages, stock counts or both, so you can tell whether a reading reflects a few stocks or a broad part of the market.
Learn more about Stage Analysis.
Top Movers
Ranks the stocks making the largest percentage moves in the session, up or down, with a short written catalyst beside every one.
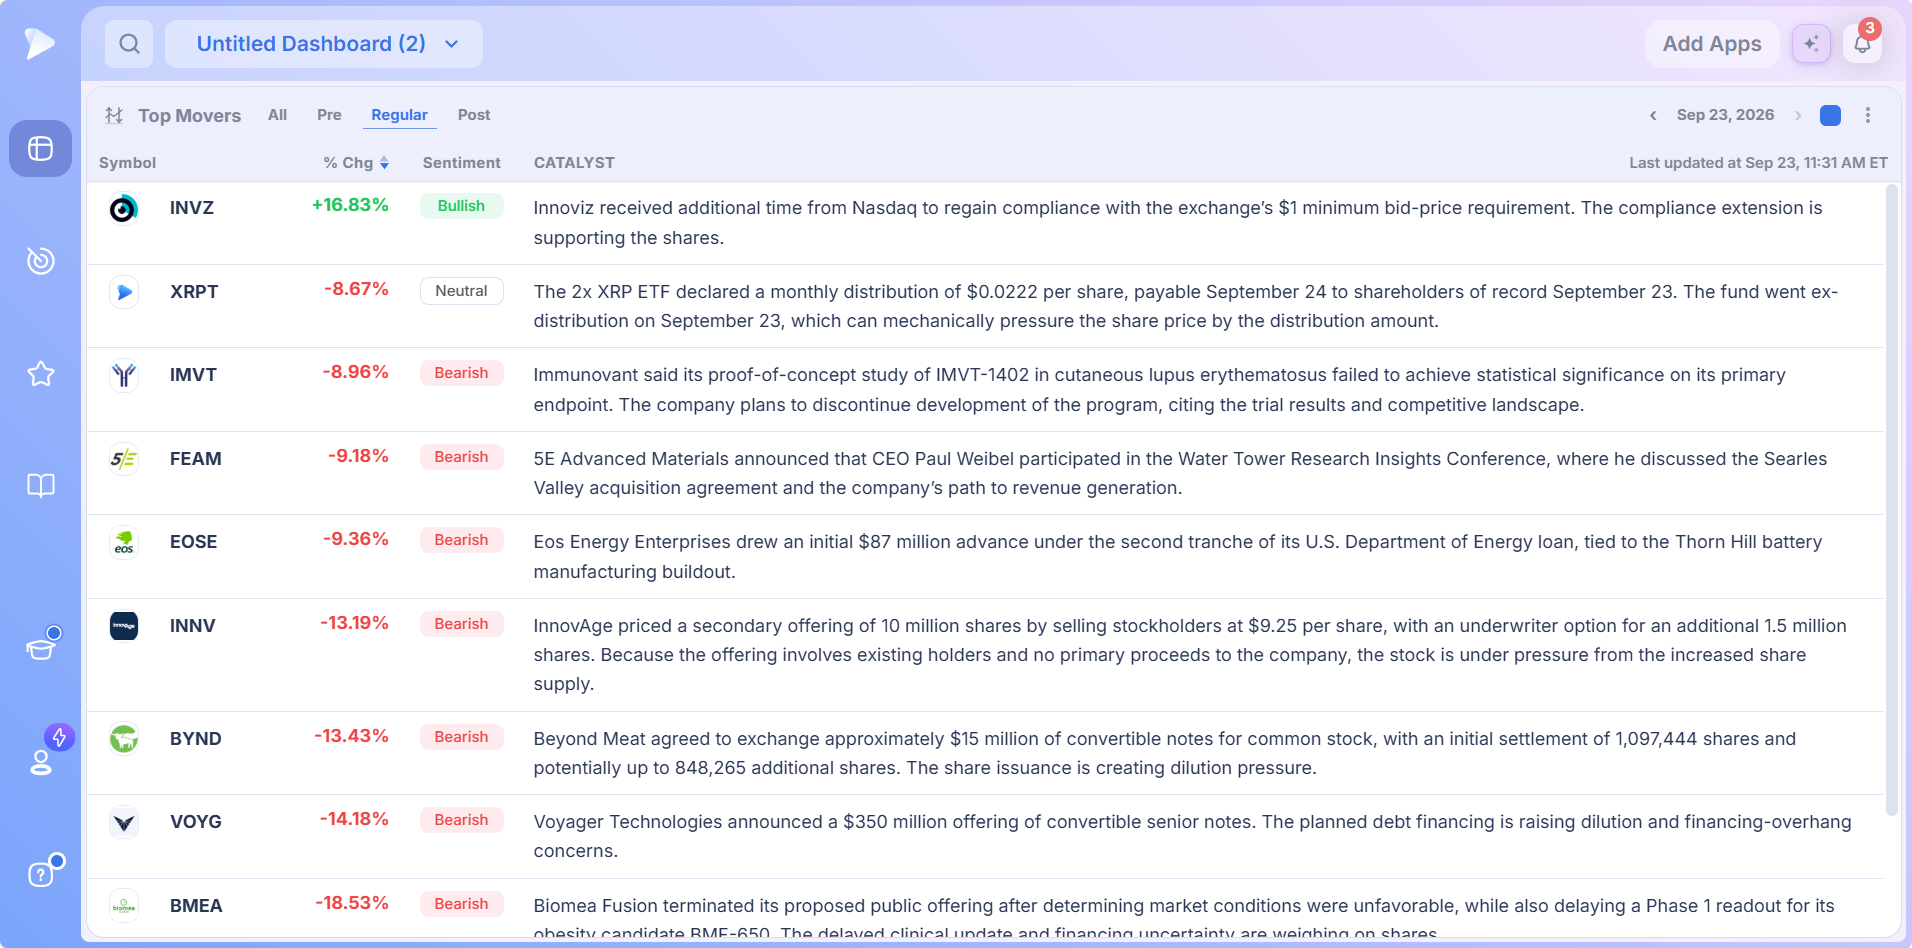
That context explains why a stock is moving, not just how far. A sharp move on strong earnings means something very different from one on a share offering. Tabs switch between All, Pre, Regular and Post, so you can view premarket, regular hours, after hours or the whole session.
Learn more about Top Movers.
Upgrades / Downgrades
Tracks the session’s analyst upgrades, downgrades, initiations and other rating changes, with the firm behind each call, the new rating and any change to the price target.
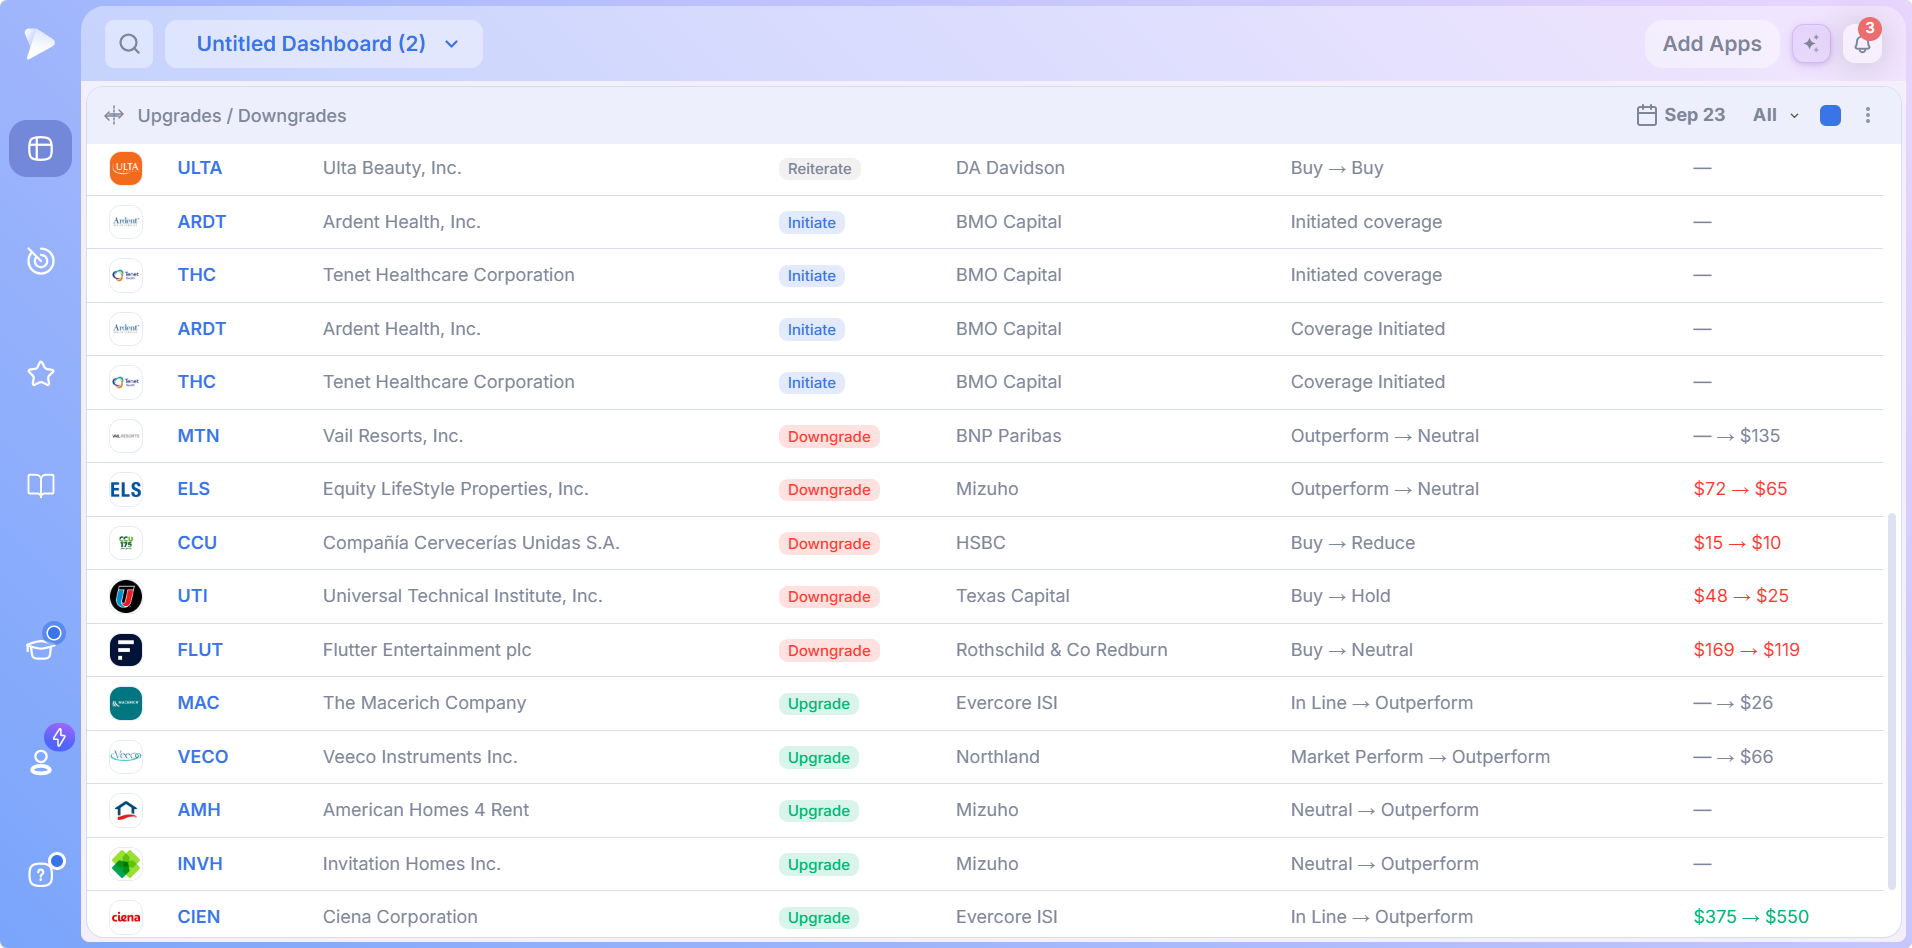
A written summary highlights the calls most worth attention before you work through the full table. Price target changes are shown separately from rating changes, so you can spot an analyst who cuts a rating but still raises the target, or the reverse.
Learn more about Upgrades / Downgrades.
How the Deepvue Research Apps Fit Together
A top down research routine can run through the group in a logical order:
Market Brief explains what is driving the market.
Market Breadth shows how widely that strength or weakness is shared.
Theme Tracker and Industry Ranks show where strength is developing across themes and industries.
Stage Analysis checks the technical condition underneath those groups.
New Highs / Lows shows where leadership and weakness are concentrated.
Top Movers and Upgrades / Downgrades cover today’s biggest moves and the analyst calls behind them.
Reports shows whether the number of stocks meeting your criteria is expanding or shrinking.
Data Panel brings company, trading, momentum, earnings and ownership data into view for the stock you select.
Together they move from the broad market down to individual stocks: what is happening, where it is happening, and which names deserve a closer look. Add any combination to a customizable dashboard, link the apps that need to track one symbol with a color group, and the group becomes one working screen instead of a series of separate tools.
Try Deepvue and put that screen together tonight.
What Makes the Deepvue Research Features Different
- ✓Market context built in, not bolted on: a stock research platform that tells you when to press as well as what to buy.
- ✓Two views of rotation, curated themes and formal GICS ranks, that confirm each other.
- ✓Condition beside performance, with stage counts and breadth alongside the rankings.
- ✓Catalysts written out for movers and analyst calls, so the reason arrives with the number.
- ✓AI market sentiment summarized every 15 minutes in the Market Brief.
For the platform as a whole, the Deepvue comparisons hub puts it against TradingView, MarketSurge, Finviz, TC2000 and TrendSpider, each broken down.
What Traders Say About Deepvue
Four independent reviews of the platform these apps belong to.
“Deepvue feels extremely well tailored to momentum trading and CANSLIM investing.”
A verified G2 reviewer. Read it on G2
“They use real-time data in their screening and charting tools at no extra charge.”
u/NeosDemocritus, posting in r/CANSLIM. See the thread
Deepvue’s dashboards are “a lot more helpful than the market overview pages” found elsewhere.
From Dave’s Day Trade Review assessment, a 4.7 overall. Read Dave’s writeup
“Swipe mode for going through charts makes it great when on the go.”
Linutor, reviewing the iPad app on the App Store. See the App Store reviews
The Deepvue reviews wall holds 220 plus verified reviews averaging 4.8, and 97 percent of the reviewers would recommend Deepvue to others.
The Other App Groups
- •Core Features: charts, the screener, the watchlist, alerts and the AI Terminal, the five you open every day.
- •Visualizations: the Heat Map, Bubble Chart, Performance Chart and Mini Chart, which draw a whole universe as a picture.
- •Tools: the Position Size Calculator, Stats Table and both calendars, each for a specific job.
- •Beyond the catalog: the Model Book module and the dashboards that hold every app, all indexed on the features hub.
What the Research Apps Cost
Each research app comes with Deepvue’s single plan at $49 per month, with monthly and annual options. Nothing is sold individually and there is no tier above it.
That one plan covers:
- •The screener and its 1,152 data points.
- •Charts, watchlists, and alerts, all of them unrestricted.
- •Fully customizable dashboards, with every app in the catalog.
- •The Theme Tracker, Market Brief, and AI Terminal, the last with unbounded usage.
Deepvue has one plan, so there are no tiers to compare. For reference, MarketSurge, the legacy platform in this niche, runs $149 per month.
New subscribers also get a one on one onboarding session with a Deepvue team member, an onboarding email series covering platform features and use cases, and weekly live webinars that each go deep on one part of the platform.
Put the Research Apps to Work
The Deepvue research apps are several market context tools reading the same market, from sentiment to structural condition, and the disagreements between them are where a stock research platform earns its keep. Each has its own walkthrough, and all of them fit onto whatever dashboard your routine needs.
Many ways to read the same market. Join Deepvue for $49 a month and add the research apps to your first screen.
↑ Back to contentsFrequently Asked Questions
Quick answers about this group of apps.
What are the Deepvue research features?
The Deepvue research features are the apps grouped under Research in the app catalog, including Data Panel, Market Breadth, New Highs / Lows, Theme Tracker, Reports, Industry Ranks, Market Brief, Stage Analysis, Top Movers and Upgrades / Downgrades. Each reads the market from a different angle.
What are the best stock market research tools?
The best stock market research tools cover the environment before the stock: market sentiment, participation, group leadership and group health. Deepvue covers all four with the Market Brief, Market Breadth, the Theme Tracker and Industry Ranks, and Stage Analysis.
How do you research a stock before buying?
You research a stock before buying by working from the outside in: read the market environment, find which groups lead and whether they are healthy, then narrow to names inside them and check the company’s numbers. Deepvue has an app for each step.
What should you look at when researching stocks?
What you should look at when researching stocks is group strength, participation and the company’s reported figures, in roughly that order. A stock’s own chart is necessary but not sufficient, because the group behind it explains much of whether a setup works; Deepvue shows all three.
How often should you check market conditions?
You should check market conditions once before the open, with a second read after the close for most multi week traders. The Deepvue Market Brief refreshes every 15 minutes if the tape turns intraday, but a weeks to months horizon does not reward constant monitoring.
How do you know if the market is bullish or bearish?
You know if the market is bullish or bearish by reading a sentiment label and confirming it with participation. The Deepvue Market Brief prints an overall read and tags each headline, and Market Breadth shows whether the index move is broad or carried by a handful of names.
What is sector rotation and how do you spot it?
Sector rotation is money moving from one part of the market to another as conditions change. Deepvue reads it two ways: the Theme Tracker scores 31 curated themes, and Industry Ranks scores the GICS hierarchy with a daily rank change. When both point at the same group, the signal is stronger.
Which is better for spotting rotation, Theme Tracker or Industry Ranks?
Neither is better for spotting rotation on its own, Theme Tracker or Industry Ranks; use both, because themes carry the story and ranks carry the structure. The Deepvue Theme Tracker is curated, so narrow pockets show up in it; Industry Ranks is exhaustive and consistent. Together they catch what either misses alone.
Which app tells me what moved today and why?
The app that tells you what moved today and why is Top Movers. It ranks the session’s largest percentage moves with a written catalyst beside each one, and Deepvue’s Upgrades / Downgrades does the same job for analyst activity.
Are the research features included in the standard plan?
Yes, the research features are included in the standard plan. Deepvue has a single plan at $49 per month that covers every research app along with the screener, charts, watchlists, alerts, dashboards, and the AI Terminal.
CAN SLIM® is a registered trademark of O’Neil Capital Management, Inc. (U.S. Reg. No. 3,081,940). Deepvue is not affiliated with, sponsored by, endorsed by, or licensed by O’Neil Capital Management, Inc., Investor’s Business Daily, MarketSurge, or their affiliates. Any reference to CAN SLIM® is for descriptive purposes only. Deepvue’s scores, ratings, and screeners are independently calculated by Deepvue and are not the proprietary ratings of MarketSurge or IBD.