Deepvue Reports: Screener Reports That Count Every Screen You Track
Deepvue Reports turns your screens into live screener reports, listing each one by name with a running count of how many stocks currently pass it. You choose the screens from a searchable picker with checkboxes, and the app draws a two column table, Name and Results, that updates as prices move.
Because it measures the size of your scans rather than their contents, it works as a breadth reading built from your own criteria.
and the table is running before your coffee cools.
Deepvue Reports, in numbers:
Key Takeaways
A screen has two useful outputs. The first is the list of names it returns, which is where everyone looks. The second is how long that list is, which almost nobody tracks and which says something the list cannot: how much of the market currently fits the setup you are hunting.
Four stocks passing a high volume screen is a different market from forty passing it.
Reports tracks that second output. It is a small table of screens and their result counts, refreshed live, and it works as a multiple screeners dashboard that answers the size question for every scan in your routine at once.
- ✓A live screener results count for every screen you pick, in a two column table with nothing else on it.
- ✓Screens come from a searchable picker covering all 169 presets and your saved screens, and a header dropdown shows how many are selected.
- ✓Counts change as prices move, so the table is a running read on how wide or narrow the environment is for each setup you track.
- ✓Built by a trader who thinks in numbers. A Deepvue co founder used a similar tool elsewhere and rebuilt it here.
- ✓No symbol, no color group. The app reports on screens rather than any single stock, so it stays put while the rest of the dashboard moves.
- ✓Included in the one plan. Get started with Deepvue here.
Screener Reports at a Glance
- Placement
- Research group in the Add Apps menu
- Table
- Two columns, Name and Results, one row per tracked screen
- Screen picker
- Searchable list with a checkbox per screen, plus Clear All and Select All
- Sources
- All 169 Deepvue preset screens plus your own saved screens
- Header dropdown
- Reads how many screens are selected and reopens the picker
- Updates
- Live; counts re evaluate as prices move
- Color group
- None, since the app follows no symbol
- Cost
- No separate charge on the one Deepvue plan
What Is the Deepvue Reports App?
It is a screener monitor for the dashboard, the simplest reports dashboard app in the catalog, a screener results dashboard reduced to its essentials. Every screen on the platform, preset or built by you, produces a result count as well as a result list. This screener report widget gathers the screen result counts for the screens you choose and lays them out in one place, so the size of each scan is visible without opening any of them.
Each screenshot captures a single moment in a single session. The screens tracked and the counts beside them are examples, and every number in your own table will differ and keep changing as the market does.
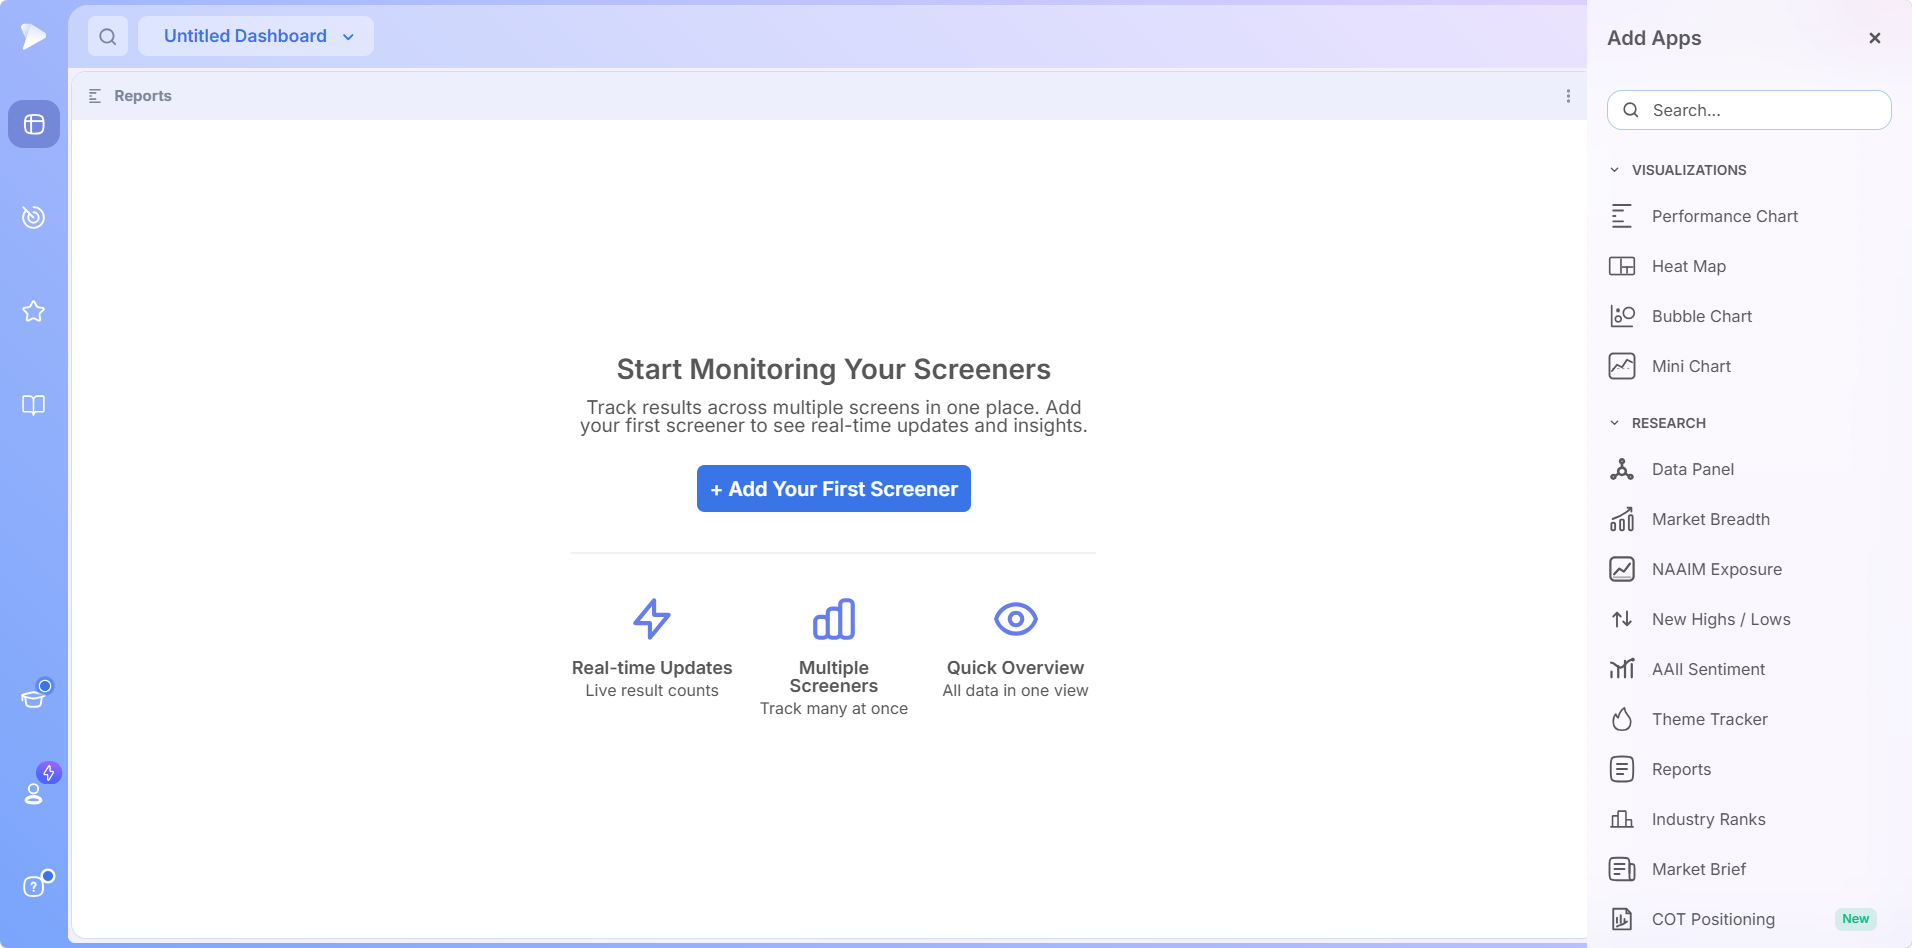
It is filed with the Research apps in the catalog. A new app opens on a short introduction rather than an empty table: a heading invites you to start monitoring your screeners, a line beneath explains that it tracks results across multiple screens in one place, and a single button offers to add your first screener. Three labels summarize the app in its own words: real time updates with live result counts, multiple screeners tracked at once, and a quick overview with all the data in one view.
Where the Idea Came From
Deepvue’s co founder described the app’s origin in a platform update webinar. He had used a similar screener report on TC2000, wanted the same thing here, and built it because, in his words, he thinks about the market numerically.
His example was tracking the number of stocks in Stage 2 against the number in Stage 4: when advancing stocks outnumber declining ones, the market is in reasonable shape, and the count tells him that without a chart. He also mentioned watching 52 week highs, a liquidity screen and the HV Edge screen the same way, day to day.
WatchDeepvue platform update webinar, including the Reports app segmentWho Reports Is For
Traders who run several screens as a routine and want a multiple screeners dashboard that says, before they open any of them, how the market is treating each setup. Positions on the platform run for weeks or months, and the counts are read on that timescale.
- ✓CANSLIM® traders counting how many names pass a strict fundamental and technical screen, since a shrinking count is an early sign the environment is tightening.
- ✓Swing traders watching the size of a tightness or volatility contraction screen for the moment it starts to grow.
- ✓Position traders tracking a leaders screen and a volume screen side by side across a longer hold.
- ✓Anyone who thinks about markets in numbers, which is exactly the trader the app was built by and for.
The Deepvue for hub carries a routine for each style.
Choosing the Screens to Track
Press the button and a picker opens. A search box up top finds a screen by name, and beneath it screens are listed with a checkbox each: all 169 Deepvue presets, plus your own saved screens. Two buttons at the foot clear every selection or select all at once.
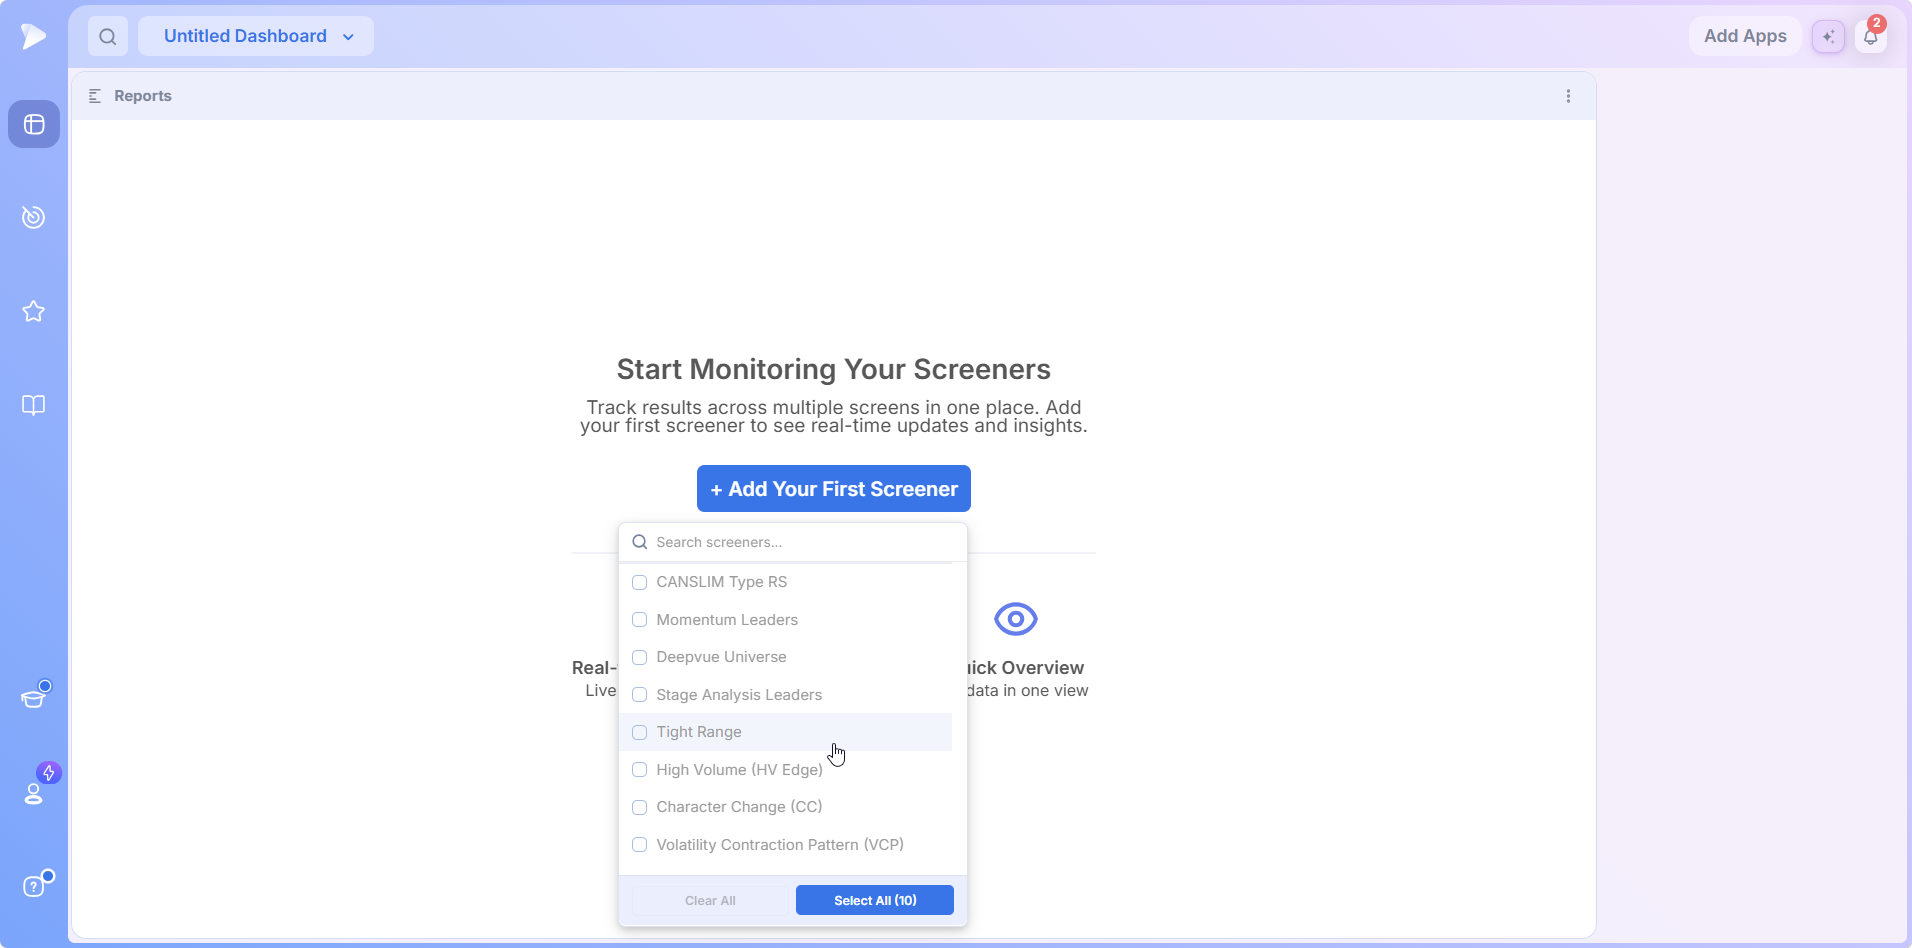
The list includes Deepvue house screens such as CANSLIM® Type RS, Momentum Leaders, Deepvue Universe, Stage Analysis Leaders, Tight Range, High Volume (HV Edge), Character Change and the Volatility Contraction Pattern screen. Your own saved screens appear too, including any copy of a preset you have duplicated and edited, which is the point: a screener monitor is most useful tracking the exact criteria you trade.
Tick the screens you want and the introduction gives way to the table. The header then carries a dropdown reading how many screens are selected, and clicking it reopens the picker, so the list you track is never fixed.
Sign up with Deepvue and this screener report widget is a two minute setup.
Reading the Screener Results Count
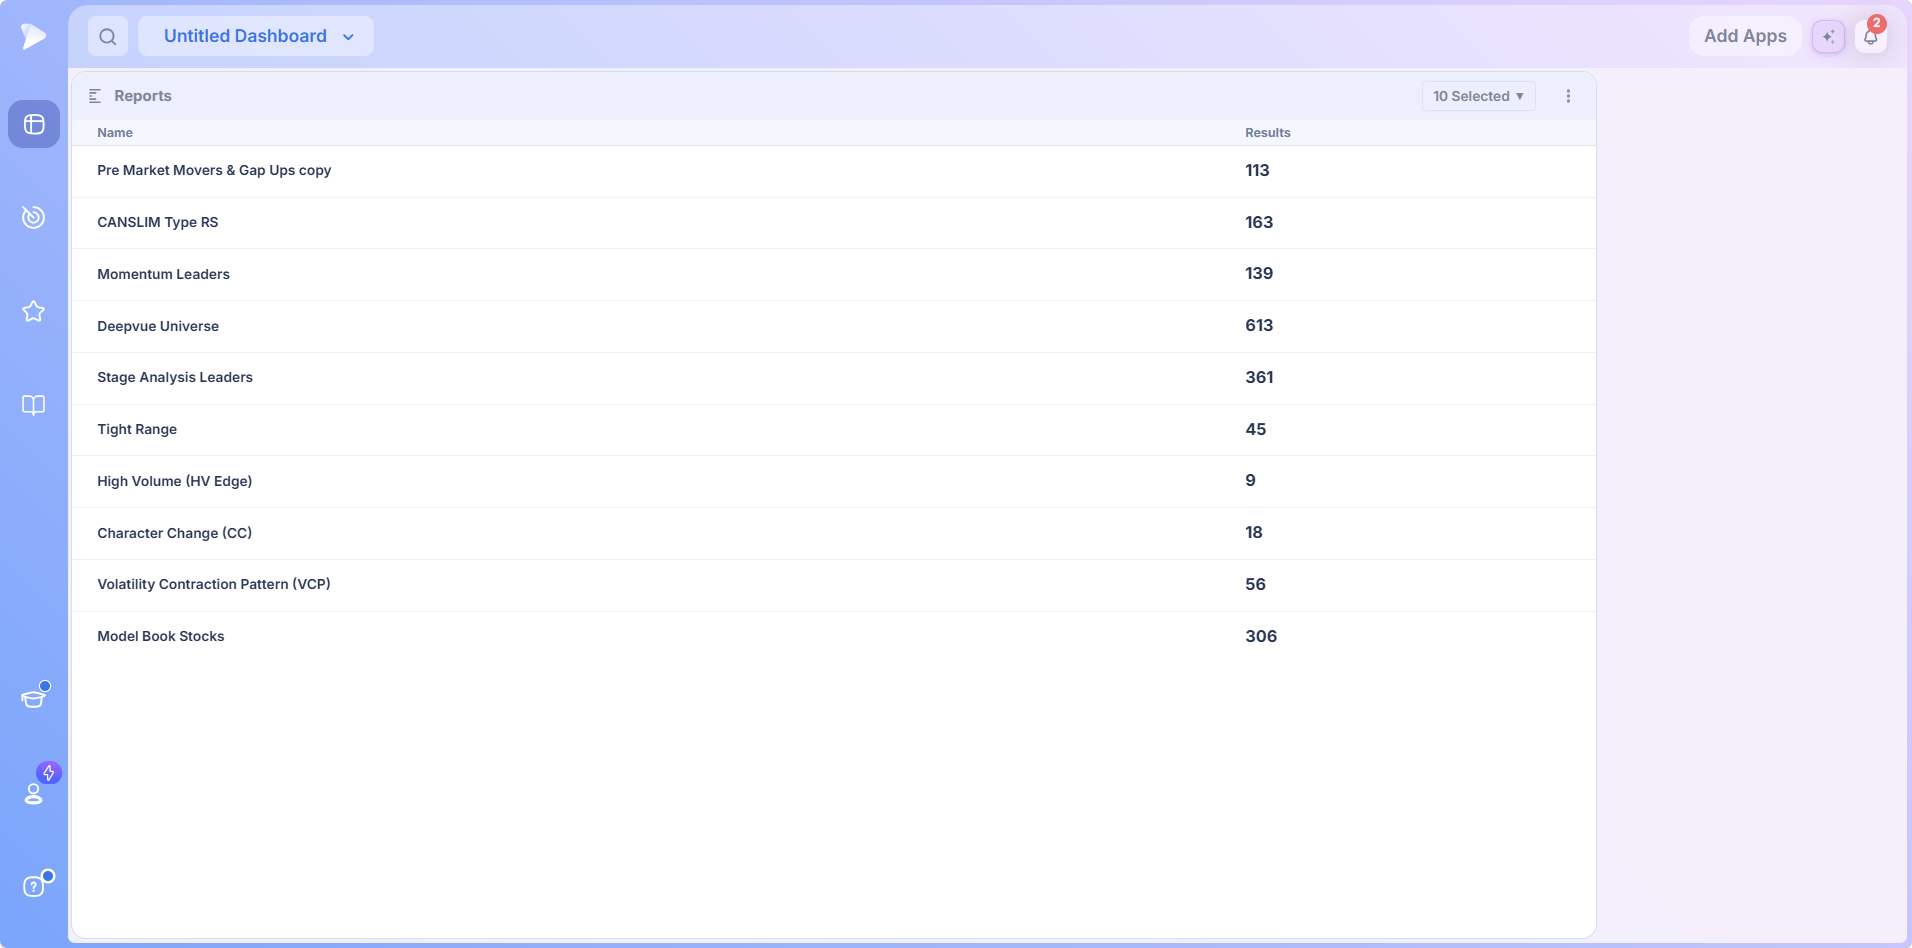
At full width this screener results dashboard is exactly as plain as it looks, and the counts alone tell a story.
In the ten screen example, the broad universe and trend screens return counts in the hundreds, while the signal screens that require something unusual to happen, a high volume event or a character change, land in single digits or the low tens. That contrast is the reading: plenty of names in trend, very few showing the event this method waits for. On another day the same screens could invert that picture, which is exactly why the table is worth watching.
| Column | What it holds | How to read it |
|---|---|---|
| Name | The screen exactly as it is named in the screener | Which scan the row describes |
| Results | The number of stocks currently passing the screen’s filters | Larger means the setup is common right now; smaller means it is rare |
The Counts Are Live
With 568 of the platform’s 1,152 data points arriving over WebSocket, screens re evaluate continuously as prices change. Leave the table open and the counts drift: a name or two leaving one screen, another joining a second. That drift is what it looks like to track screener results in practice, and any screen you open in the screener reports the same figure the table does.
Notice what the header lacks. Reports carries only its name, the selection dropdown and a menu, with no color group square. It has no symbol to follow, so it takes no part in the color group and stays put whatever the rest of the dashboard is doing.
How to Add Reports to a Dashboard
Pick the board you want it on and call up Add Apps.
Find Reports in the Research group and click it to add it to the dashboard.
Click Add Your First Screener, tick the screens that make up your routine, and the table fills with their counts.
The one real decision is which screens. Pick the ones whose size you would genuinely act on, and keep the list short enough to read at a glance.
Three Ways to Read Your Screener Reports
Stage 2 Against Stage 4
The co founder’s own example. Track a screen for advancing stocks and a screen for declining stocks, and read the counts against each other. More advancing than declining is a market where setups have room to work; the reverse is a market to press less in. The Market Breadth app gives the same read for the whole universe, while Reports lets you build it from the exact screens you trust.
The Signal Screen Watch
Screens that require an event, a high volume close, a pocket pivot, a character change, spend most days nearly empty. Their count is the signal. Track screener results like these in the table, and the day a count jumps from a handful to dozens is the day something has changed in the tape, visible before you have looked at a single chart.
The Setup Supply Gauge
Track your favorite setup screen, whether a tightness screen, a VCP screen or a CANSLIM® screen, and watch its count over the week. A rising supply of setups usually precedes a run of breakouts; a count that has thinned to almost nothing tells you to lower expectations and size. When a number surprises you, the AI Terminal can tell you what is behind it.
Start with Deepvue and put a live count on the screens you actually trade.
What Makes Deepvue Reports Different
Most platforms make you open each screen to learn how many names it returns. Reports turns that number into the product:
- ✓Counts, not lists, so the size of every scan in your routine is readable in seconds.
- ✓Your own criteria, since saved and duplicated screens track alongside all 169 Deepvue presets.
- ✓Live, not end of day, because the counts re evaluate as prices move.
- ✓On the dashboard you already use, beside the charts and screens the counts point you to.
No platform is right for everyone, and the honest way to decide is a proper comparison. Our Deepvue comparisons hub sets Deepvue against MarketSurge, TradingView, TC2000, TrendSpider, and Finviz feature by feature.
What Traders Say About Deepvue
Quoted exactly as published, each touching on screening.
“It’s really the best screener I’ve ever used.”
Posted by u/Trading_Intern987, r/CANSLIM. Open the thread
“Deepvue has way more options for screening.”
A MarketSmith subscriber weighing the two platforms, r/CANSLIM. See the discussion
“I was very impressed by the flexibility of DeepVue’s screen creator.”
Dave, writing for Day Trade Review. Read his review
“One of the best trading tools out there and I can’t trade without it.”
Joshua Fong, Google Play review, November 2025. View the listing
Deepvue’s reviews page averages 4.8 from over 220 verified reviewers.
Where Reports Connects
- •The screener for the lists behind every count, and for building the custom screens worth tracking; the Ultimate Screening Guide explains the process, and the screener by strategy pages index the preset approaches.
- •Stage Analysis for the full market stage read that Reports lets you rebuild from your own screens.
- •The Performance Chart and the Heat Map for what the stocks inside a screen are doing, once the count says it is worth opening.
What Reports Costs
Reports is included in Deepvue’s single plan at $49 per month, with monthly and annual options, and dashboard apps carry no separate charge.
That one plan covers:
- •The screener and its 1,152 data points.
- •Charts, watchlists, and alerts, all of them unrestricted.
- •Fully customizable dashboards, with every app in the catalog.
- •The Theme Tracker, Market Brief, and AI Terminal, the last with unbounded usage.
Deepvue has one plan, so there are no tiers to compare. For reference, MarketSurge, the legacy platform in this niche, runs $149 per month.
New subscribers also get a one on one onboarding session with a Deepvue team member, an onboarding email series covering platform features and use cases, and weekly live webinars that each go deep on one part of the platform, dashboard apps included.
All 169 presets are in the picker from day one, since every screen is part of that price.
Count Before You Look
The length of a screen’s result list is information most traders throw away. Kept on a dashboard as a live number, it becomes a breadth gauge tuned to your own criteria: how many names fit the setup today, and whether that is more or fewer than yesterday. Screener reports of that kind are the whole idea, delivered in a two column table.
Get started with Deepvue and read the market in the numbers you already trust.
↑ Back to contentsFrequently Asked Questions
Questions that come up before screener reports join a daily routine.
What is the Deepvue Reports app?
The Deepvue Reports app is a reports dashboard app listing the screens you choose alongside a live count of how many stocks currently pass each one. It is a two column table, Name and Results, with a picker for choosing screens and nothing else to configure.
What is a stock screener report?
A stock screener report is a summary of how many stocks pass each of your screens, rather than the list of names inside them. Deepvue Reports builds one live on your dashboard, so the size of every scan in your routine is visible without opening a single screen.
What does the number of stocks passing a screen tell you?
The number of stocks passing a screen tells you how common that setup is right now, a breadth reading for that exact setup. In Deepvue Reports, a rising count on a setup screen often leads a run of breakouts, while a shrinking one is a cue to expect fewer opportunities and size down.
How do I monitor multiple screeners at once?
You monitor multiple screeners at once in Deepvue with the Reports app. Pick as many screens as you like from the searchable picker, and each appears in a two column table with a live count beside it, so you can read how the market is treating every setup without opening one.
Which screens can I track in Reports?
You can track any of Deepvue’s 169 preset screens and your own saved screens in Reports, chosen from a searchable picker with a checkbox beside each. Duplicated and edited copies of presets appear too, so the table can follow the exact criteria you trade.
How do I add or remove screens once the table exists?
You add or remove screens once the table exists by clicking the dropdown in the Deepvue Reports header, which reads how many screens are selected and reopens the picker. Tick or untick screens individually, or use Clear All and Select All at the bottom.
Do the screener result counts update automatically?
Yes, the screener result counts update automatically. Deepvue Reports offers real time updates and live result counts, and screens re evaluate against live prices as the session moves.
Can screener results be used as a market breadth indicator?
Yes, screener results can be used as a market breadth indicator, and that is the core idea of Deepvue Reports. Track a screen for advancing stocks against one for declining stocks and the two counts become a breadth read built from your own criteria.
Why is the same screen showing a different count than earlier?
The same screen shows a different count than earlier because stocks move in and out of it as prices change. In Deepvue Reports that change is often the useful information rather than a problem, since it shows a setup becoming more or less common.
Does Reports show which stocks are in each screen?
No, Reports does not show which stocks are in each screen; it shows the count only. To see the names behind a number, open that screen in Deepvue’s Screener module, where the full result list appears.
Why is there no color group square on the Reports app?
There is no color group square on the Reports app because it describes screens rather than any single stock, so it has no symbol to follow. Other apps on the same Deepvue dashboard can still share a color group without affecting it.
Can I compare two screens as a ratio?
No, you cannot compare two screens as a ratio in the current Deepvue Reports interface. Each screen shows its own count in its own row, so any comparison between two screens is one you read across rows yourself.
Where did the Reports app come from?
The Reports app came from a screener report a Deepvue co founder used on TC2000 and rebuilt for Deepvue, describing himself as someone who reads the market numerically. Tracking Stage 2 stocks against Stage 4 stocks was the example he gave.
Is Reports useful for day trading?
No, Reports is not a day trading tool. Its counts gauge how common a setup is over days and weeks, matching the multi week holds Deepvue is built for, rather than acting as an intraday trigger.
Is Reports included in the standard Deepvue plan?
Yes, Reports is included in the standard Deepvue plan. Deepvue has a single plan at $49 per month that covers Reports along with the screener, charts, watchlists, alerts, dashboards, the Theme Tracker, the Market Brief, and the AI Terminal.
CAN SLIM® is a registered trademark of O’Neil Capital Management, Inc. (U.S. Reg. No. 3,081,940). Deepvue is not affiliated with, sponsored by, endorsed by, or licensed by O’Neil Capital Management, Inc., Investor’s Business Daily, MarketSurge, or their affiliates. Any reference to CAN SLIM® is for descriptive purposes only. Deepvue’s scores, ratings, and screeners are independently calculated by Deepvue and are not the proprietary ratings of MarketSurge or IBD.