Model Book: Build a Trading Playbook of the Setups You Actually Trade
A Deepvue model book is your own library of chart examples: past winners, failed setups, anything worth studying again. Save any chart exactly as you have it configured, drawings included, then file it into a book, tag it by setup, add a note and a performance stat, and share the book by link.
Preset books built by the Deepvue team cover base breakouts, high tight flags, episodic pivots, high volume closes, IPO bases, undercut and rally setups, parabolic shorts and more. It opens as its own module, separate from the dashboard, and comes with the one $49 per month plan.
and study annotated past winners tonight, then start your own book.
The Deepvue model book, in numbers:
Key Takeaways
Somewhere on your hard drive is a folder of chart screenshots. A few have real names; the rest are whatever your machine called them. You kept every one because it taught you something, and you have opened almost none of them since.
Saving was never the hard part. What breaks is everything after: staying organized, remembering why a chart mattered, and actually going back to look. The Model Book puts that whole library inside the platform, one click from the chart you already have open.
- ✓Snapshots, not screenshots: every saved chart keeps its point in time, settings and annotations, and stays editable long after you save it.
- ✓Preset books to study past winners, every chart annotated and written up, with a measured move beside many of them.
- ✓Tags do double duty: they filter inside a book, and they assemble collections that pull every matching example from every book you own.
- ✓Notes carry the why, the catalyst, the theme, the numbers, so a chart still makes sense five years from now.
- ✓Shareable by link, with or without keeping future edits in sync.
- ✓Part of the one plan. Open the preset model books in Deepvue.
Model Book at a Glance
- What it is
- Your own library of saved chart examples, organized into books
- Two tabs
- My Model Books for yours and a Shared folder, Presets for the ready made collections
- Two sub tabs
- Model Books for the books you built, Tags for collections assembled from a tag
- A saved chart
- Keeps the point in time, the chart settings and the annotations, and stays editable
- Per chart controls
- Edit snapshot, edit note, tags, Move to another book, performance stat and delete
- Filters
- Narrow a book by tag or timeframe, or group everything by symbol
- Sharing
- An unlisted link any signed in Deepvue user with Pro access can add to their own books
- Where to find it
- Its own module in the left navigation, plus a Model Book icon in the chart toolbar
- Cost
- Included in the $49 per month plan, nothing to add
What a Model Book Is, and Why the Best Traders Keep One
A model book is a collection of chart examples that together form a blueprint for the trades you want to take. Not a gallery: a trading playbook you work from.
The idea is older than most charting software. William O’Neil published The Model Book of Greatest Stock Market Winners in 1971, built from a study of what the best performing stocks had in common before they moved, and that research became the foundation of CANSLIM®. He did not start from a theory. He started from outcomes and worked backward to the characteristics.
The argument has not changed. Patterns repeat because the people making them repeat, and the same bases, volume signatures and shakeouts show up decade after decade. A stock model book trains your eye to catch them early instead of in hindsight, which is the whole reason traders study past winners at all. And the value is not in owning the book; it is in building it. Deciding what qualifies, and noticing that the tight inside day keeps appearing right before the breakout, is the work that changes your entries.
Why Most Model Books Never Get Built
A Deepvue workshop poll found 98 percent of attendees believed building a model book would improve their trading, and around 80 percent had not built one in the previous six months. Three things get in the way:
- •Time. Collecting, annotating and organizing, and until now every step was manual.
- •Chaos. Screenshots scatter across the desktop, cloud drives and a phone camera roll. One trader described 40 gigabytes of charts with no structure at all.
- •Dead charts. A screenshot is frozen. You cannot zoom it, redraw it, or add the indicator you started using last year, and it carries none of the context behind the move.
The Model Book was built against that list, which is the most useful way to read what each part of it does.
Who the Model Book Is For
- ✓Traders who keep screenshots and have never once gone back through them in an organized way.
- ✓CANSLIM® traders working the way the methodology was built, from the characteristics of past leaders forward. Deepvue for CANSLIM® traders covers that routine.
- ✓Swing and position traders with one or two setups they want to know better than anyone else.
- ✓Traders in a drawdown who need study time rather than screen time, and want the evenings to count.
- ✓Educators and trading groups who would rather hand over a working library than a slide deck.
It Is Its Own Module, Not a Dashboard App
Worth settling up front, because it is the thing people get wrong. The Model Book is not an app you add to a customizable dashboard. It is a separate module that takes over the window, and you leave it on purpose. There are two ways in.
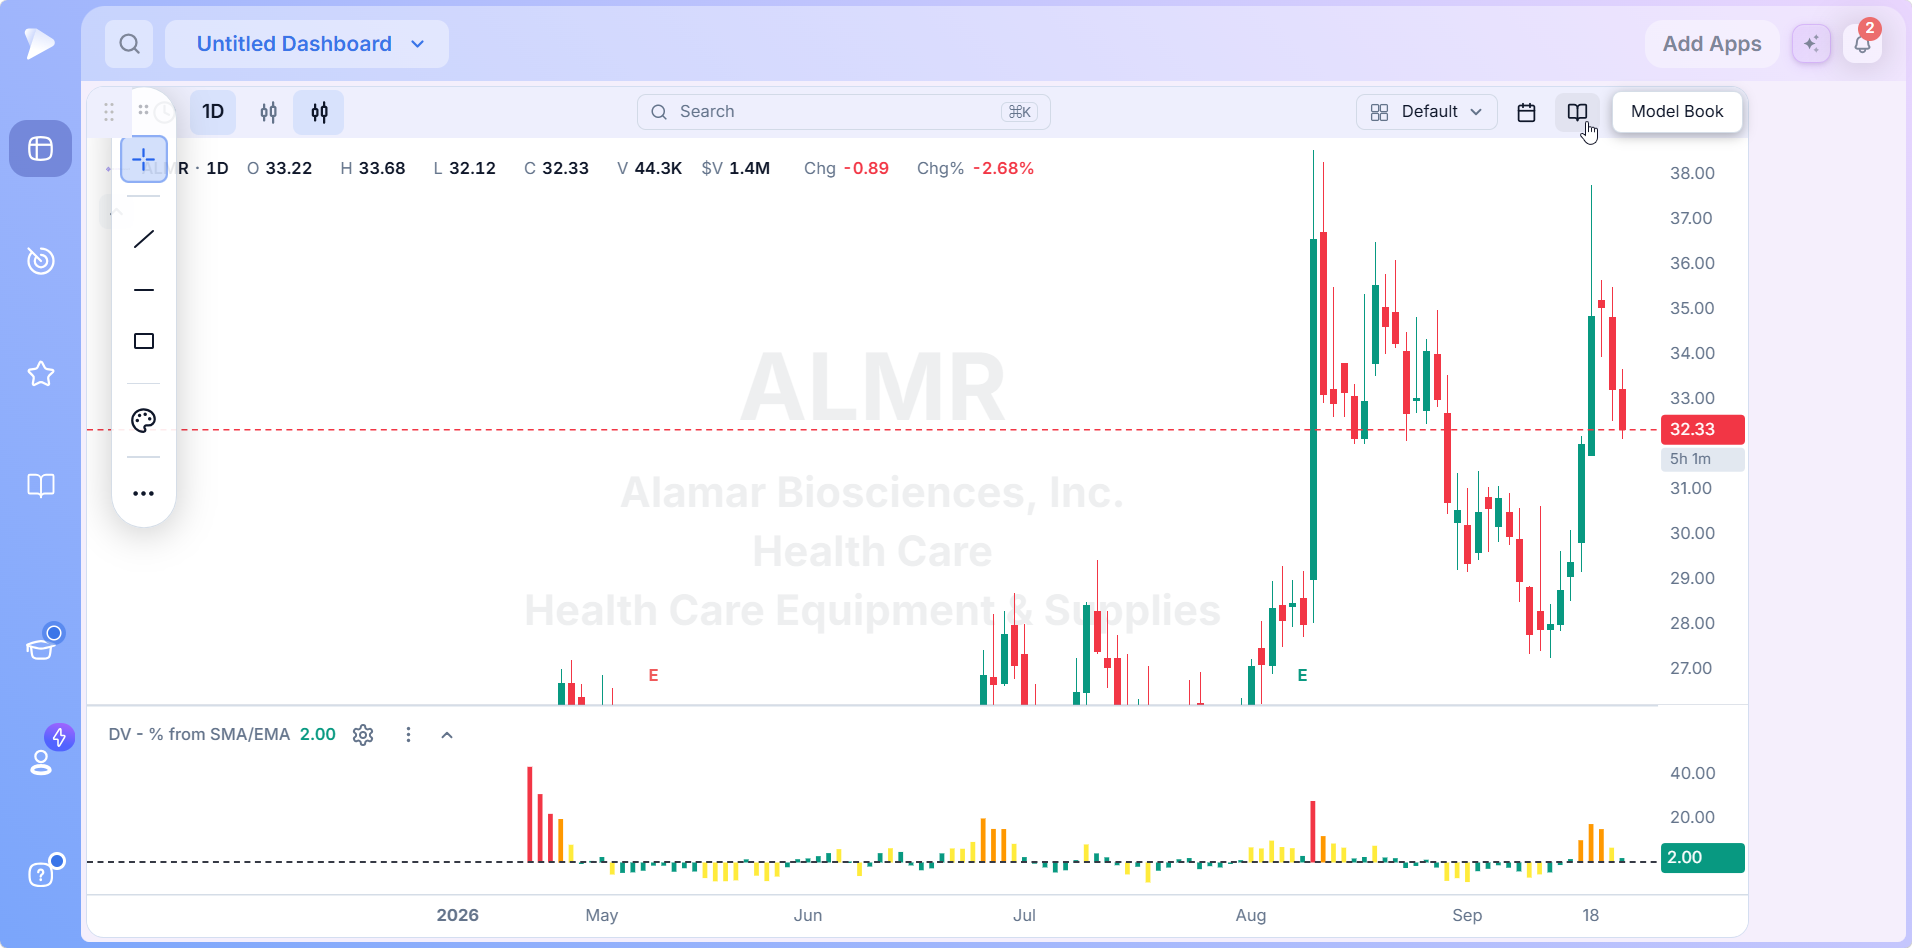
- •From the left navigation. The Model Books module has its own icon in the sidebar, alongside the screener, charts and watchlist modules.
- •From a chart. The Model Book icon in the chart’s top right toolbar opens the module in one click.
To get back to your dashboard, click Exit Model Book in the top right corner. Nothing is broken; the module simply owns the window while you are in it.
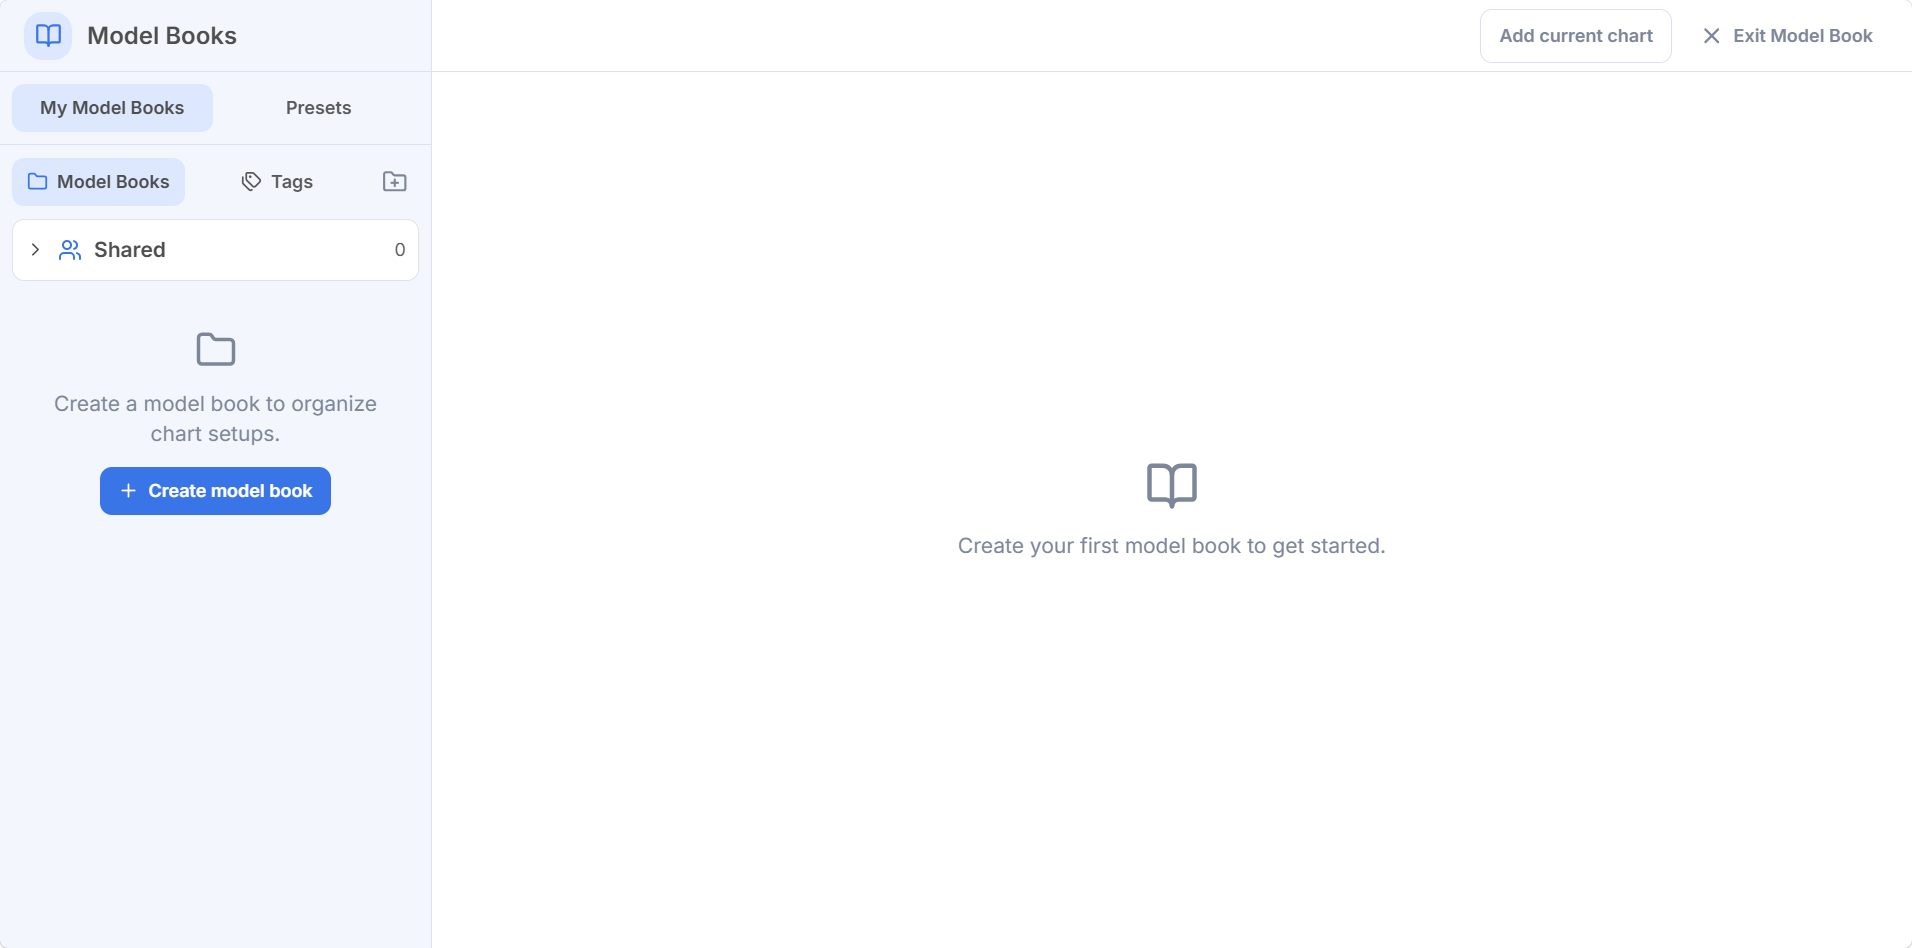
The layout never changes. My Model Books and Presets across the top, Model Books and Tags beneath them, your books down the left, the selected book filling the rest of the screen, and Add current chart and Exit Model Book at the top right. The Shared folder collects books other traders have shared with you.
Start With the Presets
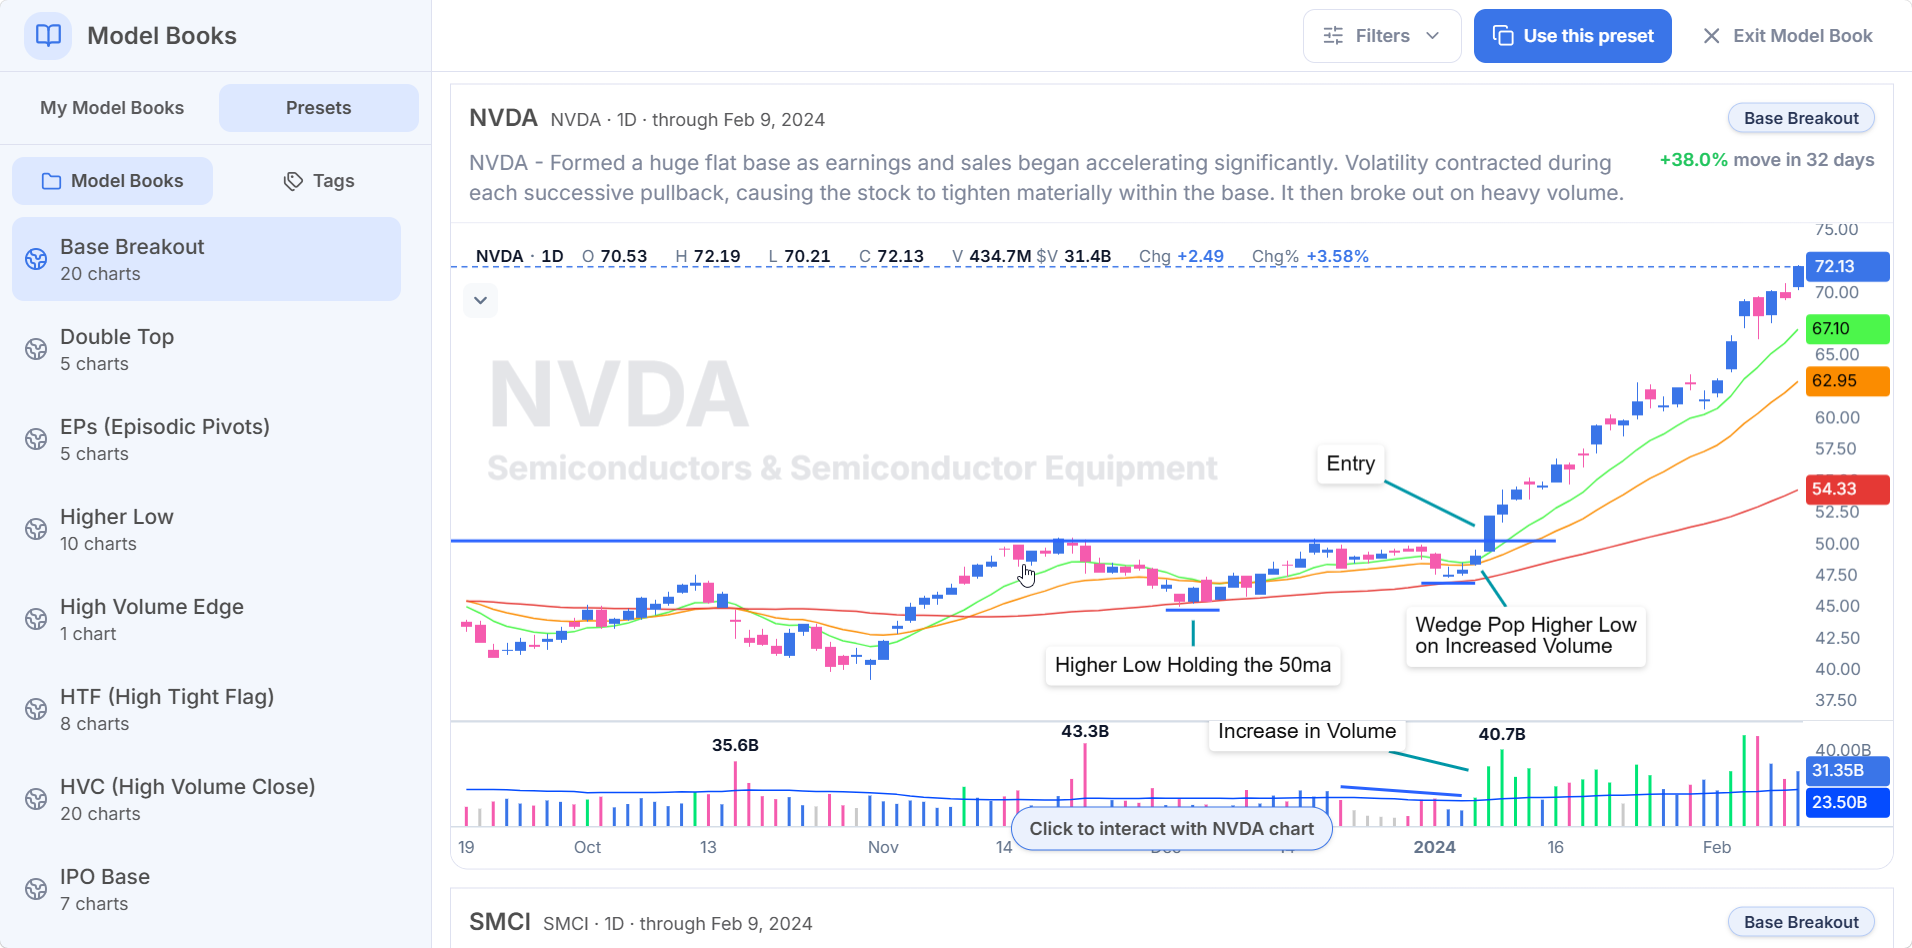
You do not have to build anything to get value on day one, and the presets are the fastest way to study past winners. Open the Presets tab and finished books are already there, each one a setup with real examples and a written breakdown above every chart.
| Preset book | What it collects |
|---|---|
| Base Breakout | Flat bases and consolidations resolving upward on expanding volume |
| Double Top | Failures at a prior left side peak, read from the short side |
| EPs (Episodic Pivots) | Gaps on a fundamental catalyst that start a sustained move |
| Higher Low | Constructive higher lows holding key moving averages |
| High Volume Edge | Gaps on exceptional volume that hold and follow through |
| HTF (High Tight Flag) | Steep flagpoles resolving into short, tight consolidations |
| HVC (High Volume Close) | Entries through a prior high volume close out of a base |
| IPO Base | First bases formed by recent new issues |
| Parabolic Short | Blow off price action failing after consecutive gap ups |
| U&R (Undercut & Rally) | Undercuts of a prior low that reverse and rally back through it |
More books are being added, including collaborations with traders who have spent years on a single setup, so treat the list as where it stands rather than where it stops.
These are not stock illustrations of chart patterns. Every example is a real name at a real date, drawn on, measured and explained in a sentence or two above the chart.
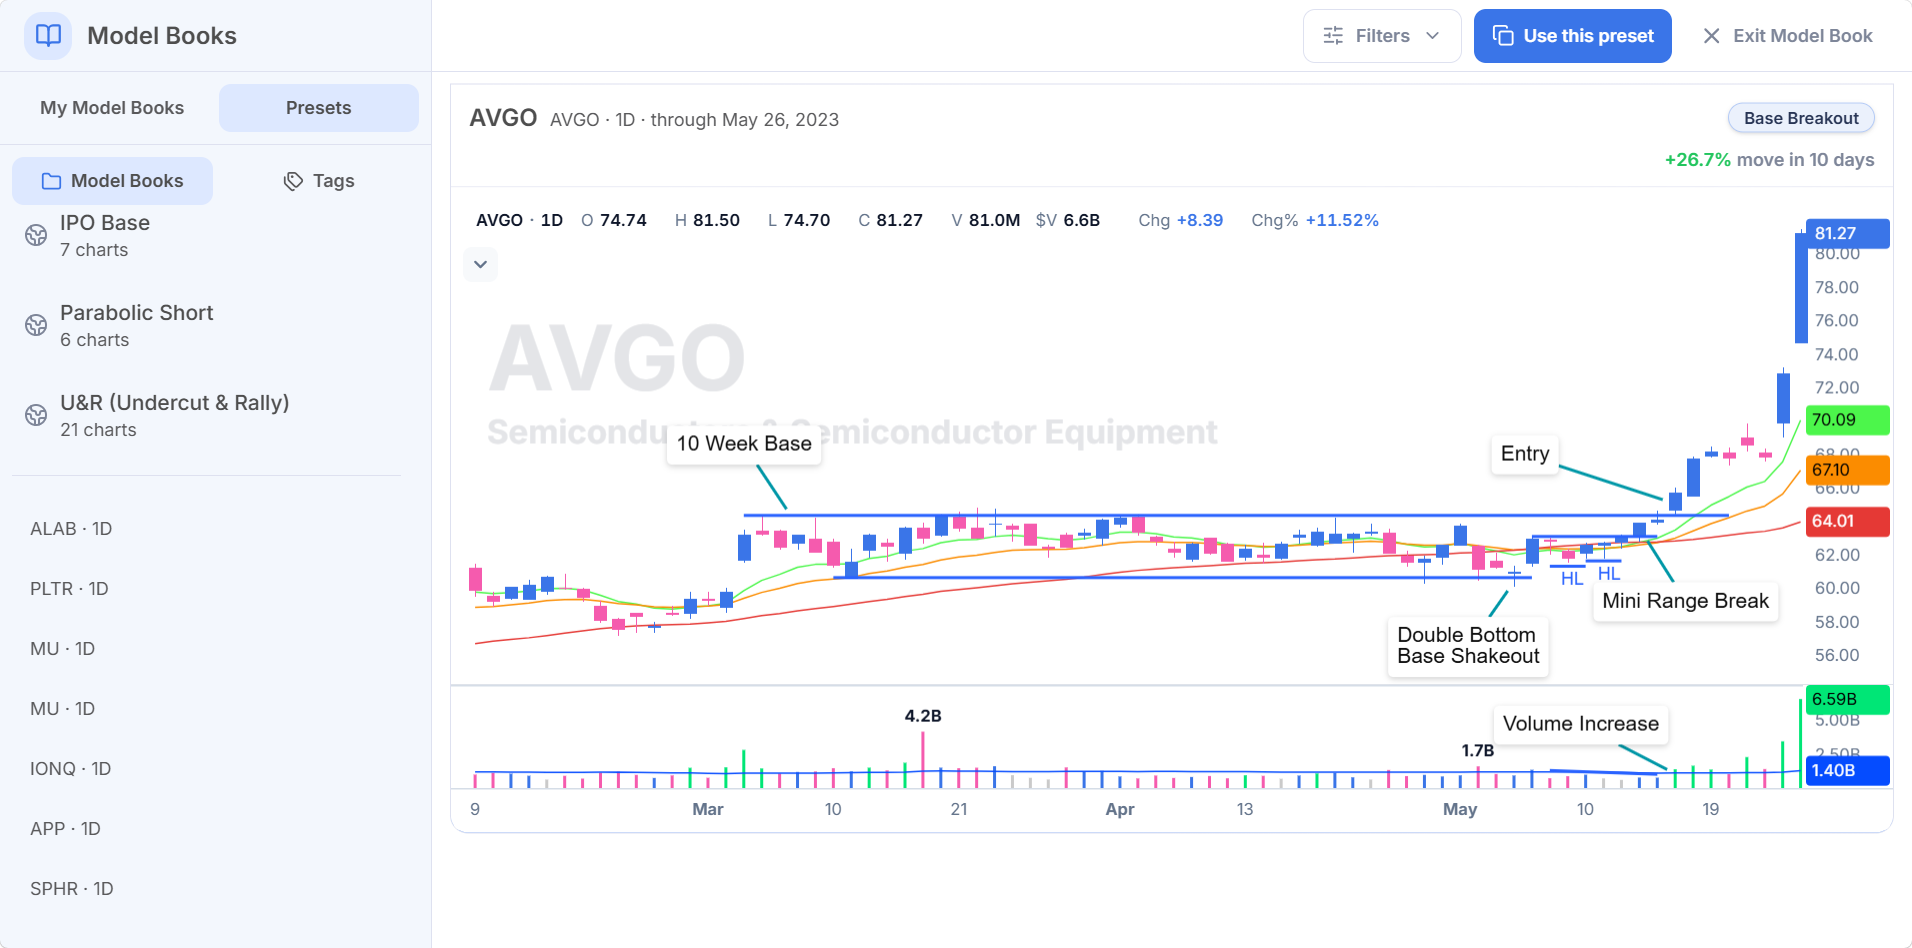
That is the difference between studying a preset book and reading a textbook diagram. A diagram tells you what a base breakout is. An annotated example shows you where volatility contracted, where volume dried up before it expanded, and which bar the entry actually was. The write up says what happened; the annotations say where to look.
- •The short side gets the same treatment. The Double Top book collects moves that ran hard into a prior left side peak and failed there, with the entry and the size of the unwind marked.
- •Episodic pivots pair the fundamental catalyst with the price reaction: the gap, the entry day and the volume expansion underneath it.
- •The high tight flag book covers the pattern everyone talks about and few can identify in real time, with the flagpole and the flag measured on each example.
- •The parabolic short book collects the other end of a move, so studying it beside the breakout books teaches you to tell an early move from a late one.
Many examples carry a measured move in the corner, the size of the advance and how many days it took. A card stays still until you click to interact with it, and Filters work on preset books exactly as they do on your own. Use this preset copies the whole book into your library, so you can add to it, retag it or redraw the charts however you like.
Join Deepvue and every preset book is yours to study tonight.
Build Your Own Model Book
Click Create model book, give it a name, and you are done. The name field takes up to 120 characters and the optional description up to 4,000, which is more room than you think you need until you start writing down what actually qualifies.
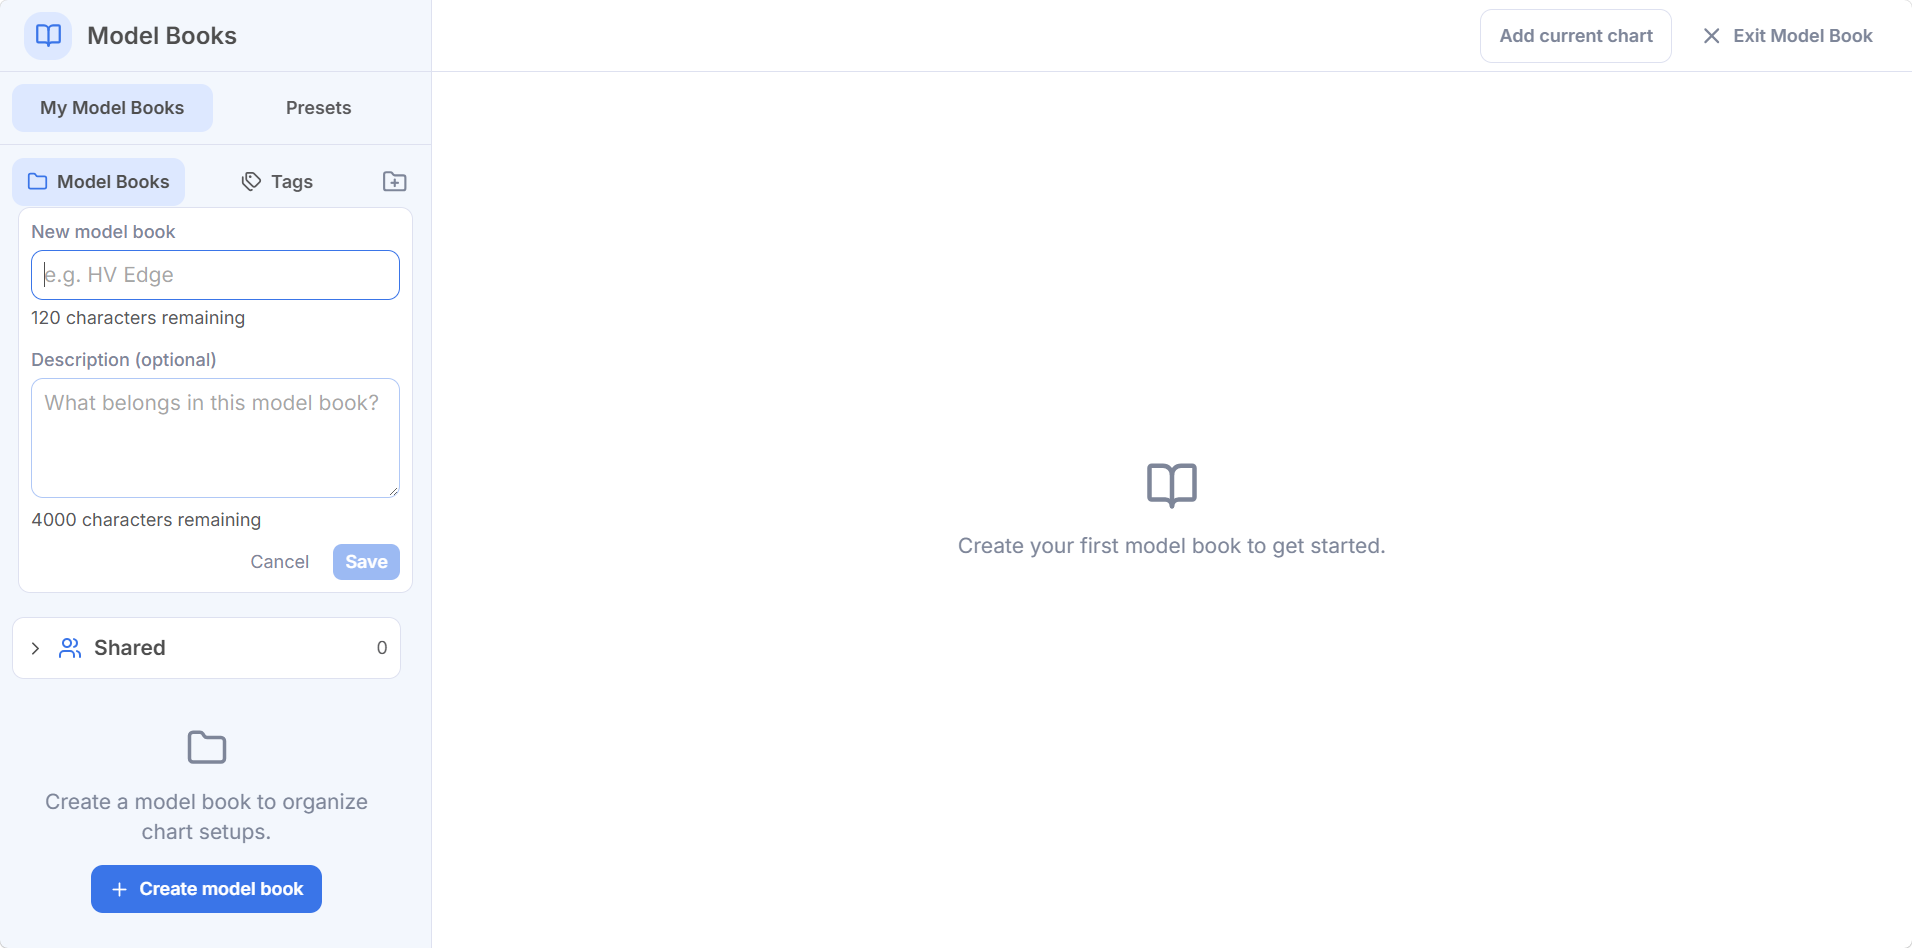
Use the description properly. It is the objective, and the objective is what stops a book turning into a junk drawer: the criteria, the style, even a blueprint name every new example has to measure up to.
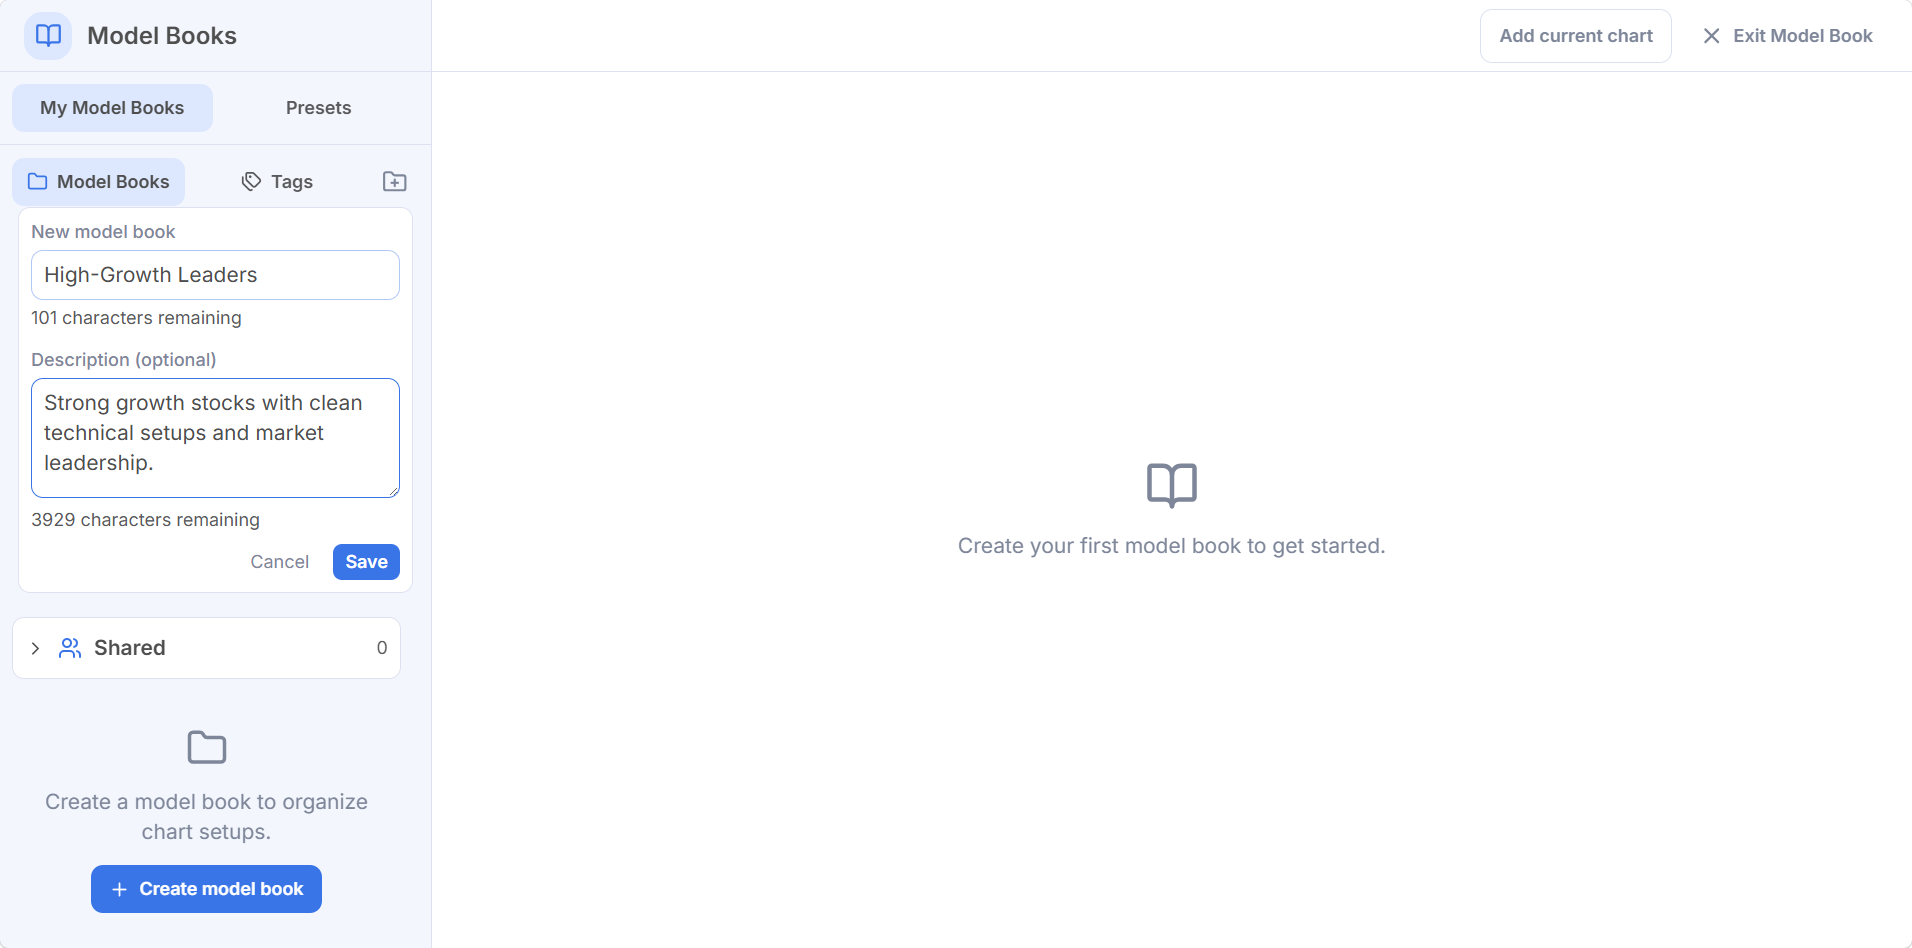
- •By year or market cycle. The best opportunities from one period, which is how you learn what leadership looked like in that kind of tape.
- •By setup or characteristic. Every good example of a VCP, an earnings gap, an inside day or an oops reversal, spanning decades if you like.
- •By anything useful to you. Nothing says a model book has to be technical; build one around fundamental criteria if that is how you choose stocks.
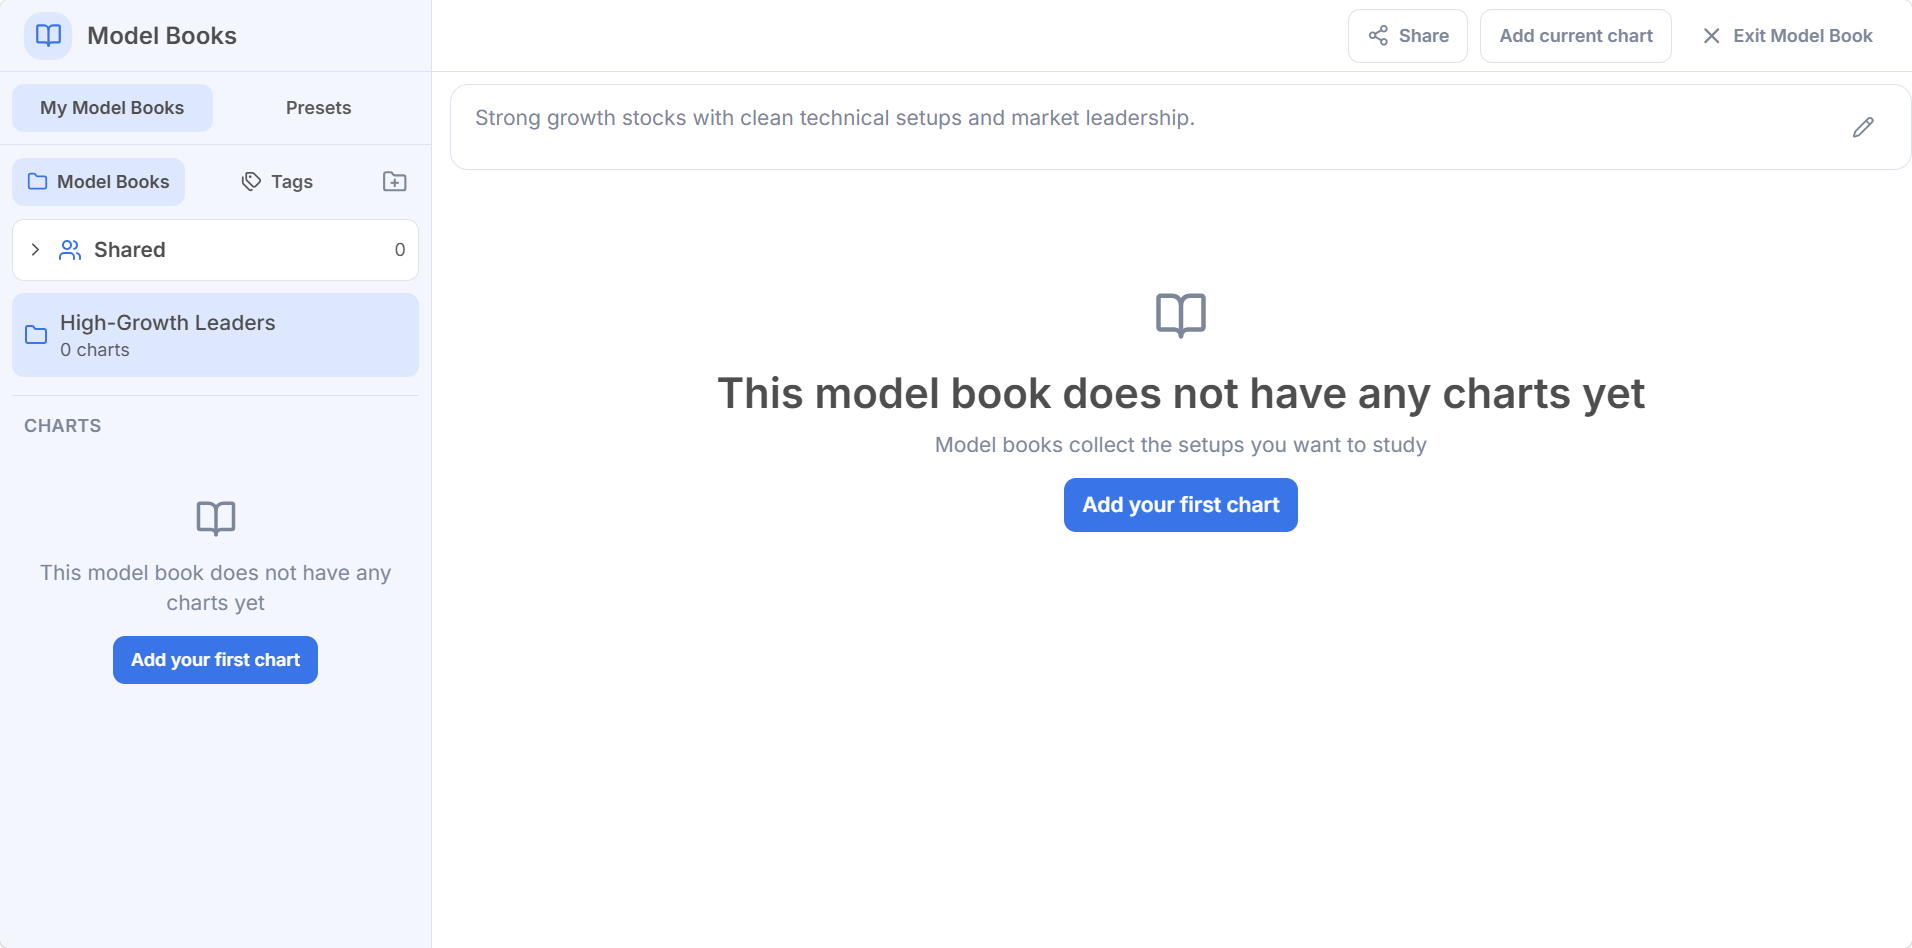
A new book opens empty and says so, with an Add your first chart button and a line that sums up the feature: model books collect the setups you want to study. The description stays across the top with a pencil to edit it, and Share appears next to Add current chart.
Adding a Chart Takes About Five Seconds
This is the part that used to cost an evening. Now it is a right click.
Set the chart up the way you want it saved: timeframe, indicators, drawings, your workspace template. What you see is what gets stored.
Trim the future off it, if it is a historical setup: right click, actions, replay, choose start point, and the chart shows only what a trader would have seen at the time.
Right click and choose Add to model book, then pick the book. Whichever book you used last is waiting at the top.
Or use Add current chart from inside the module, if you are already there.
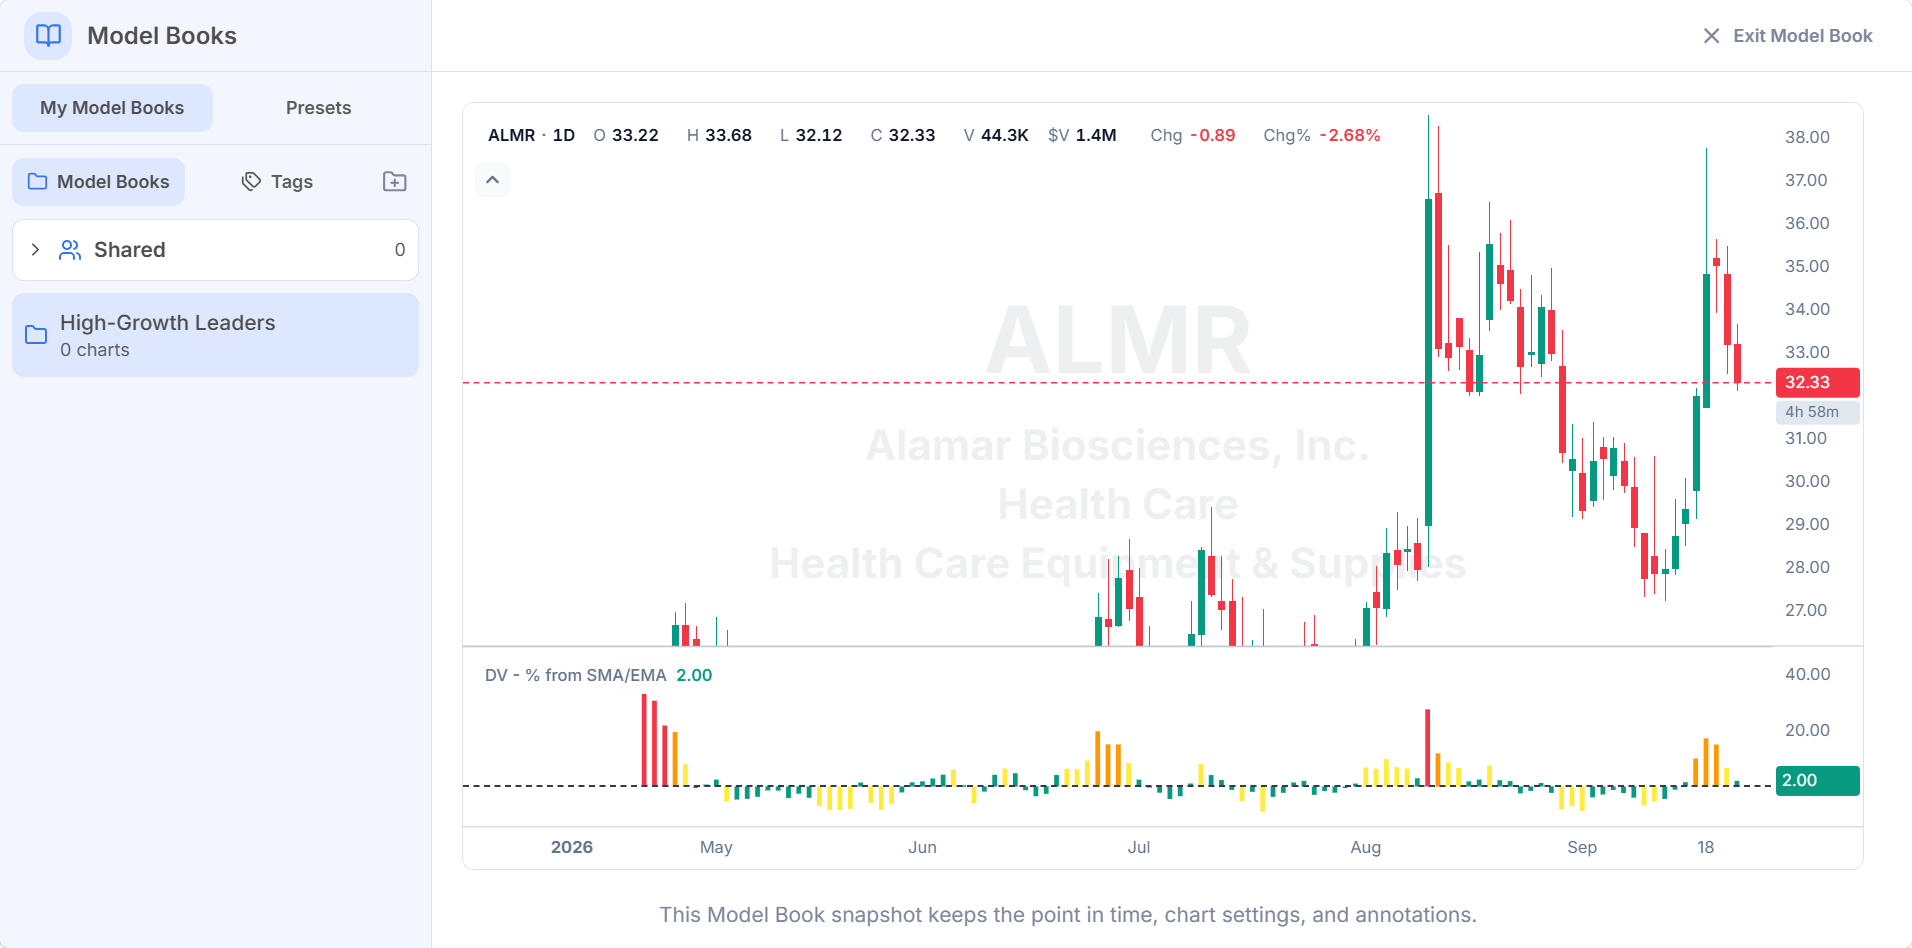
Saving spells out exactly what is kept: the point in time, the chart settings and the annotations. You pick the destination book, give the chart a title, write a note and attach tags before it lands.
Replay mode deserves its own sentence, because it is what makes historical stock charts worth studying at all. A breakout with four years of price action stretching off to the right teaches you nothing, because you already know how it ended. Replay cuts the chart at the bar you choose, so the example shows the decision as it actually looked.
A Snapshot Is a Live Chart, Not a Screenshot
This is the difference that matters most. What gets saved is not a picture; it is the chart, held at a moment, with all of Deepvue’s drawing tools still available on it. Every chart in a book carries a row of controls.
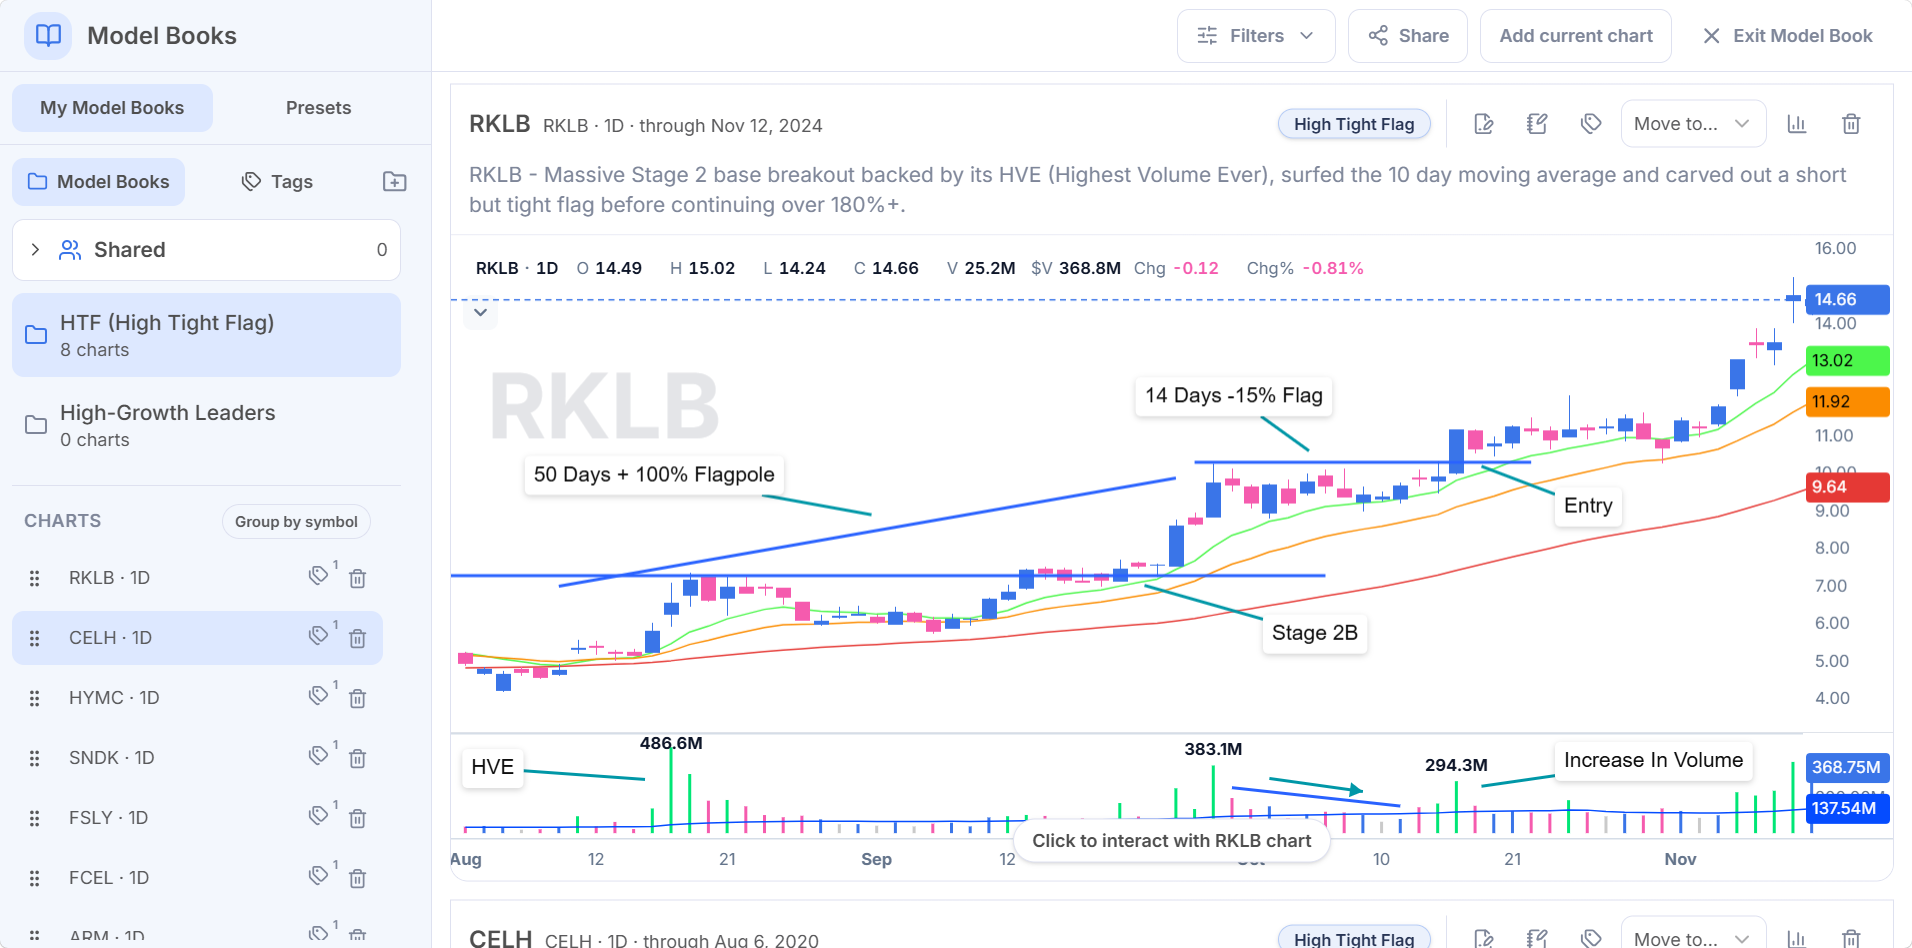
| Control | What it does |
|---|---|
| Edit snapshot | Reopens the chart with the full drawing toolset |
| Edit note | Changes the written context above the chart |
| Tags | Adds or removes tags on that chart |
| Move to… | Moves the chart into another of your books |
| Performance stat | Measures the move from an entry candle to an exit candle |
| Delete | Removes the chart from the book |
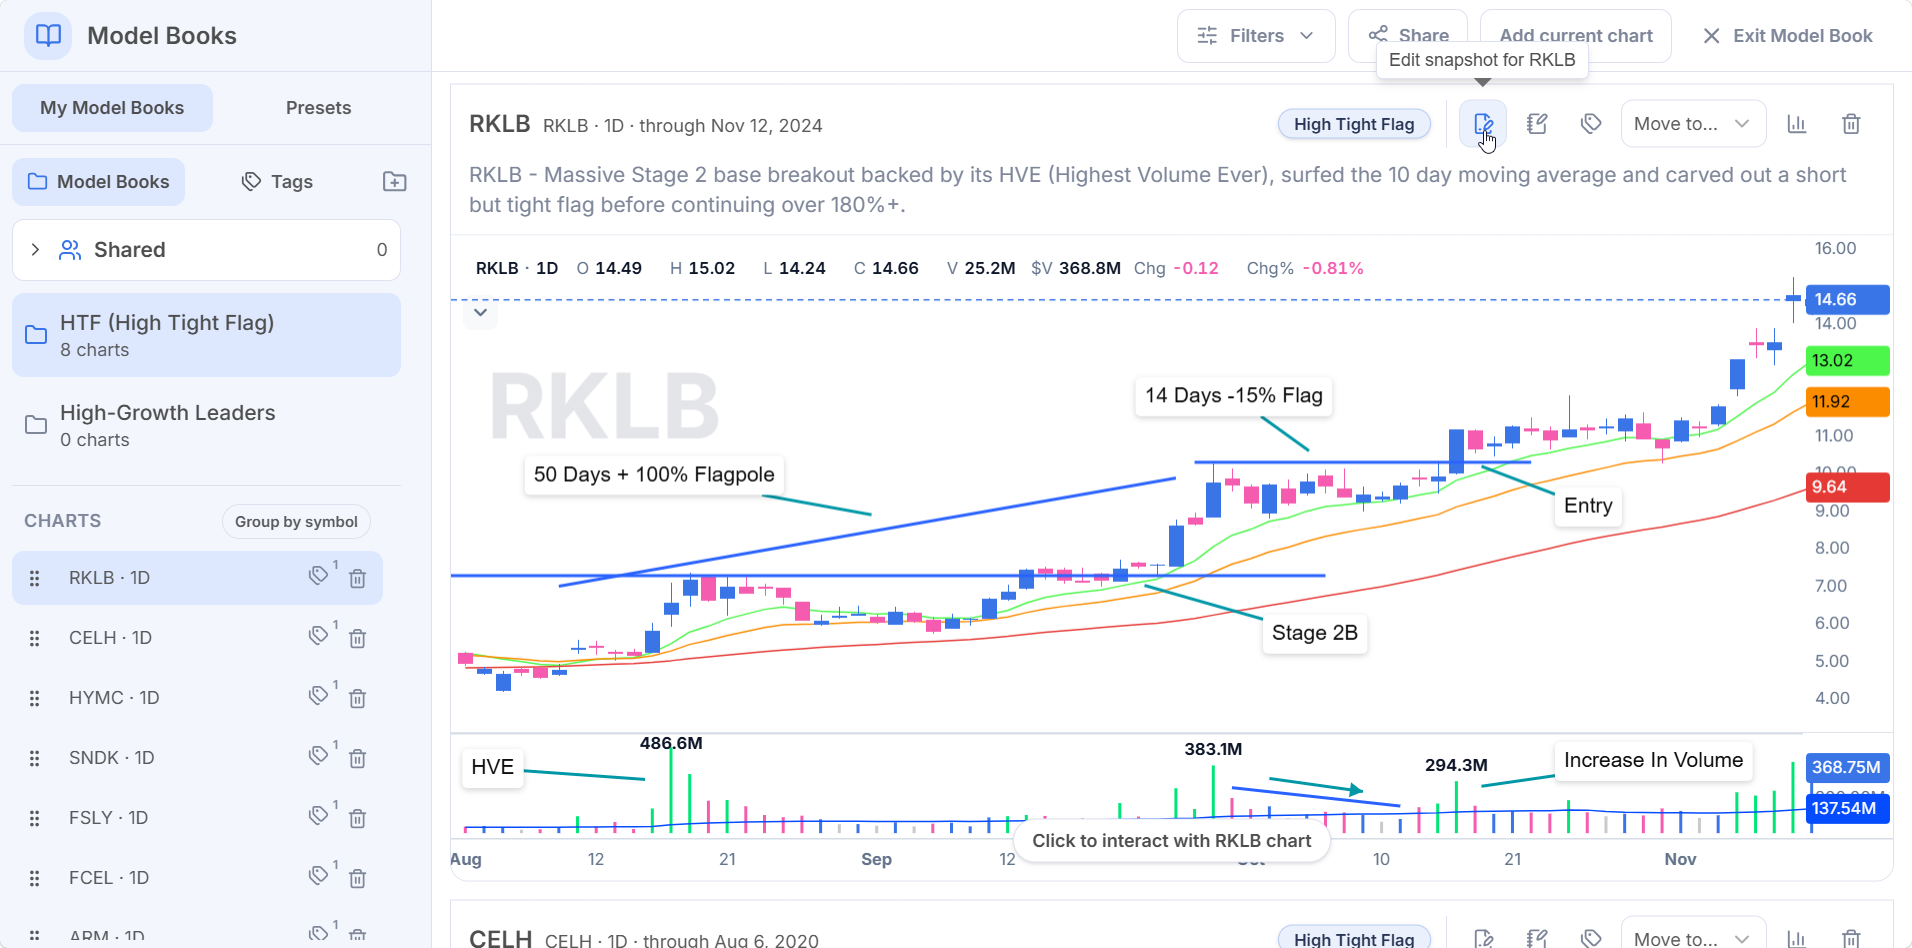
Click Edit snapshot and the full chart annotation toolset opens. Zoom in, add a resistance line, put a callout on the breakout bar, anchor a VWAP to the IPO day and discover, three years later, that the retest you always credited to the prior swing high was also holding the anchored VWAP. Then click Save snapshot and the new version is what the book shows.
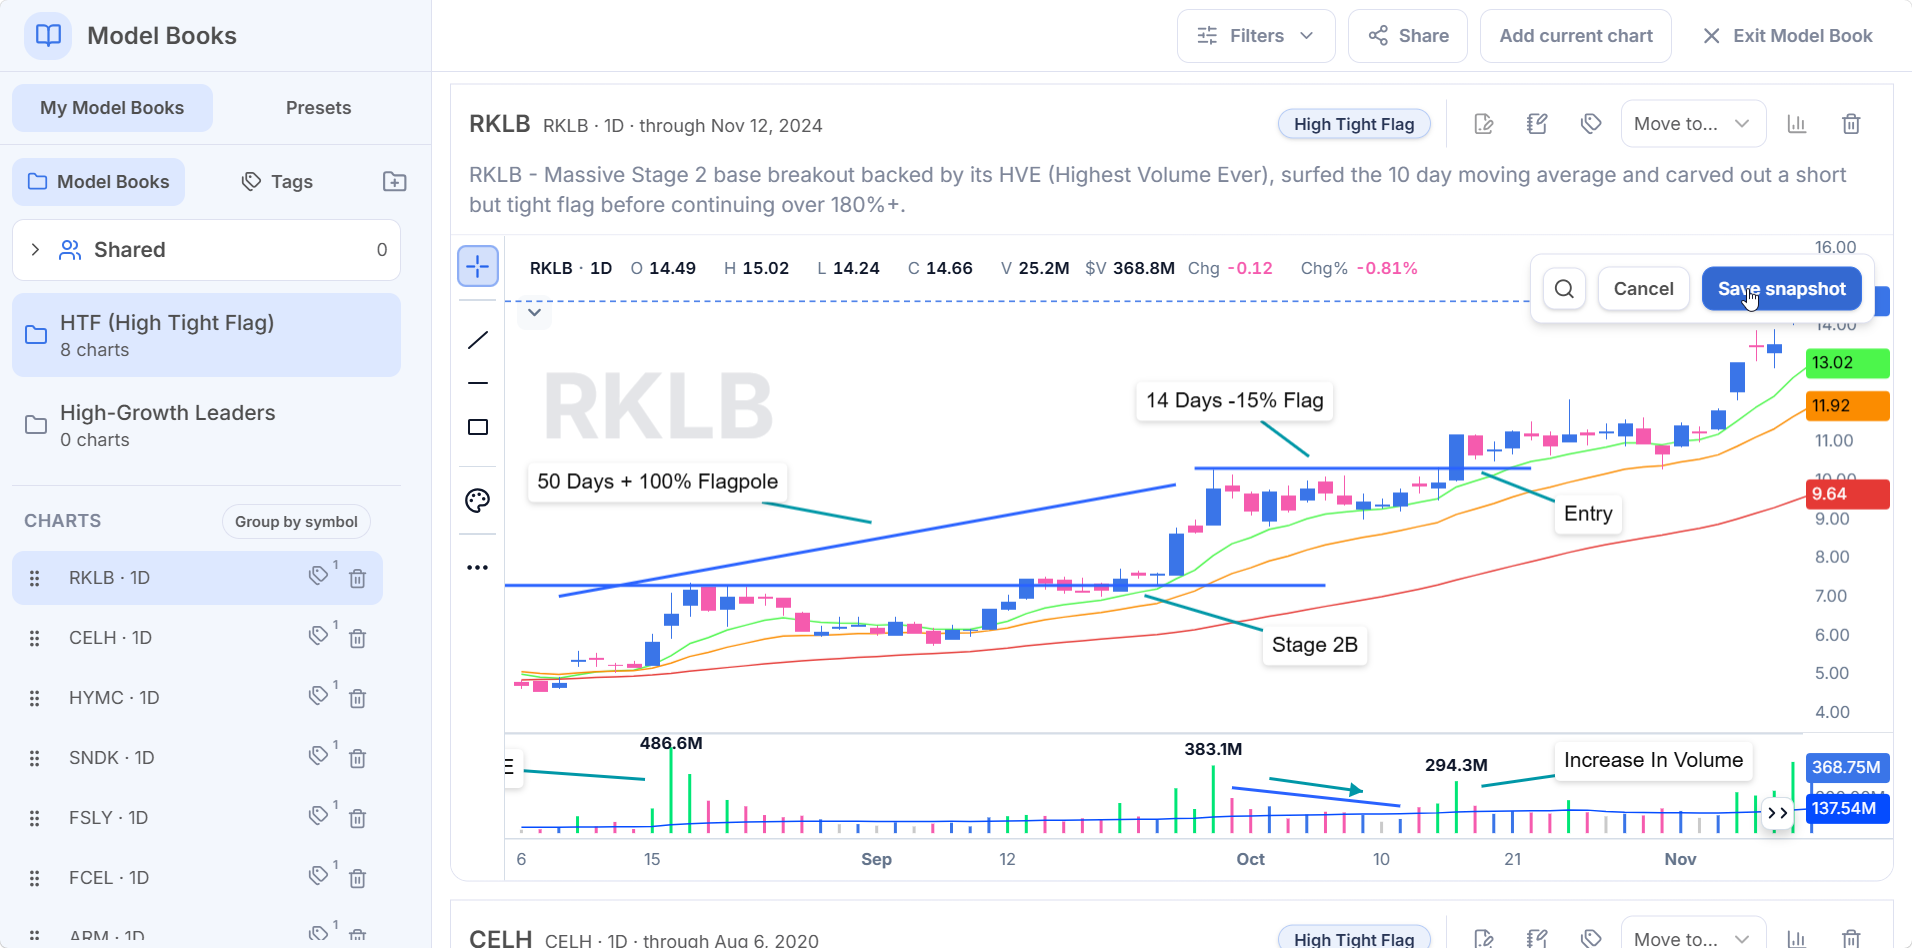
So the book improves as you do. The chart you saved as a beginner gets reread with better eyes and better tools. That is chart annotation as an ongoing habit rather than a one time act, and it is why historical stock charts stay useful here instead of going stale.
Notes, Tags and Performance Stats
Notes: the Context You Will Not Remember in Five Years
Look at a chart you saved last week and you remember the story. Look at one from five years ago and it is a shape. The note field is where the story goes.
A trick worth stealing: right click any bar on a Deepvue chart, ask the AI Terminal what happened around that date, and it returns the catalyst and the narrative, the growth rate at the time, the earnings coming, the backdrop the sector was trading on. Copy that into the note and the chart carries both halves: the price action and the reason for it.
Tags Are the Feature That Scales
Tags look like a small thing when a book has nine charts. At a thousand they are the only reason the library stays usable, because they do two separate jobs.
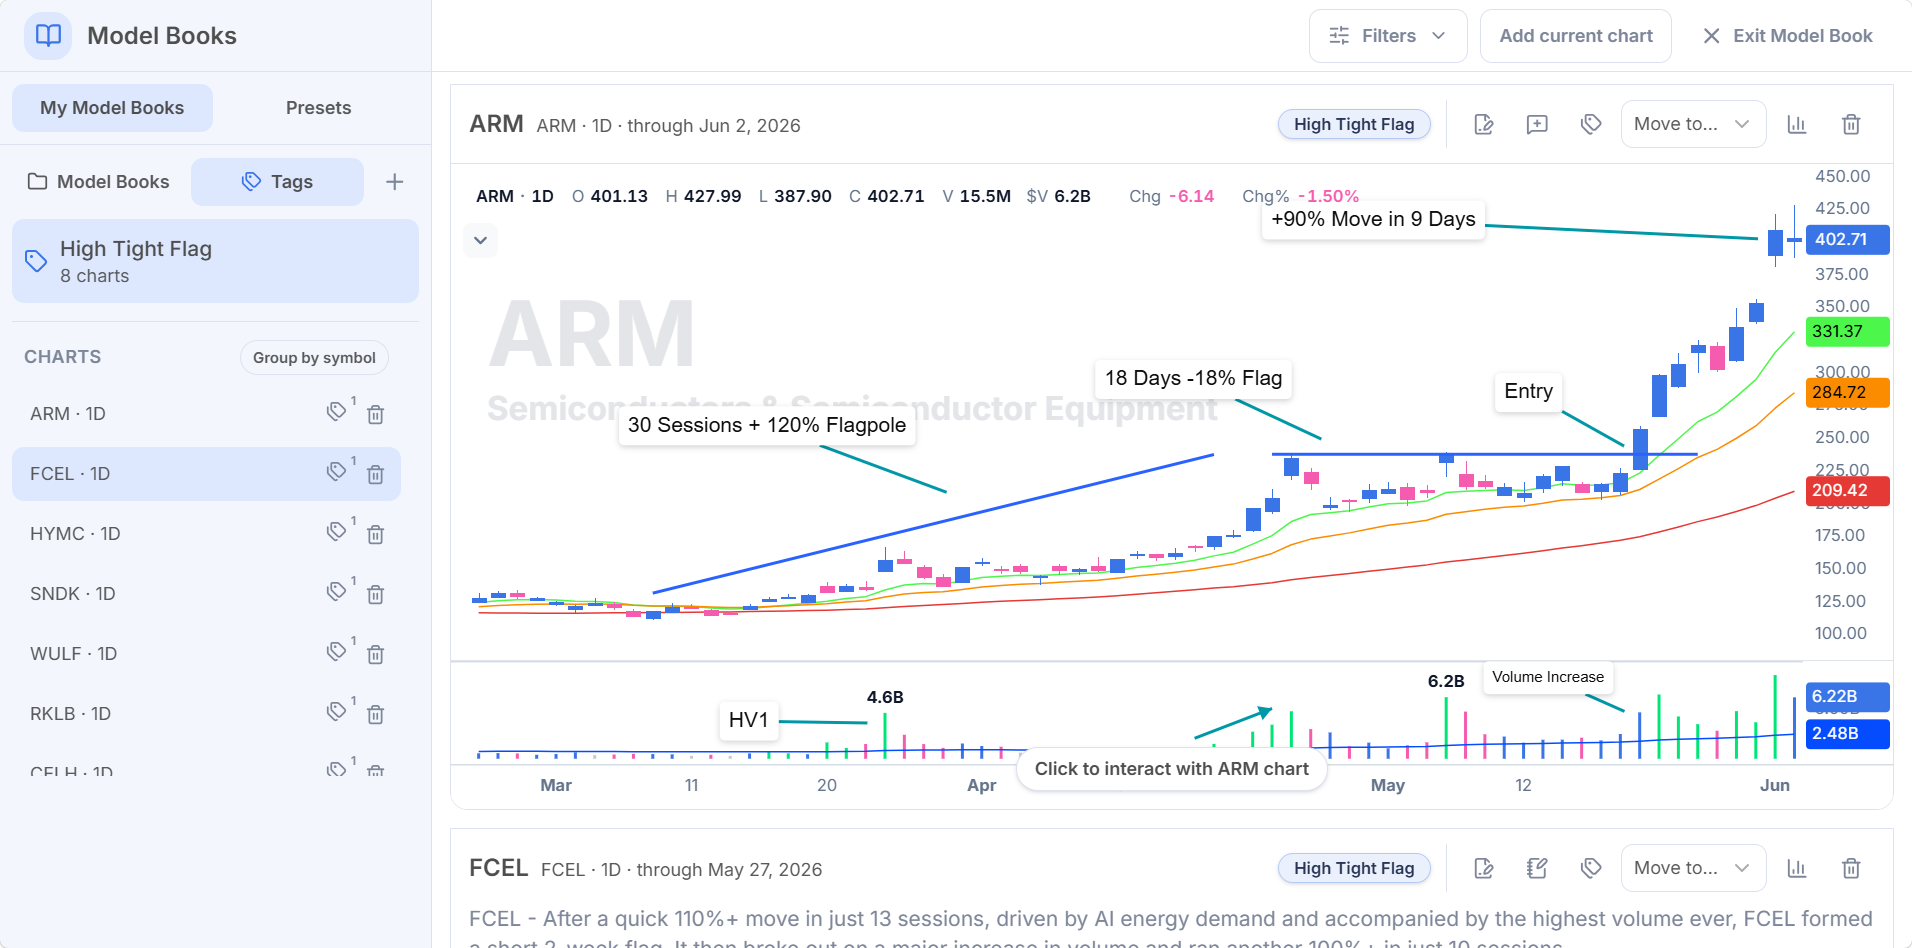
- •They filter inside a book. Grade your examples A+, A, B and C, then show only the A+ names; out of a hundred charts, five are the ones you want tonight.
- •They build collections of their own. On the Tags sub tab every tag becomes a collection pulling matching examples from every book you own, so a chart filed in your year book and tagged base breakout appears in both views without being saved twice.
Create tags from the plus button on the Tags tab and name them the way you talk about setups: base breakout, IPO base, catalyst gap, earnings gap, inside day prime, oops reversal, opening range breakout. The filter bar also cuts by timeframe, and Group by symbol pulls every capture of the same ticker together, so the weekly, the daily and the intraday chart of one move line up side by side.
Measure the Move and Save It to the Chart
Every example should answer one question: how big was this, and how fast? Click the performance stat control, click the candle you would have entered on, click the candle you would have exited on, and the move is measured and saved. You end up with the percentage move and the number of days in the corner of every example, and a pile of pictures turns into something closer to data.
Share a Model Book With Another Trader
Hit Share on any book and a dialog explains the deal: an unlisted link that any signed in Deepvue user with Pro access can add to their own Model Books.
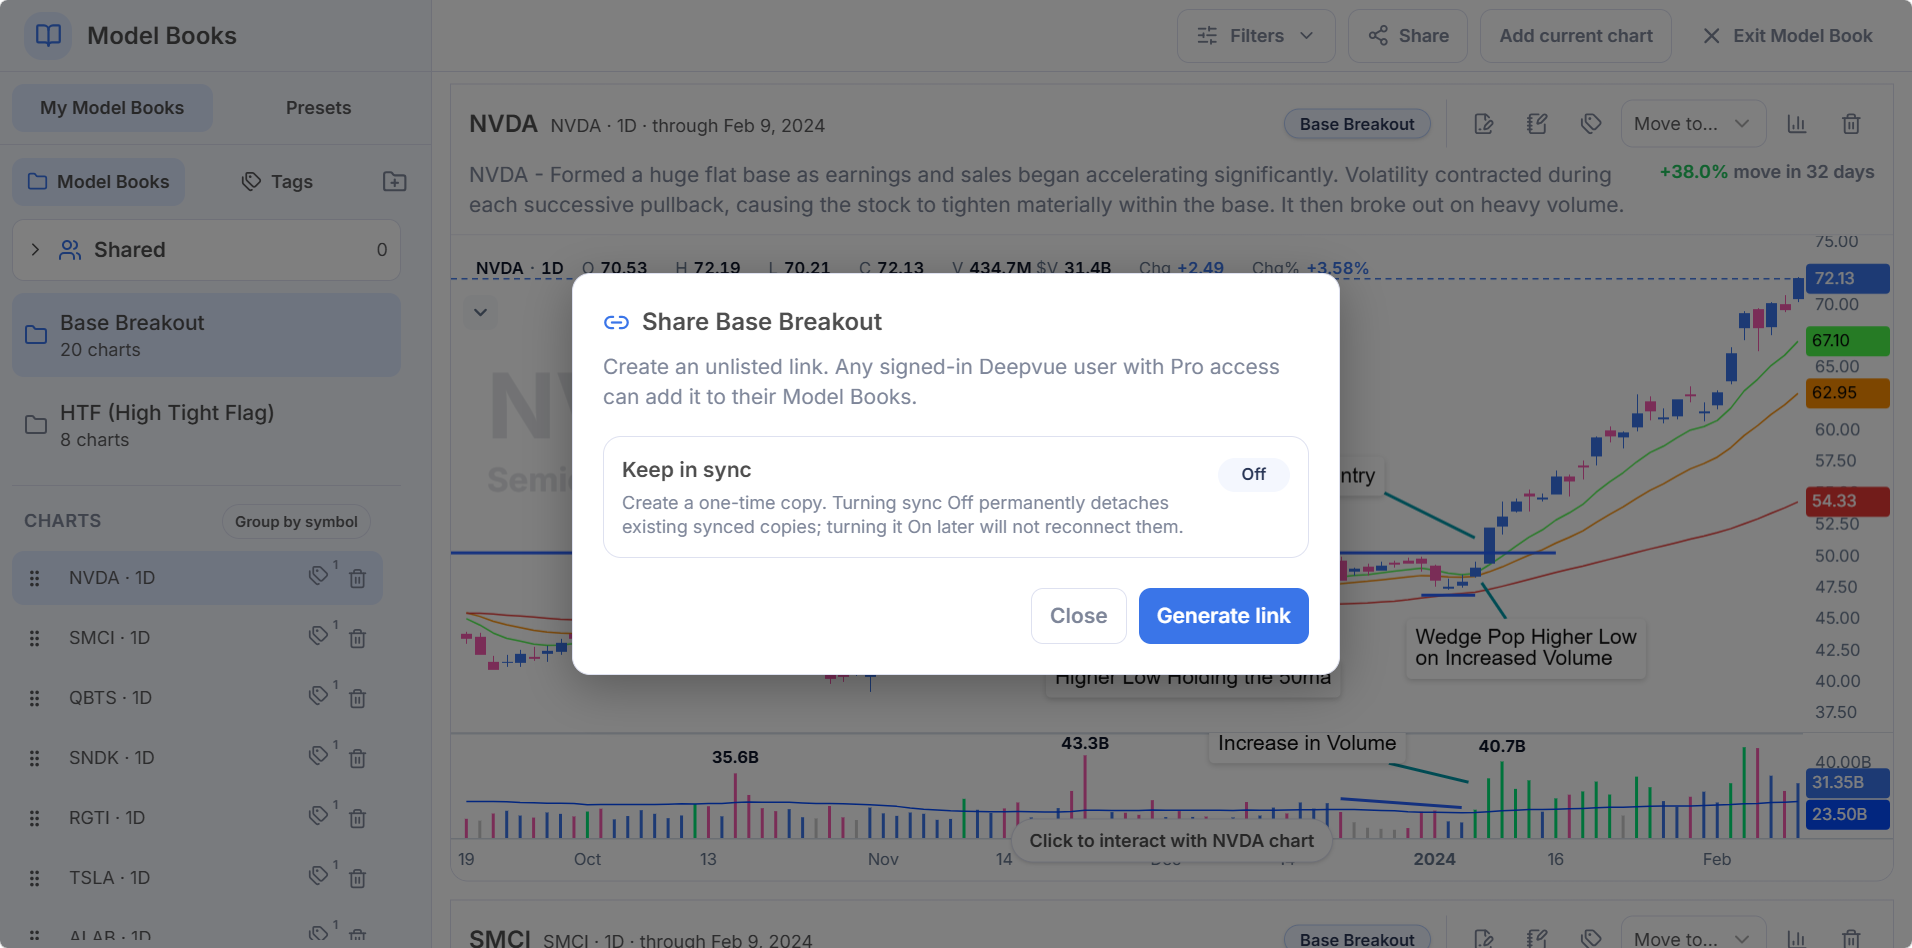
Click Generate link and the dialog returns the share link with a Copy link button, a line confirming whether it creates a one time copy or a synced one, and a Stop sharing option.
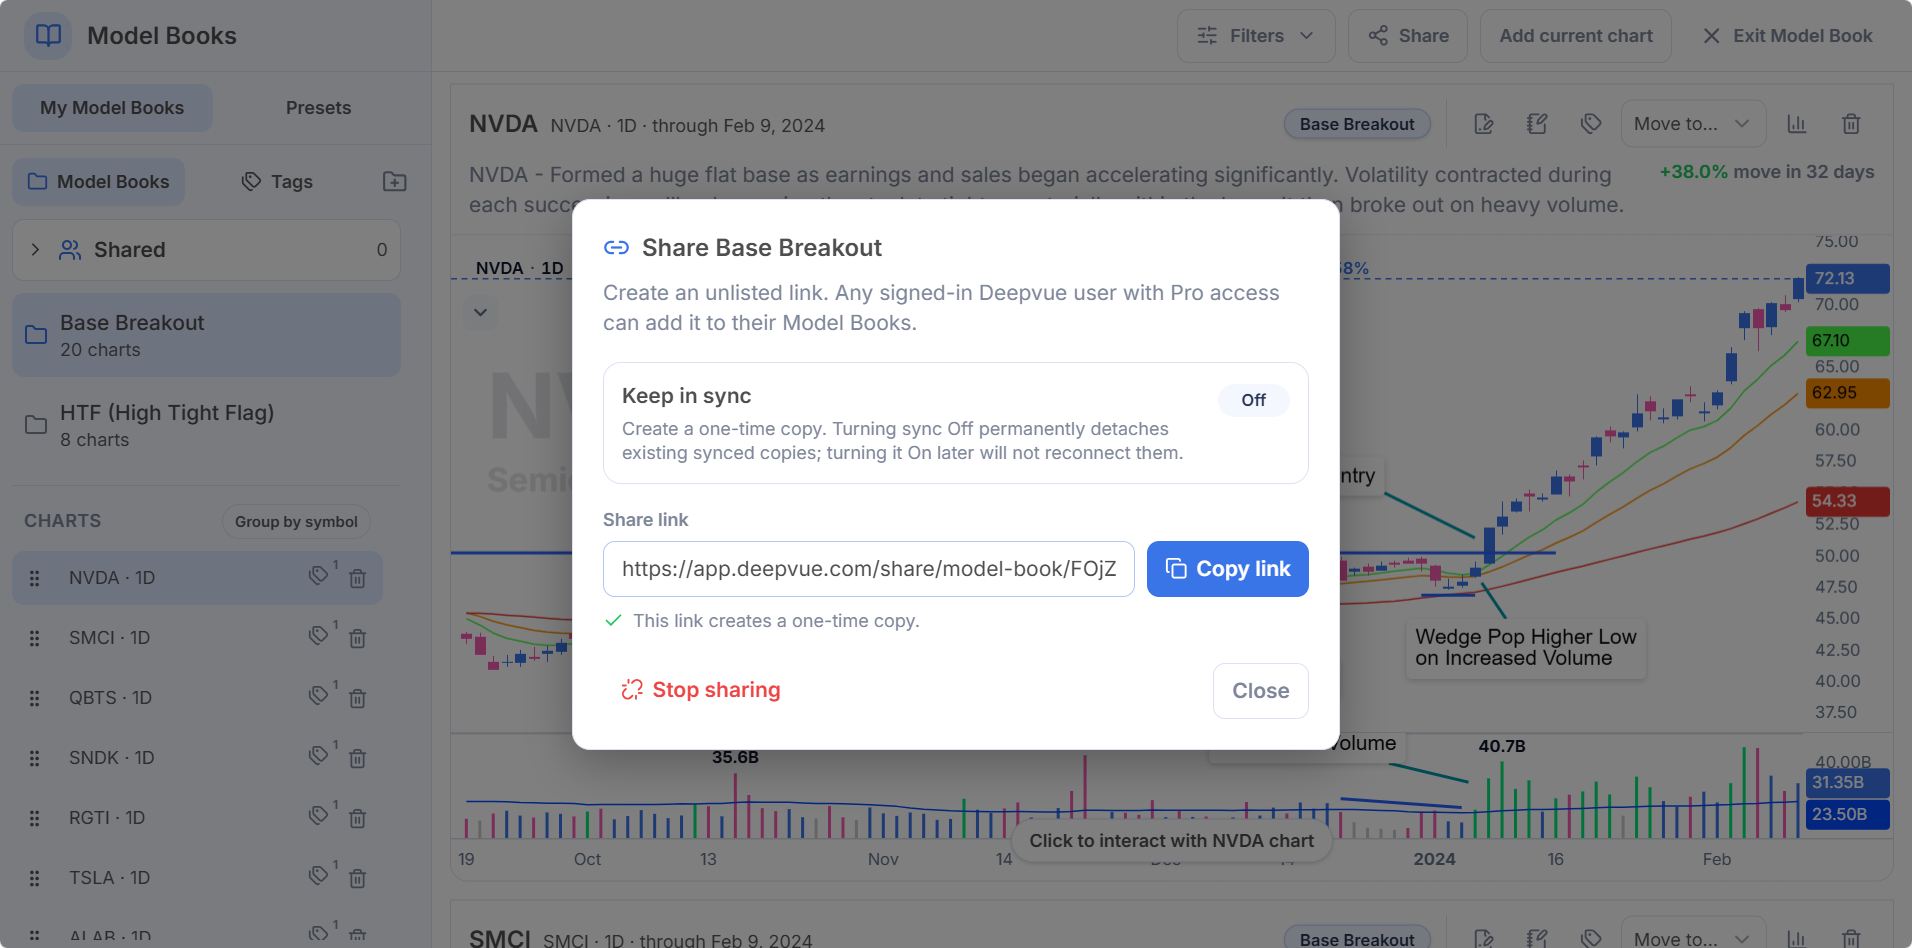
- •Keep in sync off: the link creates a one time copy, frozen as it is today.
- •Keep in sync on: your future edits carry through to everyone holding the link.
- •Stop sharing: the link stops working entirely.
Read the warning before you switch sync off: it permanently detaches copies that were synced, and turning it back on later will not reconnect them. For anyone who teaches, this solves distribution. A setup book goes out as a link and arrives as a working library the other trader can scroll, filter and annotate, rather than a PDF of dead images.
How to Build a Model Book Worth Keeping
The tool removes the friction. It does not do the thinking. Six steps, drawn from the way the Deepvue team builds theirs:
Define the objective. A year, a setup, a characteristic. Write it in the description so future you cannot cheat.
Draft an initial list of every name that might qualify. Be generous here.
Cut it to the best. A book of fifty mediocre charts teaches less than a book of twelve great ones.
Collect the examples. Set each chart up properly, use replay mode, save it into the book.
Annotate and dig in. Mark the nuances, add the note and the catalyst, set the stat.
Review on a schedule. A book you scroll every weekend trains your eye continuously.
A good start is three books: the current year’s leaders, the setup you trade most, and market bottoms. That last one is underrated: pull up an index, step back through previous corrections and save each bottom. Half an hour of that does more for your market timing than most indicators.
WatchDeepvue workshop: building model books like the Market WizardsGet started with Deepvue and let the preset books teach the first lesson while you build your own.
What Makes the Deepvue Model Book Different
- ✓Live snapshots you can redraw years later, instead of frozen screenshots.
- ✓Replay built in, so every historical example shows the decision, not the ending.
- ✓Preset books from the Deepvue team, annotated and written up, ready on day one.
- ✓Tags that cut across books, so one chart serves every collection it belongs in.
- ✓One platform, where the books share a home with the charts, screens and AI Terminal that feed them.
A model book is one reason to choose a platform; for the rest, the Deepvue comparisons hub goes head to head with TrendSpider, Finviz, MarketSurge, TC2000 and TradingView, one competitor at a time.
What Traders Say About Deepvue
Real users, real words, every source linked.
“The interface is very well thought out and highly customizable.”
u/NeosDemocritus, in an r/CANSLIM thread weighing Deepvue against MarketSurge. Open the thread
He called Deepvue’s dashboards “a lot more helpful than the market overview pages” available elsewhere.
From Dave’s review at Day Trade Review, where Deepvue scored 4.7. See the full review
“It’s my favorite charting platform over everything else so far.”
Posted in r/swingtrading by u/lmaobihhhh, on why more traders are not using it. Read the replies
“Deepvue is the most economical and impressive trading platform I have used.”
An App Store reviewer, writing in November 2024. Open the App Store listing
Want the bigger sample? The Deepvue reviews wall holds better than 220 verified entries, an average of 4.8, and a recommendation from 97 percent of the people who left one.
Where the Model Book Connects
The book is where study happens. Here is what feeds it, and what draws from it.
- •Charts supply every snapshot, with replay mode hiding the future and the full drawing set traveling into the book with the chart.
- •The screener and watchlists are where candidates come from; a name that looks familiar usually looks familiar because something in your book resembles it. Pattern based scans are under screener by pattern.
- •Top Movers and Upgrades / Downgrades surface today’s candidates for tomorrow’s book, with the catalyst already written.
- •Stage Analysis and the Theme Tracker answer what the market and the group were doing while your example was setting up.
- •The Deepvue Knowledge Base covers each module in depth.
What the Model Book Costs
The Model Book is part of Deepvue’s single plan at $49 per month, with monthly and annual options, preset books and sharing included.
That one plan covers:
- •The screener and its 1,152 data points.
- •Charts, watchlists, and alerts, all of them unrestricted.
- •Fully customizable dashboards, with every app in the catalog.
- •The Theme Tracker, Market Brief, and AI Terminal, the last with unbounded usage.
Deepvue has one plan, so there are no tiers to compare. For reference, MarketSurge, the legacy platform in this niche, runs $149 per month.
New subscribers also get a one on one onboarding session with a Deepvue team member, an onboarding email series covering platform features and use cases, and weekly live webinars that each go deep on one part of the platform.
The Model Book Is the One Edge Nobody Can Copy
Screens find candidates. Charts show structure. Neither teaches you what a great setup feels like three days before it breaks out; only repetition does, and a trading playbook built from your own examples is repetition you can schedule. Start with the presets tonight, build your first book this week, and in a year you will have a library of the exact setups you trade, read through your own eyes, with the reasons written down.
Done losing charts in a folder? Join Deepvue and build the first book before the market opens tomorrow.
↑ Back to contentsFrequently Asked Questions
The things worth knowing before you start filling one.
What is a model book in trading?
A model book in trading is a curated collection of chart examples that together describe what a particular kind of trade looks like before it works. A Deepvue stock model book is built around a year, a setup or a characteristic, with each example annotated and reviewed regularly to train pattern recognition.
Where does the model book idea come from?
The model book idea comes from William O’Neil, who published The Model Book of Greatest Stock Market Winners in 1971 after studying what top performing stocks had in common before their big moves. That work became the basis of CANSLIM®, and Deepvue brings the practice inside the platform.
How do you build a model book?
You build a model book by defining the objective first, drafting a list of candidates, cutting it to the best examples, then collecting, annotating and noting the catalyst behind each chart. In Deepvue, replay mode, notes, tags and performance stats handle each step, and a regular review finishes the job.
What should go in a model book?
What should go in a model book is whatever teaches you something repeatable. Most traders start with a year’s biggest winners, the setup they trade most and the failures that cost them money. Short side examples and market bottoms are underused, and a Deepvue book can be fundamental too.
How many examples does a model book need?
A model book needs fewer examples than you think to be useful and more than you think to be transformative. Twelve well annotated examples beat fifty mediocre ones, and traders with professional level recognition collect hundreds over a career, which Deepvue tags keep searchable.
Is a model book the same as a trading journal?
No, a model book is not the same as a trading journal. A journal records your own trades; a model book studies setups, often other stocks from years you did not trade. One sharpens execution, the other recognition, and Deepvue has said the model book will eventually be joined by journaling.
How is this different from saving screenshots in a folder?
This differs from saving screenshots because a Deepvue snapshot stores the chart itself at a point in time. You can zoom it, redraw it, add an indicator you did not use back then and resave it, and it carries a note, tags and a measured performance stat inside the platform.
What setups do the preset model books cover?
The preset model books cover setups including Base Breakout, Double Top, EPs (Episodic Pivots), Higher Low, High Volume Edge, HTF (High Tight Flag), HVC (High Volume Close), IPO Base, Parabolic Short and U&R (Undercut & Rally). Every Deepvue example is a real name at a real date, annotated and written up.
Can I copy a preset model book into my own library?
Yes, you can copy a preset model book into your own library. Click Use this preset in the Deepvue Presets tab and the whole book lands in My Model Books, where you can add charts, retag them or redraw them.
Can I edit a chart after saving it to a model book?
Yes, you can edit a chart after saving it to a model book. Click Edit snapshot on any Deepvue chart card and the full drawing toolset opens; add lines, callouts or an anchored VWAP, then click Save snapshot and the book updates.
Can I move a chart to a different model book?
Yes, you can move a chart to a different model book. Every chart card in Deepvue has a Move to menu listing your other books, alongside controls for the snapshot, note, tags, performance stat and delete.
Can I share a model book with other traders?
Yes, you can share a model book with other traders. Deepvue’s Share button generates an unlisted link any signed in user with Pro access can add to their own library, and a keep in sync toggle decides whether they receive later edits or a one time copy.
What is the Shared folder in My Model Books?
The Shared folder in My Model Books is where Deepvue collects model books other traders have shared with you. It shows a count of the books inside, next to your own books in the left panel.
Can one chart belong to more than one model book?
One chart can effectively belong to more than one model book through tags. A chart is filed in one Deepvue book but carries any number of tags, and the Tags sub tab turns each tag into a collection drawn from every book you own.
How do I get out of the Model Book module?
You get out of the Model Book module by clicking Exit Model Book at the top right. The module is separate from the Deepvue dashboard, so it takes over the window while open; reopen it from the left navigation or the Model Book icon in any chart toolbar.
Is the Model Book included in the standard Deepvue plan?
Yes, the Model Book is included in the standard Deepvue plan. Deepvue has a single plan at $49 per month that covers the Model Book along with the screener, charts, watchlists, alerts, dashboards, the Theme Tracker, the Market Brief, and the AI Terminal.
CAN SLIM® is a registered trademark of O’Neil Capital Management, Inc. (U.S. Reg. No. 3,081,940). Deepvue is not affiliated with, sponsored by, endorsed by, or licensed by O’Neil Capital Management, Inc., Investor’s Business Daily, MarketSurge, or their affiliates. Any reference to CAN SLIM® is for descriptive purposes only. Deepvue’s scores, ratings, and screeners are independently calculated by Deepvue and are not the proprietary ratings of MarketSurge or IBD.