Deepvue Upgrades and Downgrades: The Day’s Analyst Moves, Explained Then Listed
The Deepvue Upgrades / Downgrades app collects every analyst rating action for a given day and presents it in three layers: a count line with the totals, a written brief explaining which moves actually mattered, and a table listing each action.
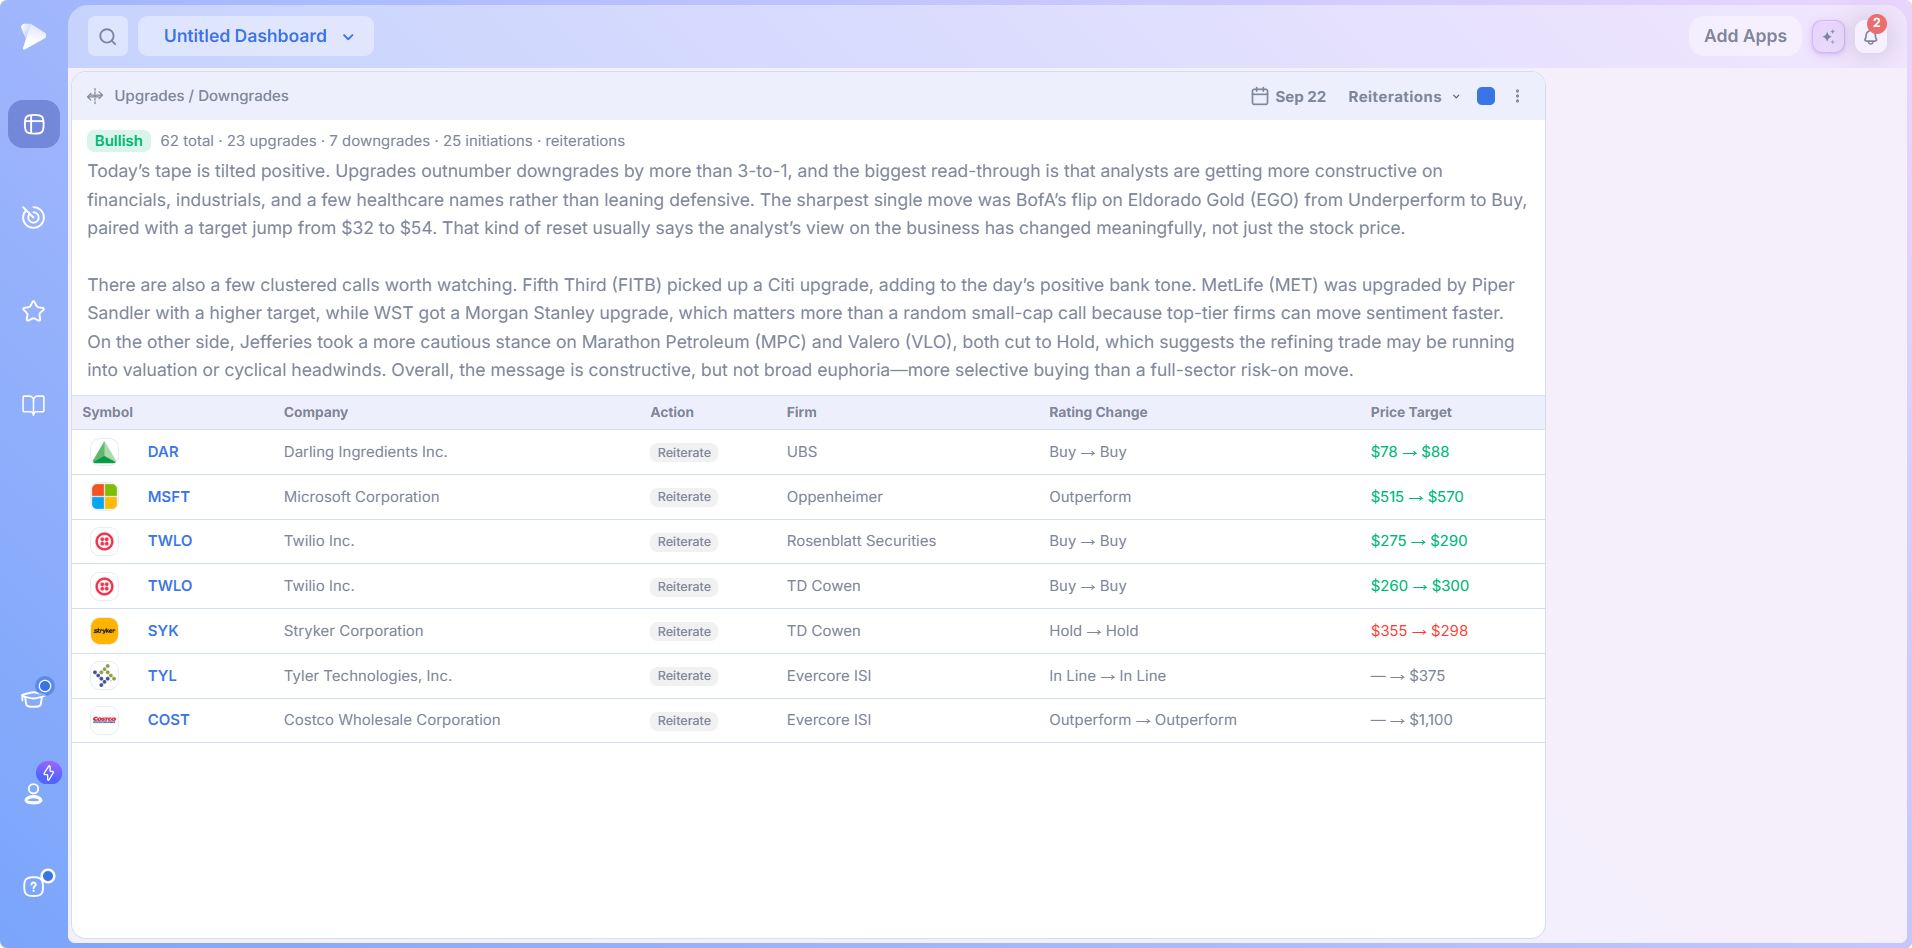
Every row carries the symbol, company, action type, the firm behind it, the rating change, and the price target change. A filter narrows the table to any single action type, and a calendar steps back to earlier sessions.
and this app takes a few seconds to install, with nothing to configure.
What each session hands you before you read a single row:
Key Takeaways
Analyst upgrades and downgrades are easy to dismiss and expensive to ignore. Most days produce a few dozen of them, only a handful will move anything, and picking out those few means reading a long undifferentiated list that arrives in no particular order of importance.
This app does the sorting first. It tells you in plain language what the day’s ratings amounted to before it shows you the raw list, so you get the conclusion in about thirty seconds and the detail whenever you want it.
For anyone holding positions overnight, that is the difference between finding out a holding was cut before the open and finding out from the gap.
- ✓Three layers in one app: a count line with the day’s totals, a written brief explaining what mattered, and a full table of every action.
- ✓Four action types, upgrades, downgrades, initiations, and reiterations, with a filter that narrows the table to any one of them.
- ✓Six columns per row, carrying the symbol, company, action, firm, rating change, and price target change.
- ✓Price target color is independent of the action, so a downgrade can arrive with a raised target and still show green.
- ✓Click the plus beside any symbol for a quick menu that color tags it, adds it to a watchlist, copies it, or sets an alert.
- ✓A calendar steps back to earlier sessions, with weekends and future dates unavailable.Get started with Deepvue here.
Upgrades and Downgrades at a Glance
- Count line
- A one word badge on the session plus totals broken down by action type
- Written brief
- Plain language paragraphs explaining which actions carried weight and why
- Action table
- Symbol, Company, Action, Firm, Rating Change, Price Target, with sortable columns
- Action filter
- All, Upgrades, Downgrades, Initiations, Reiterations
- Date control
- A calendar with month and year dropdowns; weekends and future dates are unavailable
- Quick menu
- Color tags, Add to watchlist, Copy, and Add alert on any symbol
- Where to find it
- Under Research in the Add Apps menu, at the end of that group
- Cost
- No extra charge on the one Deepvue subscription
What Is the Upgrades / Downgrades App?
It is a daily record of stock upgrades and downgrades, along with every other analyst action, wrapped in an explanation of what those actions added up to. Think of it as stock market analyst ratings with the interpretation already done. Rather than handing you a feed and leaving you to work out the significance, it leads with the interpretation and keeps the data one glance below.
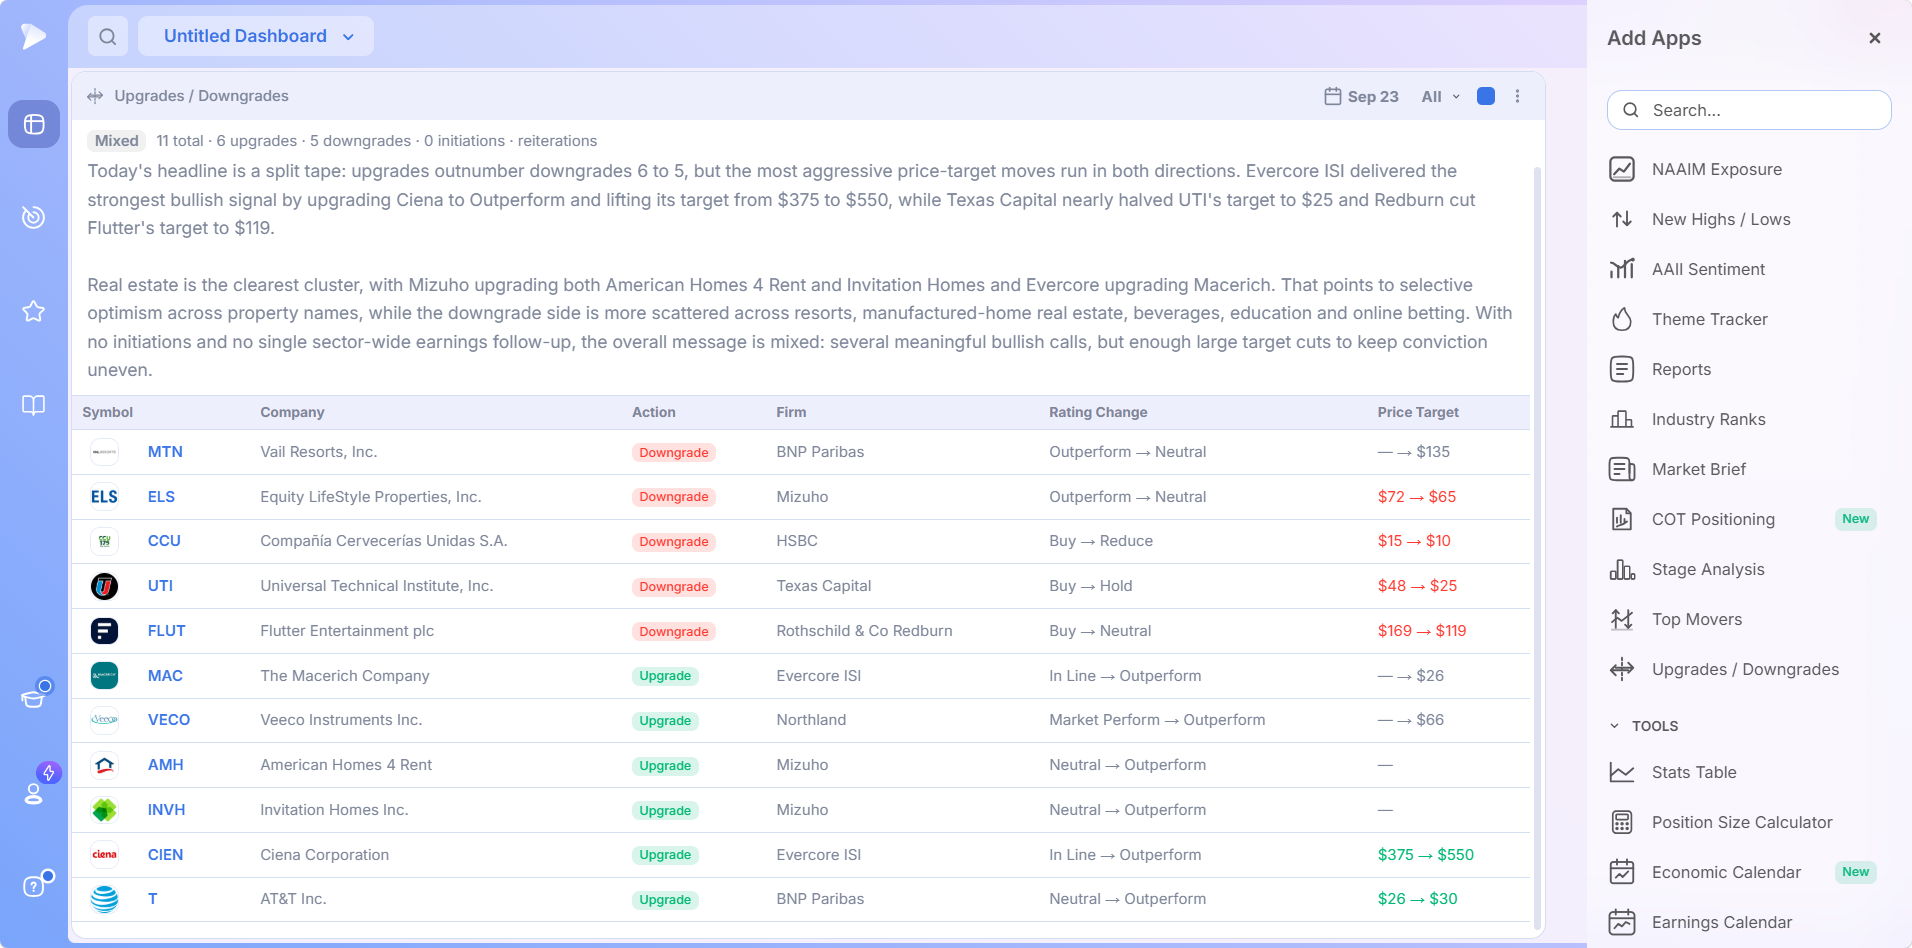
Find it under Research in the app catalog, last in the run of market context apps. Click it to add it to a custom dashboard, where it auto-fits into your layout, then stretch it to whatever size suits.
A note on the captures below: every ticker, firm, rating, and target shown was recorded on the day that image was taken, and several come from different sessions. Read them as demonstrations of how the app behaves, not as current analyst opinion.
Why Rating Actions Are Worth Tracking
Two reasons to keep analyst upgrades and downgrades on screen, and they are different from each other.
- •The immediate one. A meaningful upgrade or downgrade from a firm with weight can move a stock on the day. If you hold the name, you would rather know than be surprised.
- •The cumulative one. A run of downgrades across a group tells you how professional opinion is shifting, which is context you cannot get from price alone.
What makes the difference is knowing which category a given action falls into, and that is exactly what a raw feed cannot tell you.
Who Gets the Most From Upgrades and Downgrades
- ✓Anyone holding positions overnight, which on this platform is most people.
- ✓Swing traders checking ahead of the bell whether anything in the book got cut; see the swing trader page.
- ✓Position traders tracking how professional opinion on a multi month holding is evolving, covered on the position trader page.
- ✓Breakout traders watching for the rating action behind a gap they cannot otherwise explain.
- ✓Anyone studying a group, where a cluster of downgrades across similar names says more than any single call.
Workflows tailored to each style are collected on the Deepvue for hub.
The Three Layers, Top to Bottom
The app stacks the day’s analyst rating changes in order of how quickly you can absorb them. Read the top line and stop, read the brief and stop, or work through the table. Each layer is complete on its own.
Layer One: the Count Line
A single row directly beneath the header. It opens with a badge giving a one word characterization of the session, then reports totals broken down into upgrades, downgrades, initiations, and reiterations. That line alone answers the broadest question. When upgrades comfortably outnumber downgrades, the tone of analyst opinion is constructive; when the balance tips the other way, it is not, and a Mixed badge tells you neither side dominated.
Layer Two: the Written Brief
Plain language paragraphs beneath the count line, and the part of the app that saves the most time. It does not restate the table. It picks out the actions that carry weight and explains why they do.
A typical brief opens with the session’s strongest bullish call and its sharpest target cut, so both sides of the tape are in view at once. It then looks for clusters, such as one firm upgrading several names in the same industry, and separates them from scattered, one off moves.
It closes with a verdict on the day as a whole, and on how much conviction the calls actually carry. That qualification is the value. A feed reports that a rating changed; the brief tells you whether the change was decisive.
Layer Three: the Action Table
Six columns, each doing a specific job. Columns can be sorted, so you can order a session by price target rather than by the sequence actions arrived in.
| Column | What it holds | Why it matters |
|---|---|---|
| Symbol | The ticker, with the company logo beside it | Scannable, and the fastest way to spot a name you hold |
| Company | The full company name | Disambiguates tickers you do not recognize |
| Action | A colored badge: Upgrade, Downgrade, Initiate, or Reiterate | The single most important field, readable at a glance |
| Firm | The institution making the call | Not all opinions carry equal weight |
| Rating Change | The move from one rating to another | The size of the move matters as much as its direction |
| Price Target | Price target changes, colored by direction | Often more informative than the rating itself |
Open a Deepvue account and read today’s brief before the opening bell.
The Four Action Types and How to Filter Them
The dropdown in the header controls what the table shows. It offers five options: All, Upgrades, Downgrades, Initiations, and Reiterations.
One behavior worth knowing before you start switching between them. The count line and the written brief do not change when you filter. They describe the whole day regardless of which action type the table is showing. Only the table narrows, which is sensible: the interpretation of a session does not change because you chose to look at one part of it.
| Action type | What it means | How urgent |
|---|---|---|
| Upgrade | A firm raising its rating on a stock it already covers | Check against your watchlist |
| Downgrade | A firm lowering its rating on a stock it already covers | Check against your holdings first |
| Initiate | A firm beginning coverage on a stock it did not previously follow | Worth noting, rarely urgent |
| Reiterate | A firm restating the rating it already had | Lowest priority of the four |
Upgrades
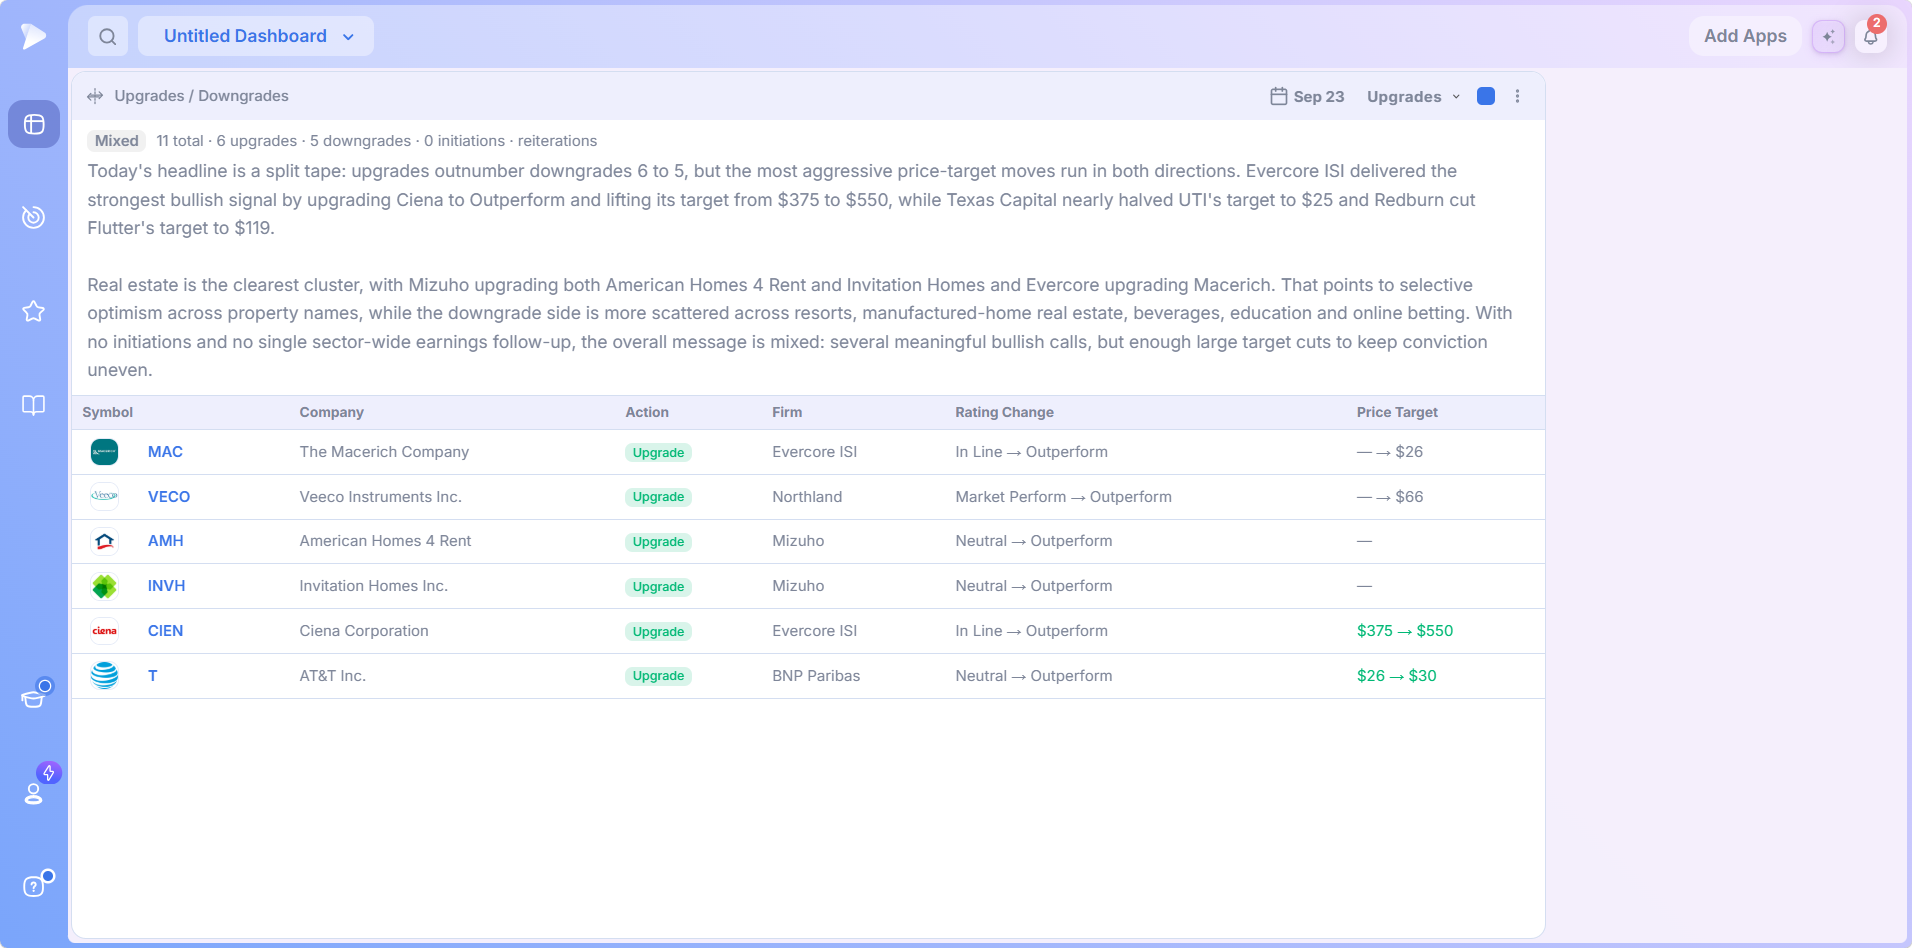
A firm raising its rating on a stock. The most useful ones combine a meaningful jump in rating with a raised target, since either on its own can be a formality. In the table, that pairing shows as a rating transition beside a green price target, and it is the signal worth acting on.
Downgrades
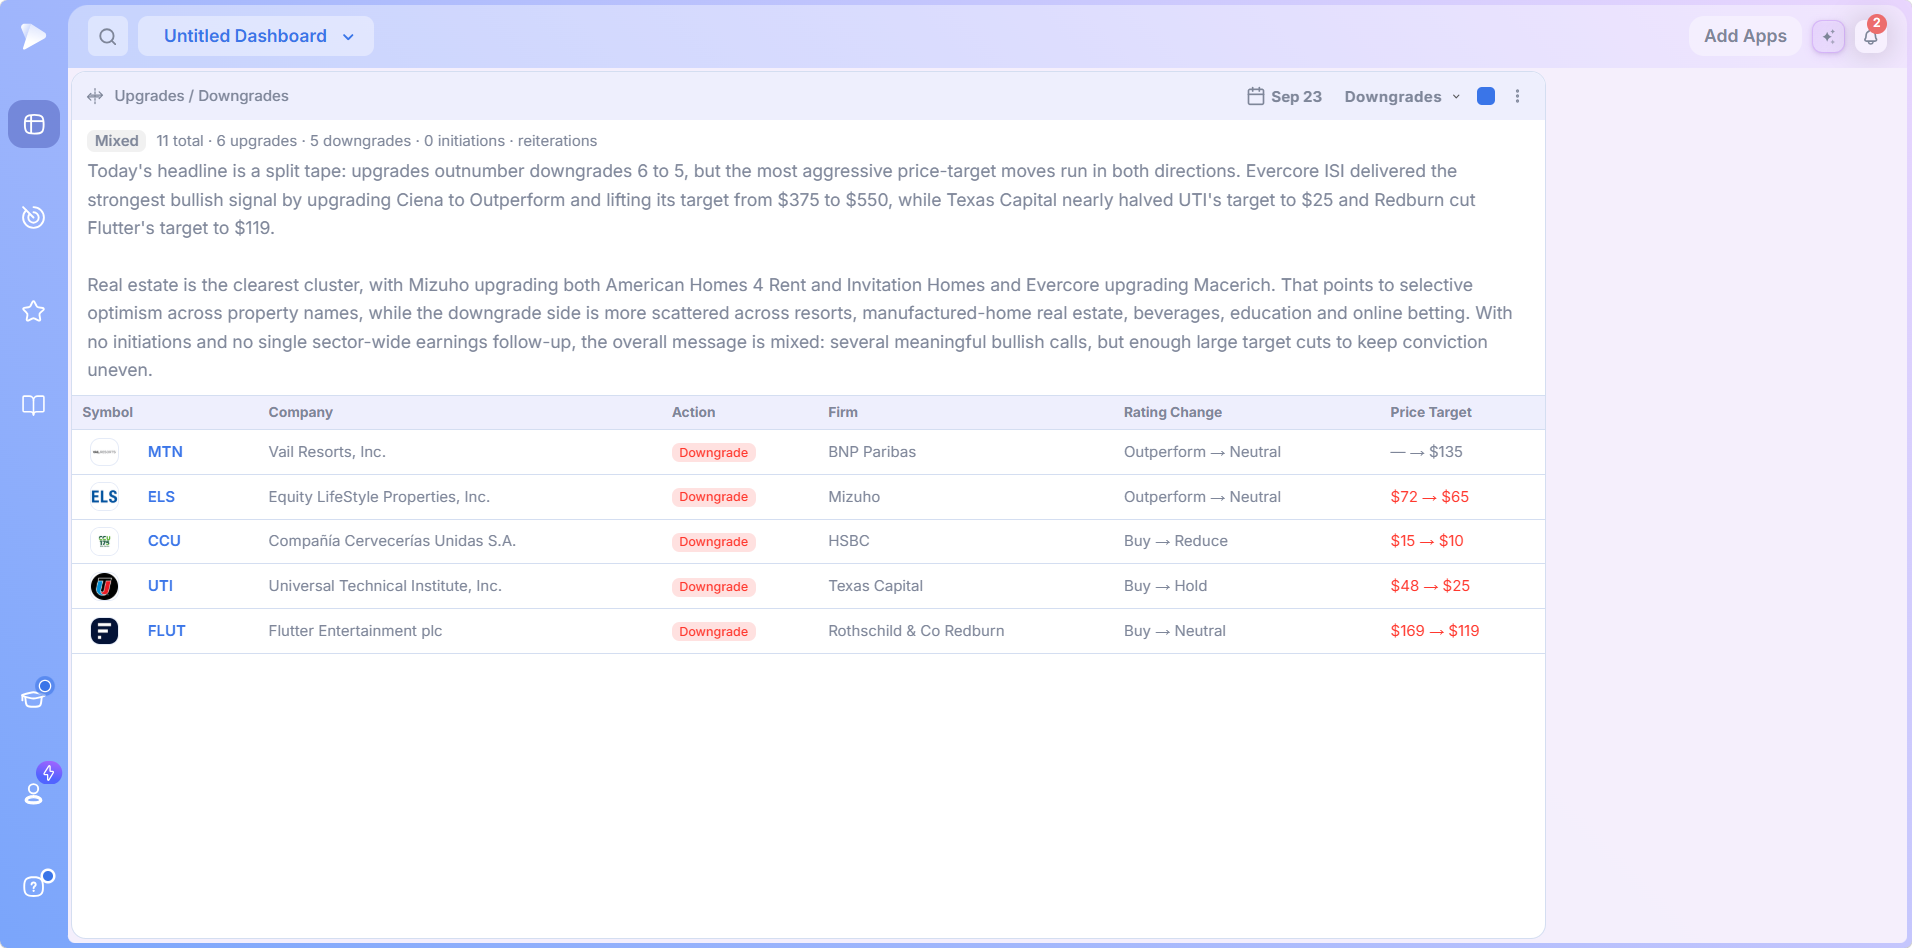
The reverse, and the filter worth checking first if you hold positions overnight. Reading a downgrade properly means reading the rating change rather than the badge. A move from Outperform to Neutral is a firm stepping aside. A move from Overweight to Underweight skips the neutral position entirely and is a considerably stronger statement.
Initiations
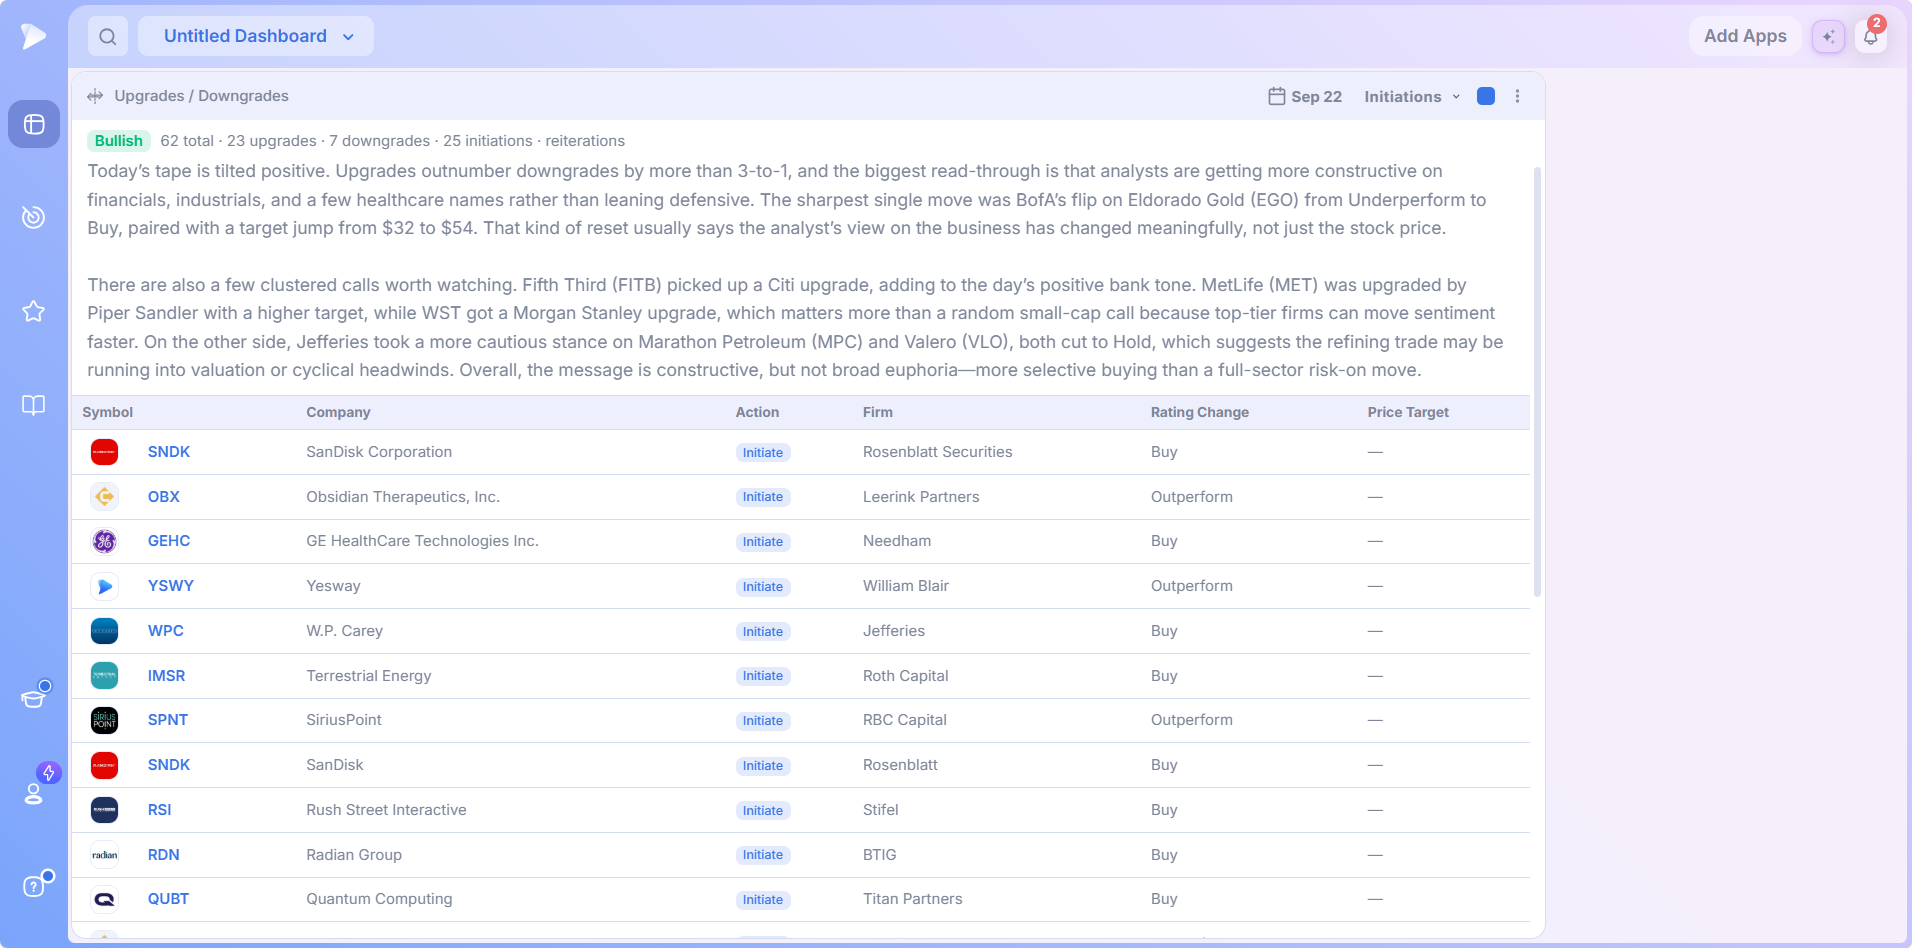
Analyst initiations are firms beginning coverage on a stock they did not previously follow. They are easy to overlook and often should not be, because a new institution picking up coverage can widen the audience for a name.
Notice how the Rating Change column behaves differently here. There is no previous rating to move from, so entries read as coverage being initiated, or simply give the rating being assigned. An initiation at Neutral with a defined target is a more informative entry than one with no target at all.
Reiterations
A firm restating its existing position. The quietest category, and usually the least urgent, but not empty of information. The value here is confirmation rather than news: a firm maintaining its rating through a sharp move in the stock is telling you something, particularly when the stock has moved far enough that a change might have been expected.
Reading the Rating Change Column
Most entries show a transition, one rating replaced by another, which is the format that carries the most information. Some show a single rating, and some carry a placeholder where the underlying record is incomplete.
The complication worth understanding is that firms do not share a rating vocabulary:
- •Wolfe Research works in Peer Perform and Outperform.
- •Morgan Stanley works in Equal Weight and Overweight.
- •UBS works in Neutral and Buy.
- •Raymond James carries a Strong Buy above its Outperform, so a move into Strong Buy is a step up within positive territory rather than an entry into it.
Reading the transition rather than translating it into a house scale is the practical approach. Outperform to Strong Buy and Neutral to Buy are both upgrades, but they say quite different things, and the column shows you exactly which.
Reading the Price Target Column
Price target changes are frequently more revealing than the rating itself, and this column has one behavior that is easy to misread until you have seen it. Entries take four shapes:
A full change. An old target replaced by a new one.
A new target with no prior. A dash followed by a figure, which is what you see when a target is set where none was recorded before.
An unchanged target. The same figure on both sides, meaning the rating moved but the valuation did not.
No target at all. A single dash, indicating a rating action without an accompanying number.
The Color Tracks the Target, Not the Action
This is the detail to internalize. The color applied to a price target reflects whether that target went up or down, entirely independently of whether the action was an upgrade or a downgrade.
Reiterations show it most plainly. The rating stays exactly where it was, yet the target still renders green when it rises and red when it falls. The same rule means a firm can downgrade a stock, raise its valuation in the same note, and the target shows green beside a Downgrade badge. A target set with no prior figure, or one left unchanged, renders in neutral coloring.
Once you know the color belongs to the target rather than the action, these rows stop looking like errors and become the most interesting entries in the table. A downgrade with a raised target is a very different message from one with a cut target.
Acting on a Row Without Leaving the App
Clicking the plus button beside a symbol opens a quick menu, which is what turns the app from something you read into something you act on.
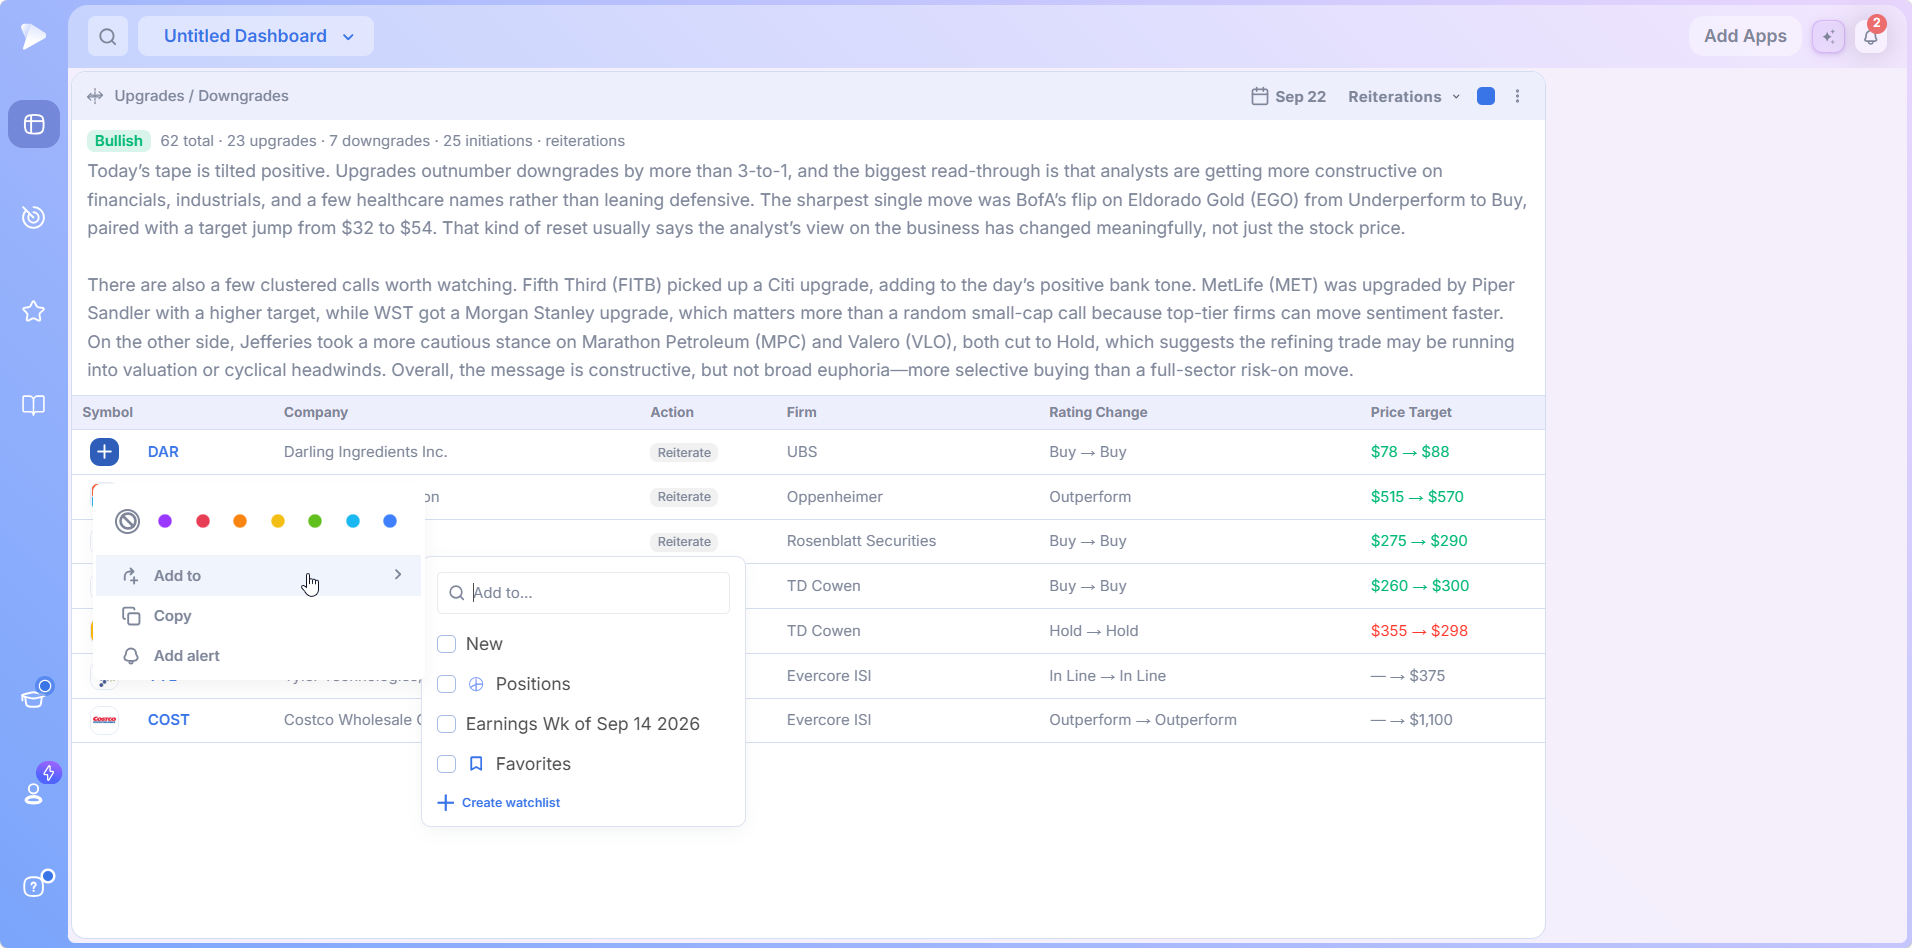
- •Color tags across the top, including a clear option, for marking a name in your own coding.
- •Add to, opening a searchable list of your watchlists with a Create watchlist link beneath.
- •Copy, which puts the symbol on the clipboard.
- •Add alert, so a name that just got upgraded can be watched at a level without opening another app.
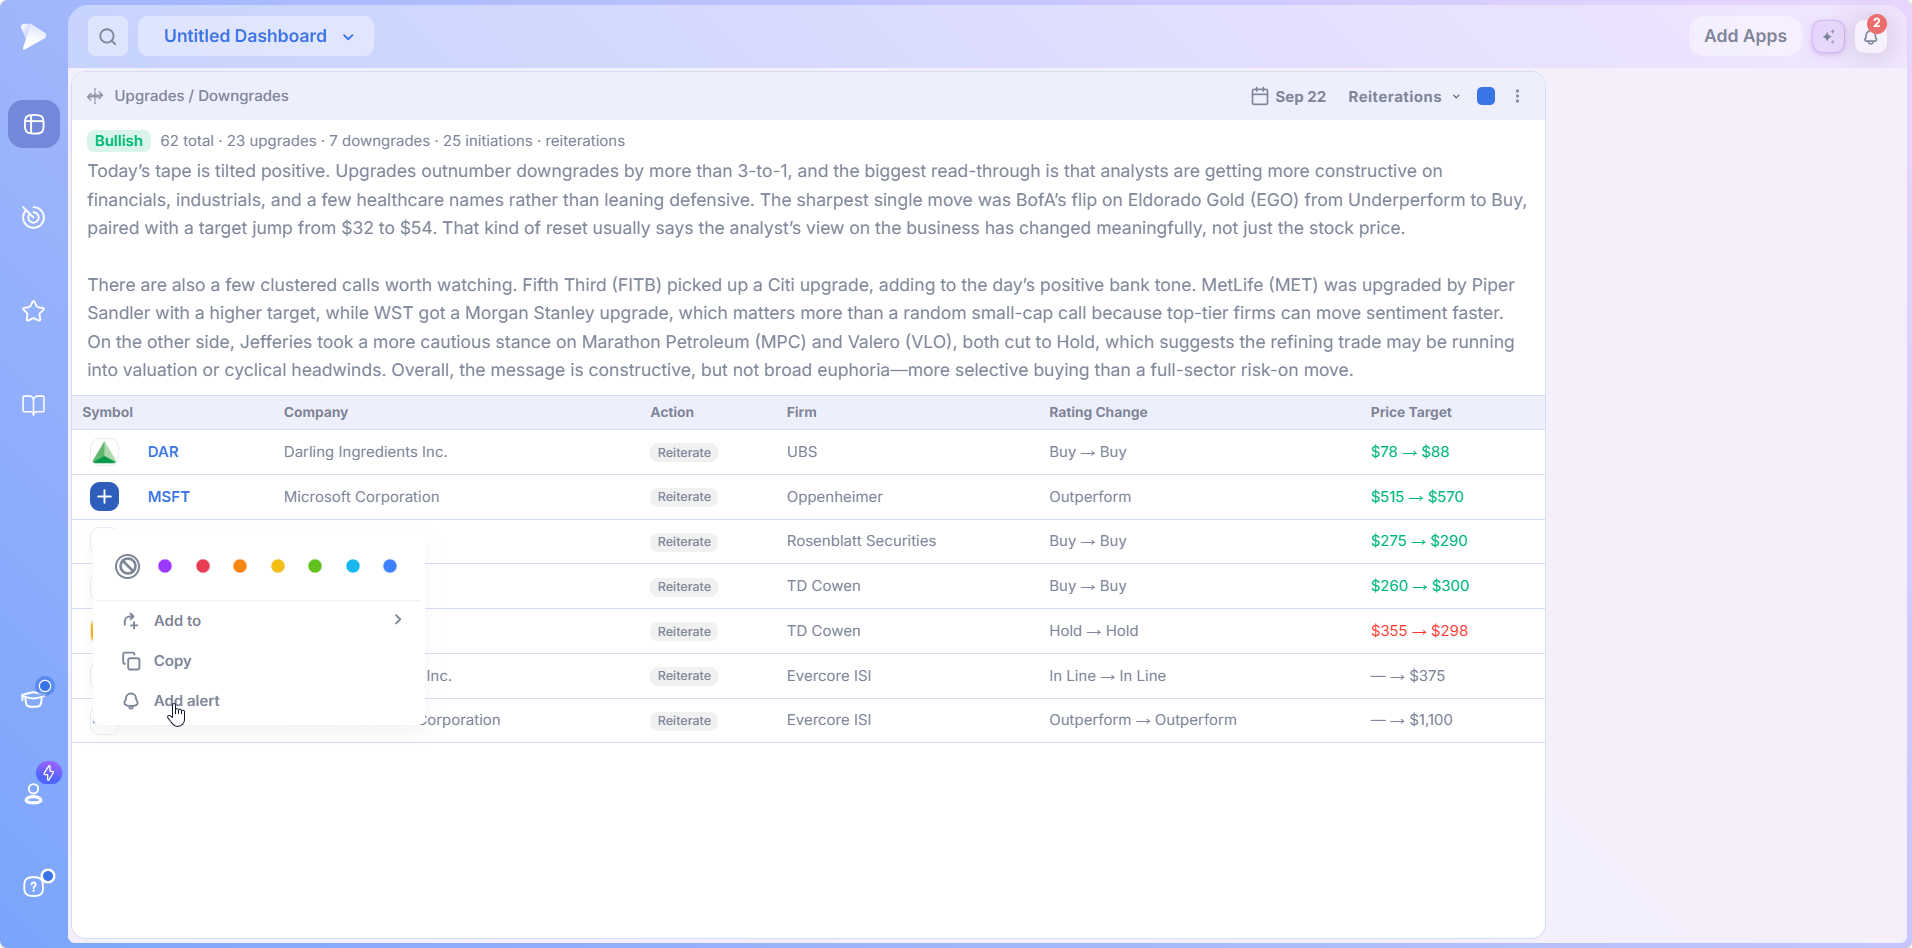
So a downgrade on a holding, or an upgrade on a name you have been stalking, goes straight into awatchlist or onto an alert in two clicks rather than being noted and forgotten.
Looking Back at an Earlier Session
The calendar control in the header shows the date currently loaded and opens a date picker when clicked.
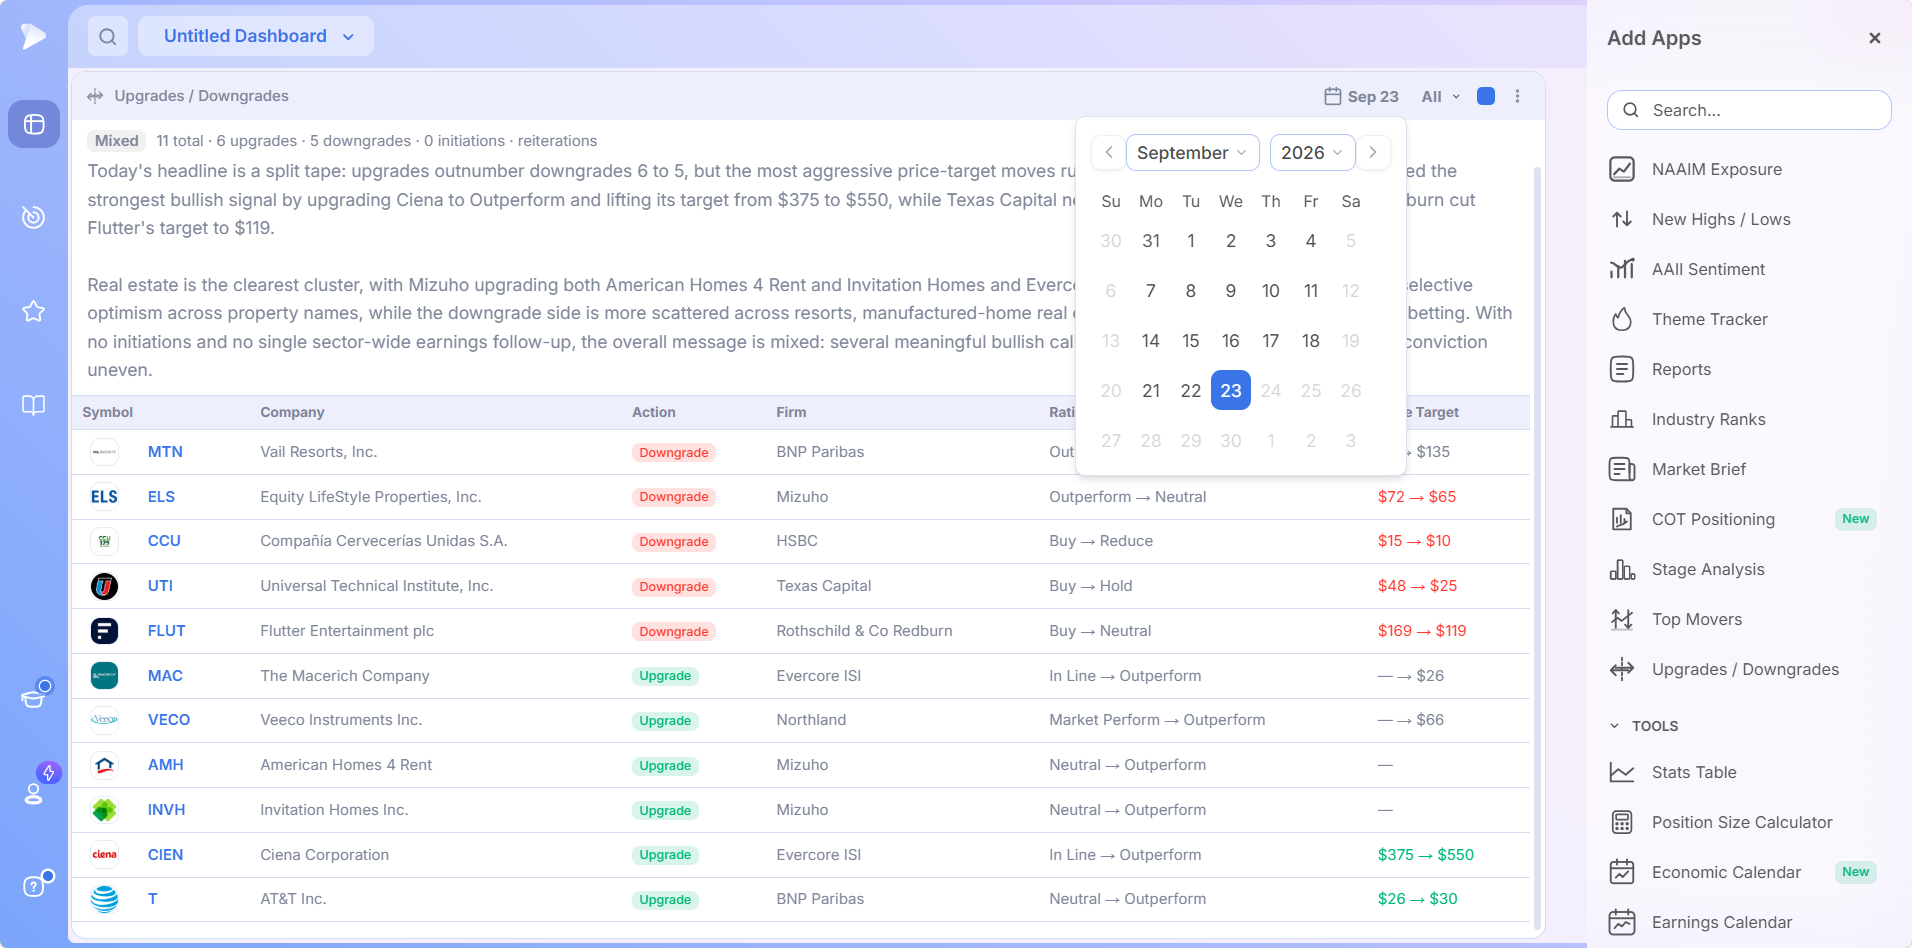
Month and year each have their own dropdown, arrows step through months one at a time, and the selected date is highlighted in the grid. Weekend dates are unavailable, which follows from there being no analyst actions when the market is closed, and future dates are unavailable for the same reason.
The obvious use is catching up after time away. The more interesting one is retrospective: when a stock made a sharp move a week ago and you never established why, loading that date and filtering to the relevant action type quickly tells you whether a rating change was behind it.
Adding the App to a Dashboard
Head for the Dashboard module. Begin a blank one, or reopen whichever dashboard you keep open.
Bring up the catalog of apps, either from the corner button or the one waiting in the middle of a blank canvas.
Locate Upgrades / Downgrades under Research and click it to add it.
Make it wide. Six columns of table plus the written brief need horizontal room, and a squeezed widget turns a ninety second read into a scrolling exercise.
The app arrives already filled with the current session, so nothing needs setting up before it earns its space. If you want it talking to a chart alongside it, put both into a shared color group using the small square in each header.
Start a Deepvue subscription and this dashboard takes about a minute to assemble.
How to Use It
Four ways to work with the app, in rough order of how often you will want them.
The Ninety Second Read
Count line, then brief, then stop. This is the default use and it is enough on most days. You learn whether the balance of opinion was constructive or negative, which specific actions mattered, and whether anything happened in the areas you care about. If nothing in the brief touches your positions or your watchlist, you are done.
Check the Downgrades Before the Open
If you hold anything overnight, this is the habit worth building. Filter to Downgrades and scan the symbol column for names you own or are about to buy. It takes seconds and prevents the specific unpleasant surprise of watching a position gap down and only then discovering why. Pair it with a watchlist on the same dashboard and the comparison becomes visual rather than a memory exercise.
Explain a Move You Cannot Account For
When a stock gaps and the chart offers no explanation, a rating action is one of the more common causes. Load the relevant date, filter to the action type you suspect, and look. If nothing appears, you have eliminated a possibility, which is worth something on its own. For anything the app cannot explain, the AI Terminal will take the question directly.
Watch for Clusters
Single actions are noise more often than not. Several actions pointing the same way across related names are not. One firm reassessing an entire corner of a sector in a single session, as with a run of Outperform to Neutral cuts across several restaurant names on the same day, is a different signal from one company being cut.
When you spot a cluster, take it to the group level. Industry Ranks shows whether the classification behind those names is slipping against the rest of the market, and Stage Analysis shows what shape the constituent stocks are actually in. Analyst sentiment turning while both of those deteriorate carries far more weight than any one of the three alone.
A Premarket Routine
Five steps, about three minutes.
Read the count line. Upgrades against downgrades, and the badge.
Read the brief. Note anything touching a sector you are exposed to.
Filter to Downgrades and scan for your own names.
Filter to Upgrades and look for anything on your watchlist that just gained an advocate.
Glance at Initiations for new coverage on names you follow.
Reiterations can usually wait. They are the category least likely to change what you do today, which is precisely why they come last.
Sign up for Deepvue and run that routine before tomorrow’s open.
Why This Beats a Ratings Feed
Stock market analyst ratings are published everywhere, and most sources present them identically, as a list in the order they arrived. The differences here are about interpretation and placement:
- ✓It explains before it lists. The written brief tells you which actions mattered, which no feed does.
- ✓The day is quantified up front. Totals by action type give you the balance of opinion in one line.
- ✓Four action types, filterable. Downgrades on their own is a different and more useful view than everything at once.
- ✓Price target direction is color coded independently of the action, which surfaces the mismatches worth noticing.
- ✓Rows are actionable, with color tags, watchlist adds, and alerts available from the symbol itself.
- ✓It stays on your dashboard beside your charts and lists, rather than on a website you have to remember to visit.
No platform is right for everyone, and the honest way to decide is a proper comparison. Our Deepvue comparisons hub sets Deepvue against MarketSurge, TradingView, TC2000, TrendSpider, and Finviz feature by feature, and the compare category collects every comparison article in one place.
What Traders Say About Deepvue
Four verdicts on the wider platform, in the reviewers’ own words.
“Deepvue consolidates all my information streams into one centralized hub.”
From the customer testimonials on deepvue.com. See it here
“One of the best trading tools out there and I can’t trade without it.”
Joshua Fong, reviewing on Google Play in November 2025. Google Play listing
“Deepvue is a great tool for traders.”
App Store reviewer, April 2026. View the listing
“It’s powerful, simple, and SUPER clean/easy to navigate.”
Verified financial services user on G2, rated five stars. Open the G2 review
On Deepvue’s reviews page, more than 220 verified reviewers produce a 4.8 average, and 97 percent of them would recommend the platform.
Where It Connects
A rating action is a piece of context and nothing more. These are the tools that convert it into something you might act on.
- •Charts for seeing how a stock actually reacted to the action, and watchlists so the names you care about stay beside the day’s list.
- •The Market Brief for the wider news picture behind the ratings, and the Theme Tracker for checking whether a theme is leading before you act on an upgrade inside it.
- •The screener for finding candidates in the areas the brief flagged as constructive. Formation based scans are grouped under screener by pattern; signal driven ones under screener by indicator.
- •The Position Size Calculator for sizing whatever you decide to act on.
Prebuilt approaches are indexed by screener strategy; the Ultimate Screening Guide helps you choose one for the present tape, and module documentation is in the Knowledge Base.
What the Upgrades and Downgrades App Costs
Upgrades / Downgrades is included in Deepvue’s single plan at $49 per month, with monthly and annual options. Deepvue has never charged for individual dashboard apps and has never built a premium tier.
That one plan covers:
- •The screener and its 1,152 data points.
- •Charts, watchlists, and alerts, all of them unrestricted.
- •Fully customizable dashboards, with every app in the catalog.
- •The Theme Tracker, Market Brief, and AI Terminal, the last with unbounded usage.
Deepvue has one plan, so there are no tiers to compare. For reference, MarketSurge, the legacy platform in this niche, runs $149 per month.
New subscribers also get a one on one onboarding session with a Deepvue team member, an onboarding email series covering platform features and use cases, and weekly live webinars that each go deep on one part of the platform.
Read the Verdict, Not the Feed
Nobody needs another list of stock upgrades and downgrades. What is genuinely useful is knowing which of the day’s calls carried weight, whether the balance of professional opinion moved for or against, and whether any of it touched something you own. That is a summary problem rather than a data problem, and it is the one this app is built to solve.
Create a Deepvue account and start each session knowing what changed overnight.
↑ Back to contentsFrequently Asked Questions
Worth clearing up before you make this part of your morning.
What does the Upgrades / Downgrades app show?
Every analyst rating action recorded for a given day, presented in three layers: a count line with totals by action type, a written brief explaining which moves mattered, and a table listing each action with its symbol, company, action type, firm, rating change, and price target change.
What does it mean when a stock is upgraded?
An analyst at a research firm has raised the rating on a stock they already cover, for example from Hold to Buy. It reflects that firm’s improved view of the company’s prospects, and it sometimes moves the share price on the day. It is an opinion rather than a fact about the business.
What happens to a stock when it gets downgraded?
Often it falls, because a downgrade signals that a covering analyst has become less positive and some holders act on that. The size of the move depends on the firm’s weight, how large the rating change is, and whether a price target was cut alongside it. Not every downgrade produces a reaction.
What is an analyst price target?
It is an analyst’s projection of where a stock will trade over a set horizon, usually about twelve months, built from valuation models rather than measured from the current price. In this app it appears as the Price Target column, colored by whether the target rose or fell, and it is frequently more revealing than the rating change beside it.
What do analyst ratings like Buy, Hold, and Sell mean?
Broadly, a Buy or Outperform rating means the analyst expects the stock to beat the market, a Hold or Neutral means roughly in line with it, and a Sell or Underperform means below it. Firms use their own words for the same ladder, which is why the app shows the exact transition from one rating to another rather than forcing everything onto a single scale.
Should you buy a stock after an analyst upgrade?
An upgrade is context rather than a signal on its own. The more useful reading is whether a meaningful rating jump arrived together with a raised price target, whether the firm carries weight, and whether the group behind the stock is also strong. Nothing here is financial advice.
Do analyst upgrades and downgrades move stock prices?
They can, though not every action does. A meaningful change from a firm that carries weight, especially paired with a target revision, can move a stock, often before the open, and downgrades tend to hit harder than upgrades lift. Many actions pass without a reaction, which is why the app’s written brief flags the few that actually mattered.
How accurate are analyst ratings?
Analysts research companies closely, but ratings remain opinions and firms frequently disagree on the same stock. The practical approach is to read them as a measure of professional sentiment and how it is shifting, rather than as a forecast, and to weigh clusters of agreement more heavily than any single call.
What action types does it cover?
Four kinds of analyst rating changes: upgrades, downgrades, initiations, and reiterations. The filter in the header offers each of those individually plus an All view that shows every action together.
Does the written summary change when I filter the table?
No. The count line and the brief describe the whole session no matter which action type the table is filtered to. Only the table narrows, which keeps the interpretation of the day intact while you look at one part of it.
Why is a price target green on a downgrade?
Because the color reflects the direction of the target, not the direction of the rating action. A firm can lower its rating while raising its price target, and Deepvue colors that target green beside the Downgrade badge, which flags exactly the kind of mixed message worth a closer look.
What does a dash in the Price Target column mean?
A dash on the left with a figure on the right means a target was set where none was previously recorded. A single dash on its own means the action came without a price target attached.
Why do different firms use different rating words?
Because rating scales are proprietary. Wolfe Research uses Peer Perform and Outperform, Morgan Stanley uses Equal Weight and Overweight, UBS uses Neutral and Buy, and Raymond James carries a Strong Buy above Outperform. Read the transition shown in the column rather than converting everything to one scale.
Can I save a name from the table?
Yes. Clicking the plus button beside a symbol opens a quick menu offering color tags, a searchable watchlist picker with a Create watchlist link, a Copy option, and Add alert.
Can I look at a previous day?
Yes. The calendar in the header opens a date picker with month and year dropdowns and arrows to move between months. Weekend dates and dates after the current one are unavailable.
What counts as an initiation?
Analyst initiations are a firm beginning coverage on a stock it did not previously follow. Because there is no prior rating, these entries show coverage being started or simply the rating being assigned, sometimes with a price target and sometimes without.
Are reiterations worth reading?
They are the least urgent category, but not empty. A firm restating its position after a stock has moved sharply is offering confirmation, which matters most when a change might reasonably have been expected instead.
Can I filter by firm or by my own holdings?
Not in the current interface. The filter covers action type only, so finding your own names means scanning the symbol column. Keeping a watchlist on the same dashboard makes that comparison much quicker.
Is the app included in the standard Deepvue plan?
Yes. Deepvue has a single plan at $49 per month that includes Upgrades / Downgrades along with the screener, charts, watchlists, alerts, dashboards, the Theme Tracker, the Market Brief, and the AI Terminal.