Stock Screener by Indicator
A stock screener by indicator treats every technical reading as a filter rather than a line on a chart, so one question, such as which stocks are above a rising 21 day EMA with a relative strength line at a new high, is answered across the whole market at once. Deepvue carries 276 technical measures as conditions and columns, ships them as ready made presets, and the indicator pages collected here explain one measure at a time: what it measures, when it fails and how to screen with it. $49 a month.
Key Takeaways
Indicators are the language of the chart. Moving averages, relative strength, relative volume, closing range: each compresses weeks of price and volume into a reading that can be judged in a second. The problem is that a chart shows one stock, and the reading you want is rare. Finding it by paging through names is slow, and by the time the tour is done the market has moved.
Deepvue’s screener turns the same readings into searchable fields. Set the condition once, sort by the measure that matters, and the market answers with a list instead of a tour. The indicator pages below each take one measure and show how the traders who rely on it turn it into a screen.
- ✓276 technical measures are available as screen conditions and result columns, from moving averages to relative volume and closing range
- ✓An indicator screen asks the market a question; the chart beside each result checks the answer
- ✓The best screens combine one measure from each family, trend, momentum, volatility and volume, rather than three from one
- ✓Relative strength is the leadership test, moving averages are the structure test and volume is the participation test
- ✓Presets cover the common configurations, and a saved copy of any of them opens every threshold
- ✓One $49 a month plan carries the indicators, the screener, charts, watchlists and alerts
Stock Screener by Indicator: Choose Your Measure
Each indicator under this hub has a page of its own explaining the calculation, the preset built on it, the columns that make the results readable and how to trade what it returns.
Relative Strength Stock Screener
The stock measured against the market instead of against itself. The page is built on the Relative Strength New Highs presets, which return stocks with an RS line at a fresh one, three or six month high, an early sign of new leadership, and covers the RS Rating, the RS line and why an RS high before a price high is the read that matters.
IPOs Above 21 EMA Screener
The 21 period exponential moving average applied to the one group of stocks without longer averages to lean on: recent IPOs. The page is built on Eric Krull’s preset of liquid new listings still closing above the line, maps the hold to the phases of The Lifecycle Trade and explains the pullback entry, the IPO base breakout and the close below the line as the exit.
What a Technical Indicator Actually Tells You
An indicator is arithmetic on price, volume or both, drawn as a line, a band or a histogram. It contains nothing that was not already in the price series. What it adds is compression: a 50 day average is fifty closes in one number, an RS line is a year of relative performance in one slope, relative volume is today against the stock’s own habit in one ratio.
That is why indicators do not predict and why they still matter. A trader who can read trend, momentum and participation from three glances is processing a lot of history fast. A technical stock screener applies the same three glances to every listed name in the same second, which is the only way the rare configuration gets found.
The Four Families, and Why One From Each
| Family | Examples in Deepvue | The question it answers |
|---|---|---|
| Trend | Simple and exponential moving averages, distance from the average, stage indicator | Is the stock in an uptrend at my timescale, and where is the reference level? |
| Momentum | RS Rating, RS line, RS line new highs, rate of change | Is it leading the market, and is the lead growing or fading? |
| Volatility | Average true range, closing range | How much does it move, and is the range unusually tight or wide right now? |
| Volume | Relative volume, up/down volume ratio, dollar volume | Is anyone with size participating, and on which side? |
Three trend measures in one screen ask the same question three times and produce a list that is mostly noise. One condition from each family asks four questions, and the stocks that satisfy all four are the ones worth a chart. That principle runs through every indicator page under this hub.
Leading, Lagging and the Timeframe Problem
Every indicator built from past prices lags by construction, and the longer its window the more it lags. The 200 day average confirms a trend months after it started; the 10 day EMA confirms it within days and gets whipsawed for the privilege. Neither is wrong. The setting has to match the holding period, which is why a swing trader’s screen keys off 10 and 21 period lines while a position trader’s keys off the 50 day and the 40 week. Volume is the one family that leads rather than lags, because a surge of participation arrives before the price move it funds is complete.
The Three Readings Growth Traders Screen On First
Traders from the O’Neil, Minervini and Weinstein traditions converge on a short list, and the indicator pages here are being built in that order.
- •Relative strength, because outperformance persists and a leadership floor should be applied before any other condition.
- •Moving averages, because they define the trend at each timescale, mark where pullbacks find support and give the stop a defensible place.
- •Volume, because it is the only reading rooted in something other than price, and institutions cannot hide their size in it.
Oscillators such as RSI, MACD and stochastics are available as conditions too, and a saved screen can add any of them. The pages under this hub start with the readings that decide which stocks deserve a chart, because a timing signal on a laggard is still a laggard.
How to Run an Indicator Screen in Deepvue
The mechanics are the same whichever measure the screen keys off.
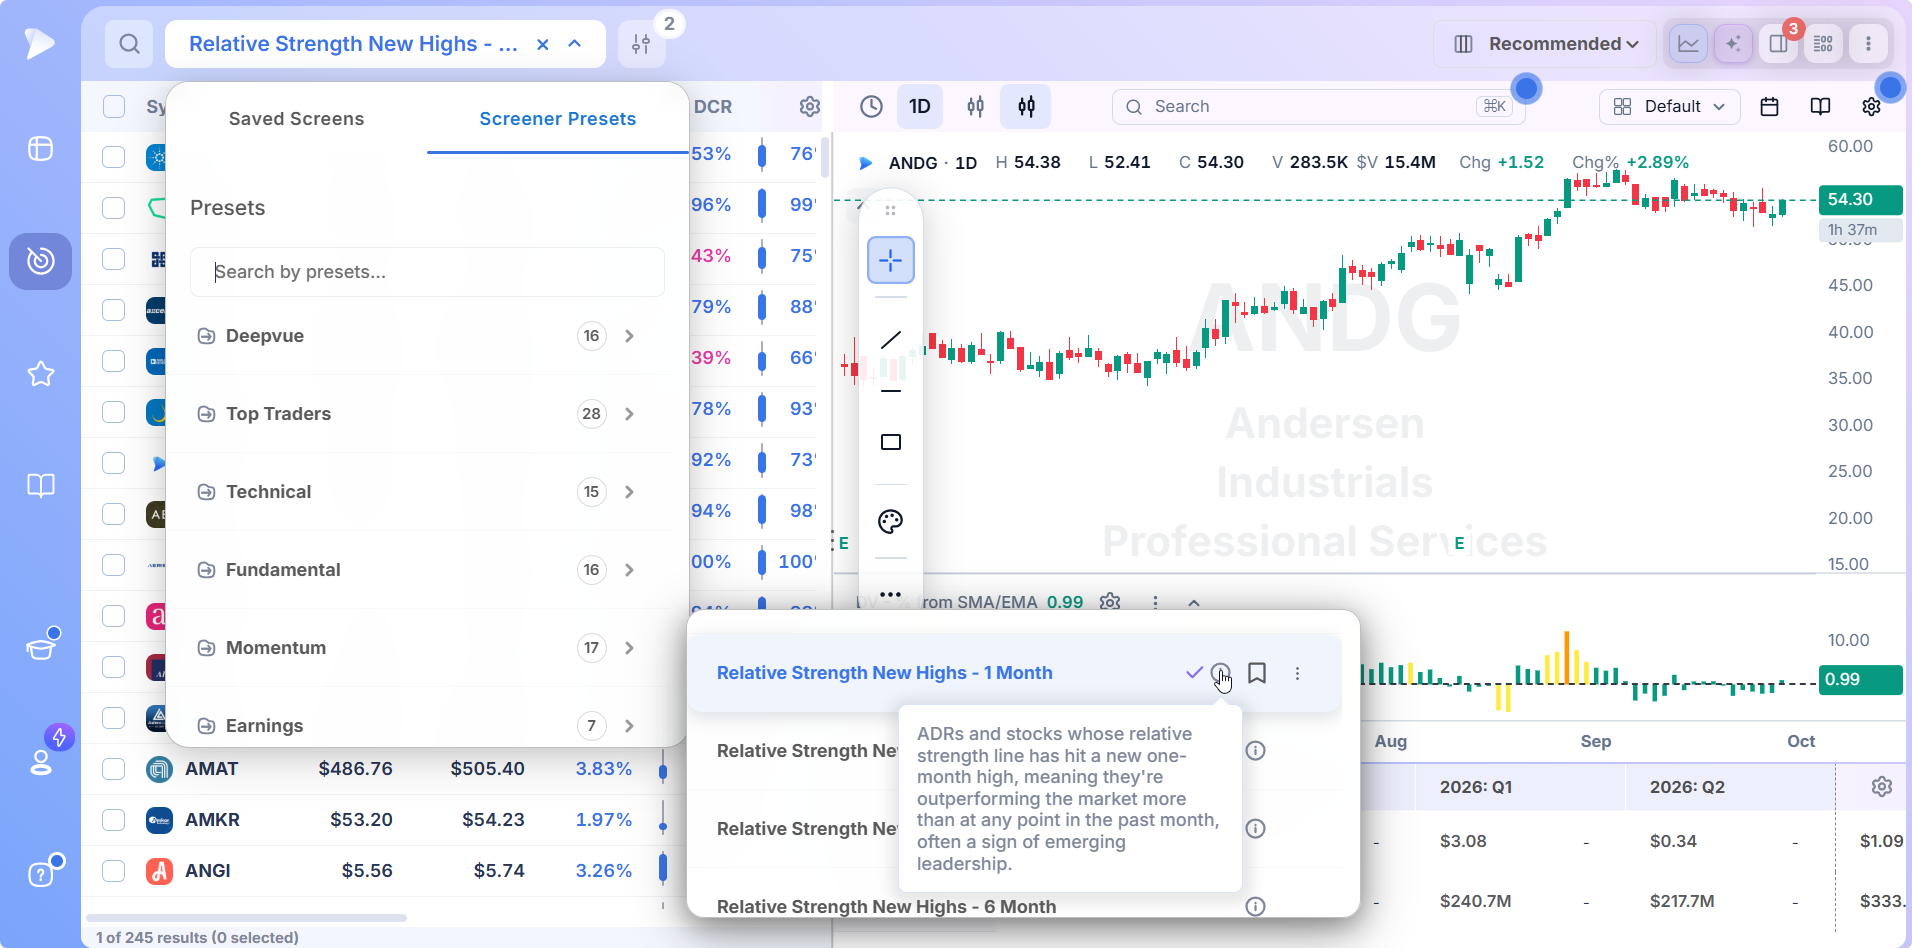
In the screener, click the current screen’s name to reach the presets menu.
Choose Screener Presets, then the Technical category or a trader’s folder, and load the screen closest to the reading you want.
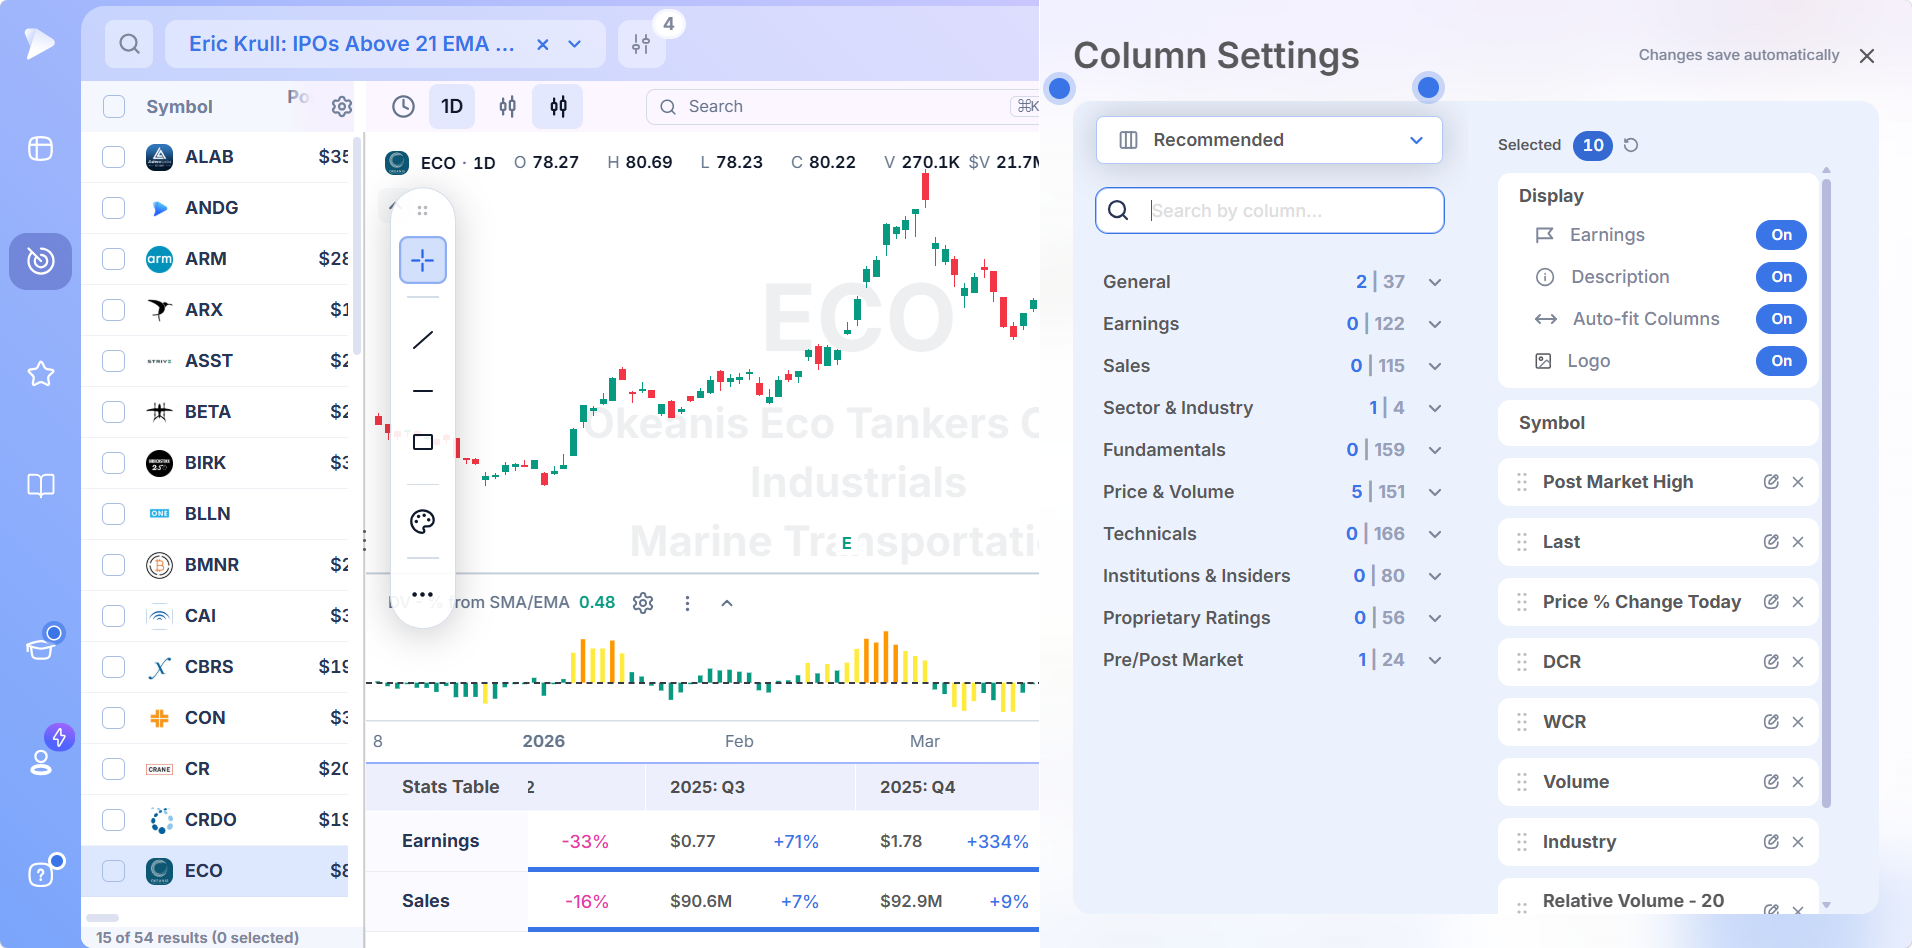
Open Column Settings and add the measure the screen keys off as a column, so results rank by it rather than merely pass it.
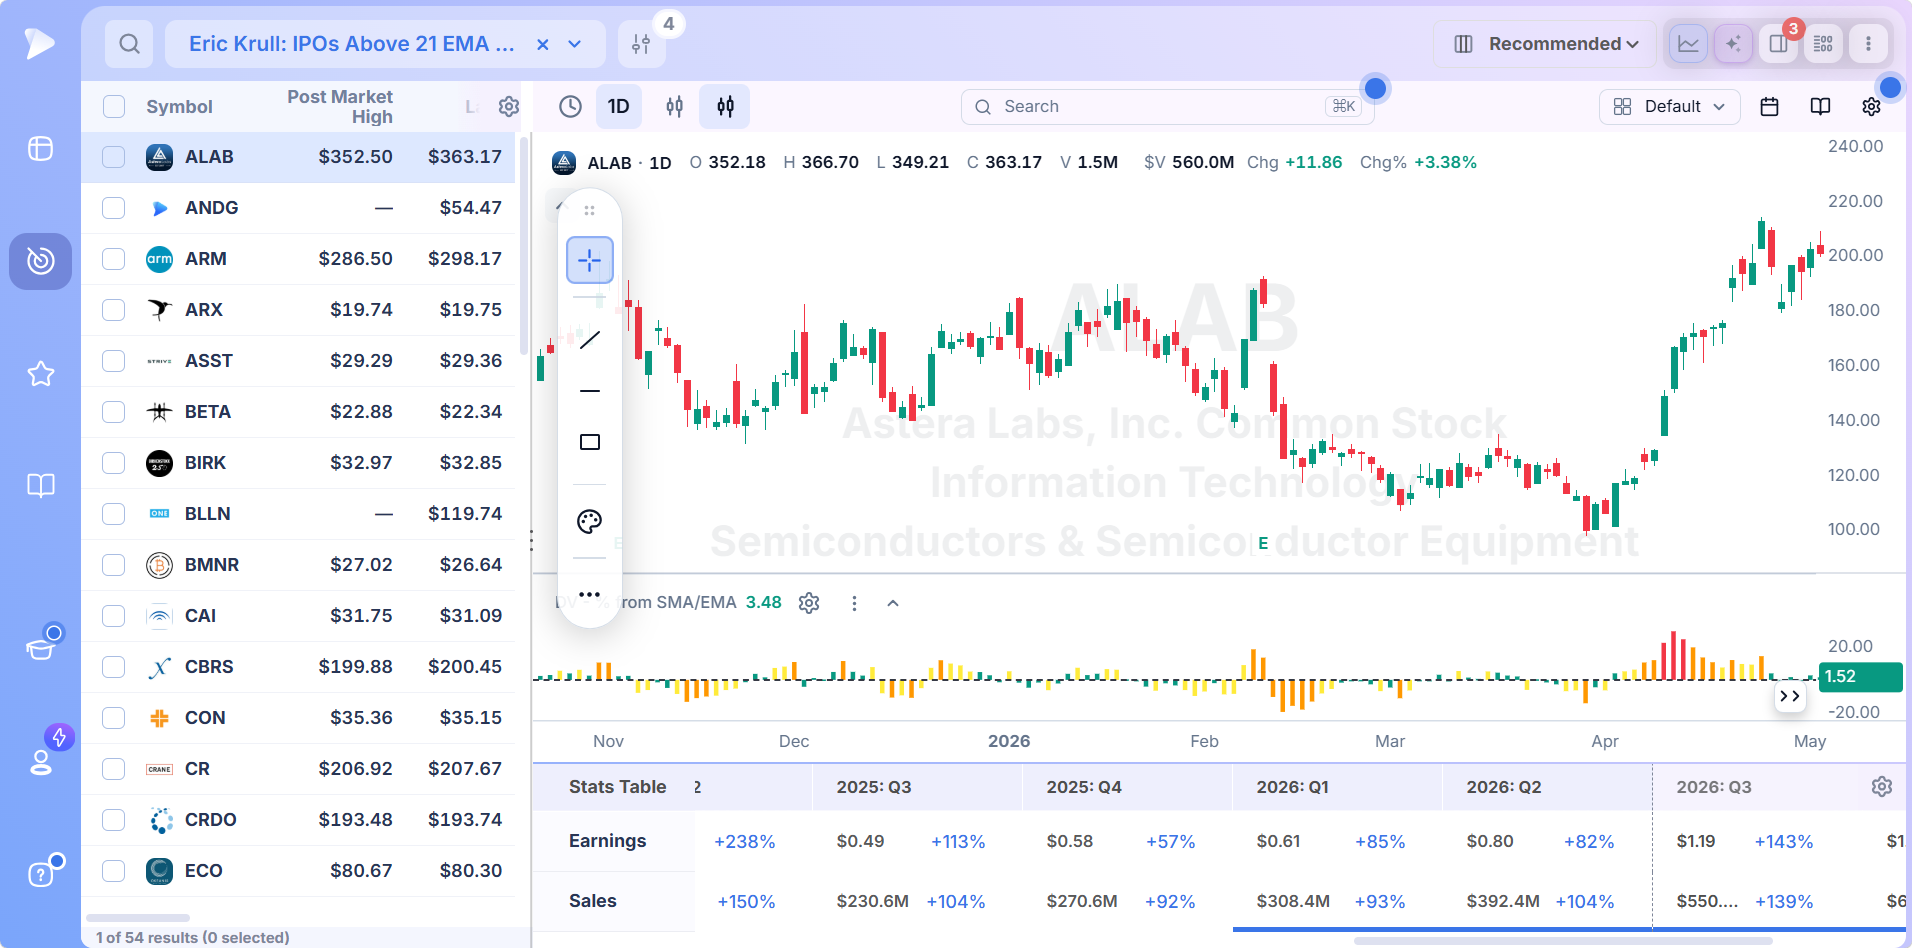
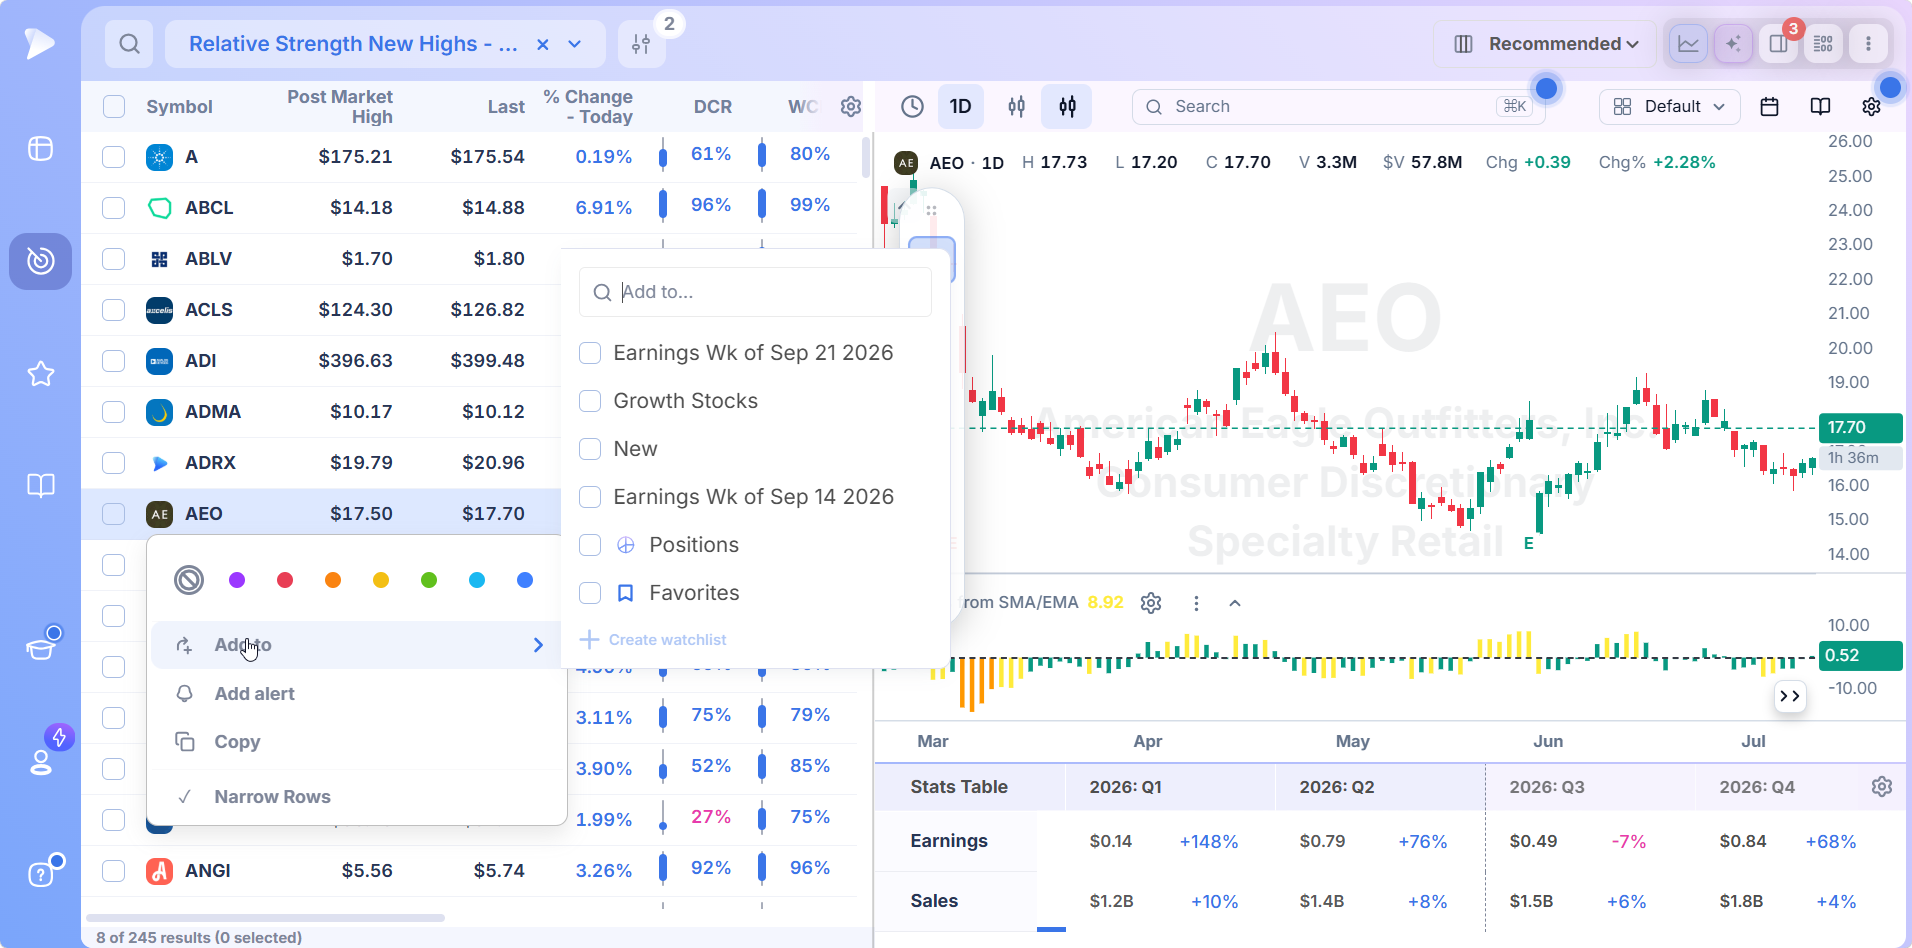
Sort, then click a row: the chart appears beside the list with the indicator drawn, and the reading can be checked against the structure around it.
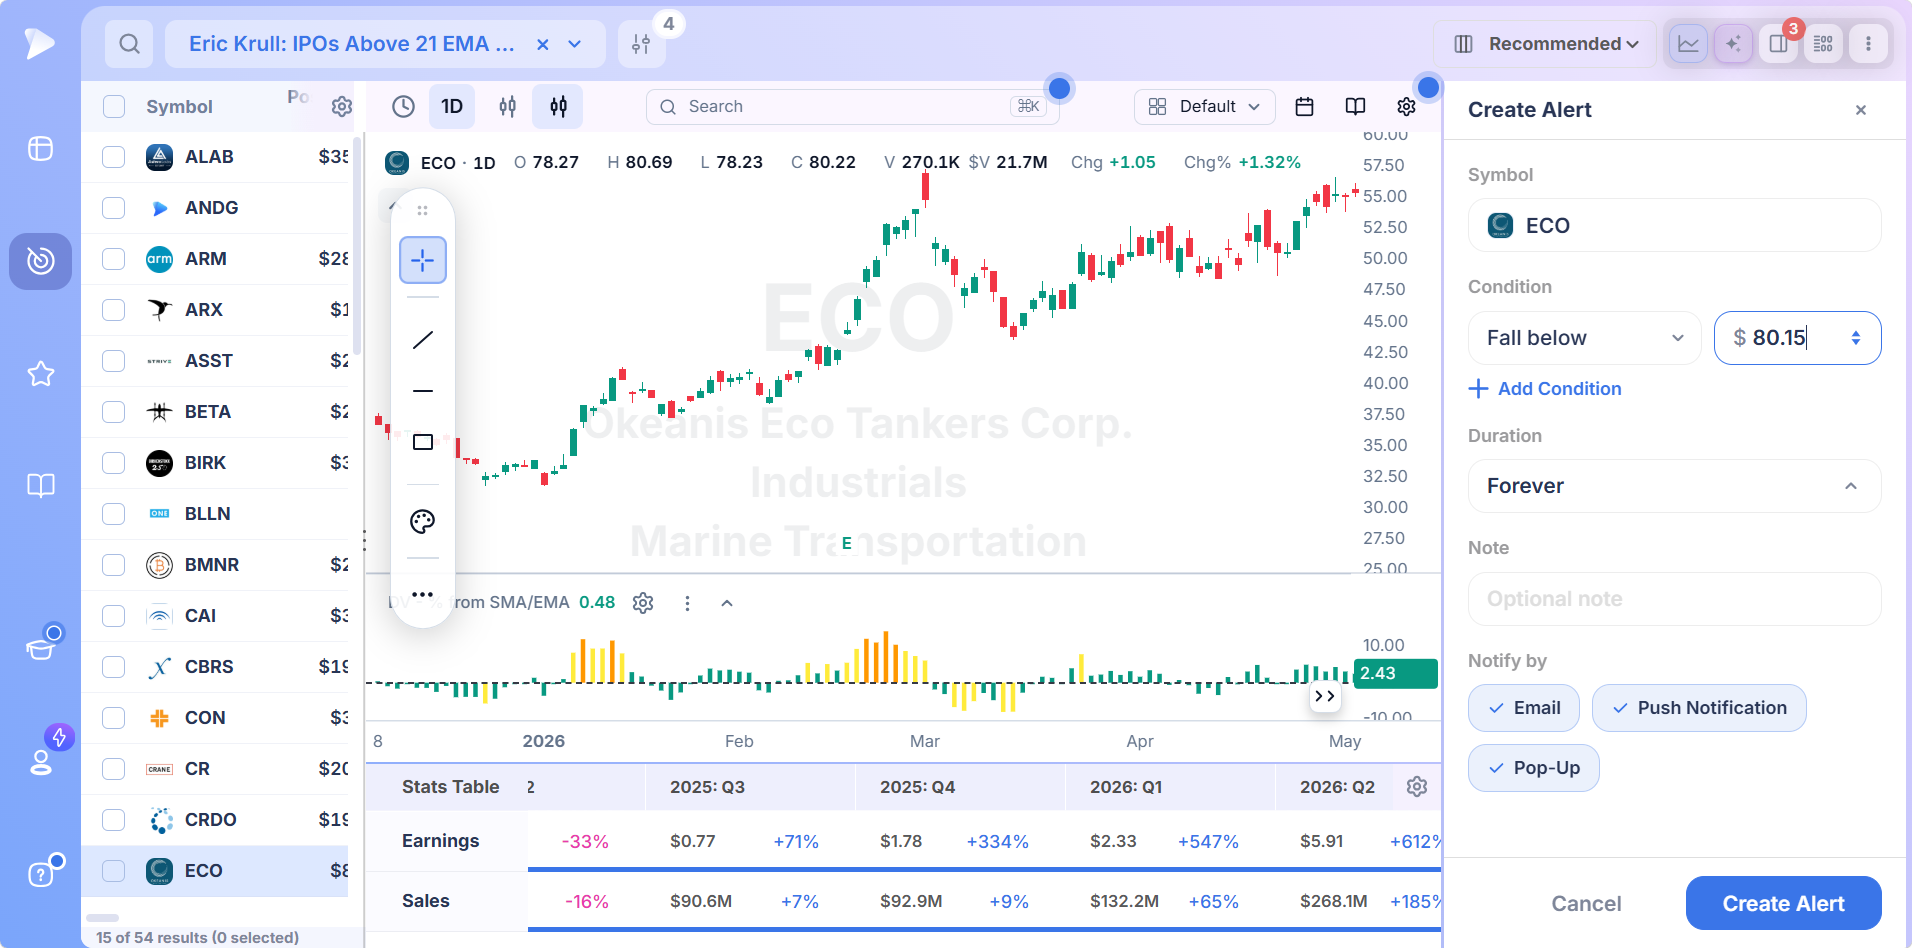
Right click a qualifying name to list it or to place an alert at the level where the indicator would change its answer.
Conditions and Columns Are the Same Fields
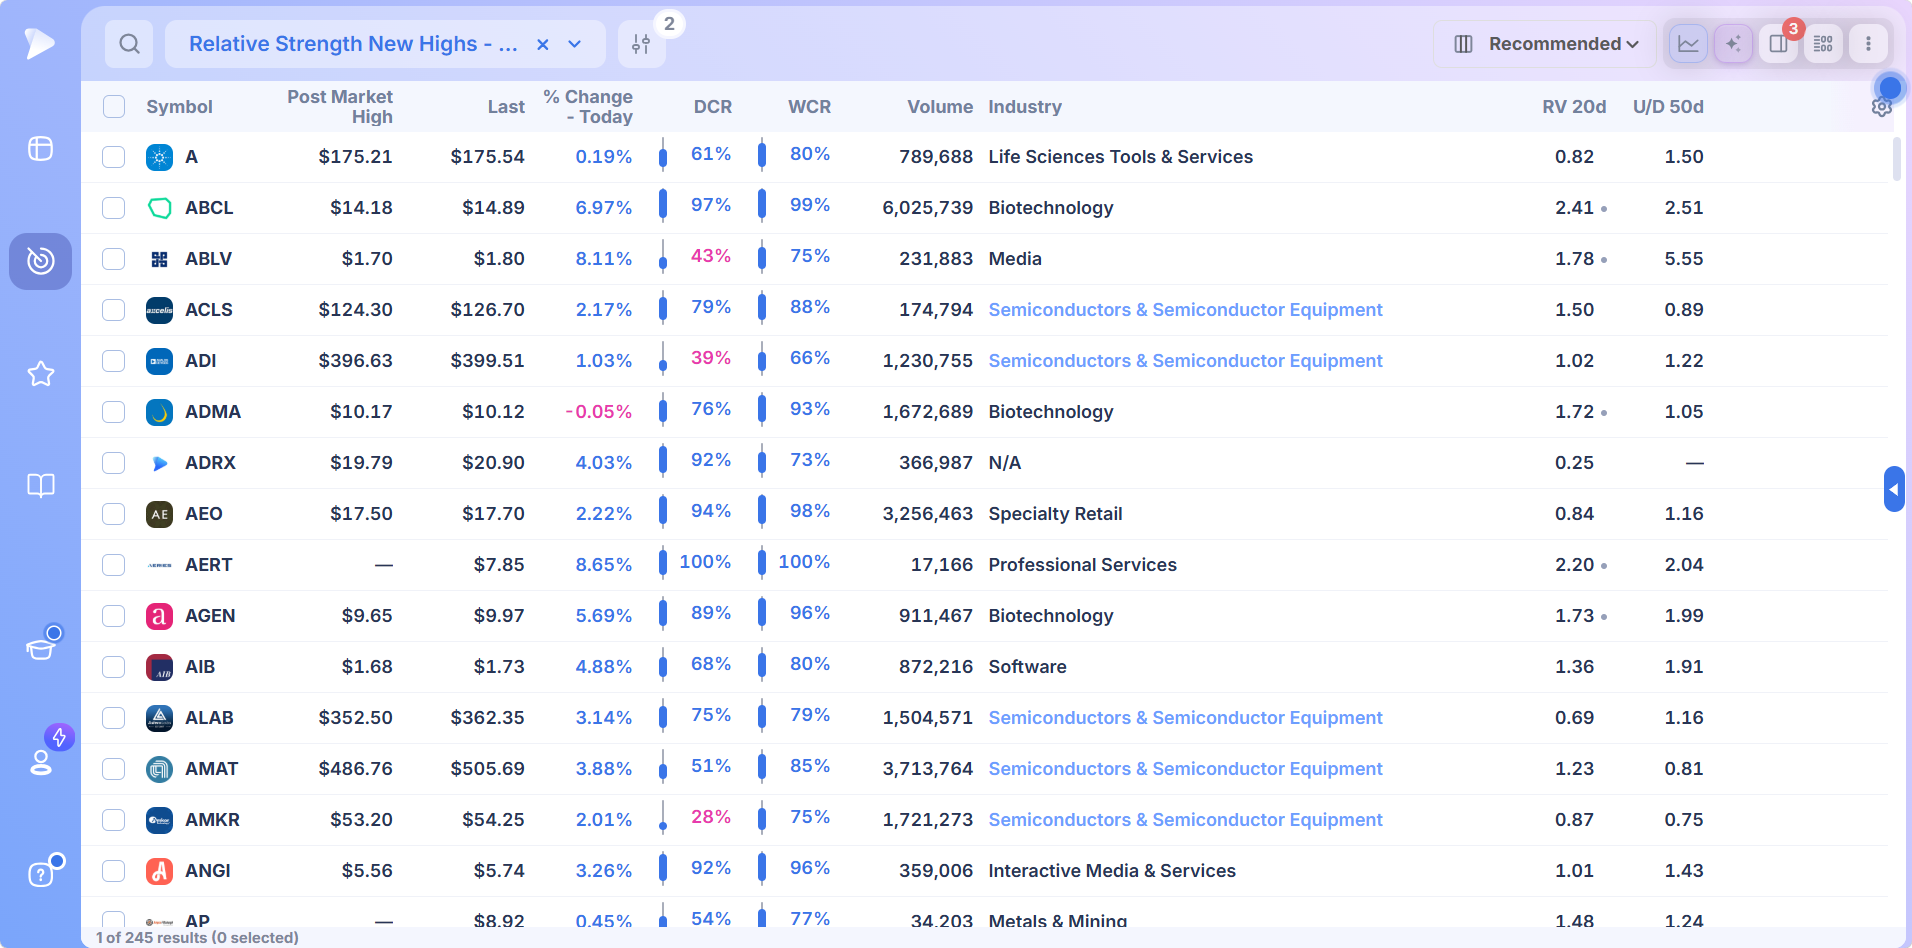
The technical group in Column Settings runs to 166 fields, alongside price and volume, proprietary ratings, fundamentals, earnings and ownership. Every one of them works as a filter in the screen builder and as a sortable column in the results, which is what lets a screen be narrowed by one reading and ranked by another.
The Chart Is the Second Opinion
A screen reports that a condition is true. The chart beside each result shows whether it is true in a way worth trading: a stock ten cents above its 21 EMA after a two week slide and one riding the line for three months both pass the same test. Indicator panes under the price, such as distance from the moving average, make that distinction visible without leaving the screener.
From Reading to Position
Names that pass the chart check go to a watchlist by right click, and an alert can be set at the price where the indicator would flip: the moving average for a trend screen, the breakout level for a relative strength screen. The screen finds the reading and the alert watches it, which frees the session for the trades themselves.
How to Build Your Own Indicator Screen
Presets are locked so the definition stays intact. Save a copy and every threshold opens. A well built indicator screen usually follows the same shape:
Start with a leadership condition, such as an RS Rating floor or an RS line at a new high, so everything downstream is applied to stocks already outperforming.
Add one trend condition at your timescale: price above the 21 EMA for swings, above a rising 50 day for positions.
Add one volume or volatility condition, such as relative volume above 1.5 or a tight closing range, and stop adding.
Use a liquidity floor so the list is tradable at your size.
Save it, name it and put it in a folder; it reruns on live data every session.
The AI Terminal builds the same screen from a sentence, so “stocks above the 21 EMA with an RS line at a six month high on twice normal volume” returns an editable condition set rather than a syntax error.
Which Indicator Screen Fits Your Style
| If you trade like this | Screen on | Why |
|---|---|---|
| Swing trades over days to weeks | 10 and 21 period EMAs, relative volume, closing range | Short averages track the move you are trading and volume confirms the entry day |
| Position trades over weeks to months | 50 day and 40 week averages, RS Rating, stage | Longer lines filter the noise and leadership keeps you in the right names |
| New leadership before it is obvious | RS line new highs | The RS line often turns up before price does |
| Recent IPOs with no long history | 21 period EMA, dollar volume | The first line a new listing supports, plus a liquidity test |
| Pullback entries in established trends | Distance from the moving average, up/down volume | Buys the return to the line while accumulation continues |
| Unusual activity today | Relative volume, percent change | Finds where size arrived this session |
Beyond the Indicator Screens
Indicators are one way to organize the screener library. The other hubs sort screens by what they are built around rather than which reading triggers them.
- •Stock screener by trader, the presets that carry a trader’s name and follow that trader’s published rules.
- •Stock screener by pattern, where the trigger is a recognizable formation rather than a single reading.
- •Stock screener by market timing, the scans keyed to a moment in the trading day.
- •Screener by strategy, the screens organized around a method rather than a measure.
The categories overlap by design. A trader’s screen is usually an indicator screen with a name on it, and a pattern screen is usually several indicators combined. The screening guide walks through how the pieces fit.
Who This Hub Is For
- •Chart readers who already watch these indicators and want the same readings applied to the whole market
- •Growth and momentum traders whose method starts with relative strength and moving averages
- •Anyone comparing a technical stock screener to a charting package and wanting to see the difference
- •Traders building a custom screen who want the measure explained before the threshold is set
Pricing
$49 a month on a single plan, nothing gated.
- •All 276 technical measures as conditions and columns, plus the ratings, fundamentals and ownership fields beside them
- •Every preset in the Technical category and the rest of the library, editable once copied
- •Charts with the indicators drawn and paned, watchlists and alerts on the same screen
- •Live updating across 568 fields, so a condition that is true at 10:30 is on the list at 10:30
The comparable platform, MarketSurge, is $149 a month.
New accounts include a setup call, introductory emails and weekly webinars that each take one module apart.
Ask the Market, Not the Chart
Every indicator was invented to answer one question about one stock. A stock screener by indicator asks the same question of every stock at once and returns only the ones that say yes. The indicator pages here explain what each reading means so the list that comes back is one you can act on, and the presets mean the first list is a click away.
↑ Back to contentsFrequently Asked Questions
What is a stock screener by indicator?
A stock screener by indicator is a screener where technical readings such as moving averages, relative strength and relative volume are filter conditions rather than chart drawings, so a configuration you would recognize on one chart can be searched across every listed stock. Deepvue carries 276 such measures as both conditions and columns.
Which technical indicators can you screen on in Deepvue?
You can screen in Deepvue on simple and exponential moving averages, distance from the average, the RS Rating and RS line, relative volume, up/down volume, closing range, average true range, stage, RSI, MACD and the rest of the 276 technical measures, each usable as a condition in the screen builder and as a sortable column in the results.
What are the four types of technical indicators?
The four types of technical indicators are trend, momentum, volatility and volume. Trend indicators include moving averages, momentum indicators include relative strength and RSI, volatility indicators include average true range and Bollinger Bands, and volume indicators include relative volume. A good screen takes one from each rather than several from one.
What is the difference between leading and lagging indicators?
A lagging indicator is built from past prices and confirms a move after it has begun, which describes every moving average and most oscillators. A leading indicator points to a move before price completes it, and in practice that is volume, since heavy participation arrives before the price change it funds is finished. Screens usually combine one of each.
What are the best indicators for swing trading?
The best indicators for swing trading are short moving averages such as the 10 and 21 period EMAs to define the trend being traded, relative strength to keep the list to leaders, and relative volume and closing range to confirm the entry day. Deepvue ships presets on each and the swing trader’s combination is one saved screen.
What is a technical stock screener?
A technical stock screener filters stocks on price derived and volume derived readings rather than on fundamentals, returning the names whose chart currently matches a set of conditions. Deepvue is both, so a technical screen can carry an earnings or ownership condition beside the indicator conditions.
How many indicators should one screen use?
One screen should use two to four indicators drawn from different families. A leadership condition, a trend condition and a volume or volatility condition cover the questions that matter, and adding more from the same family shrinks the list without improving it. Every indicator page under this hub follows that structure.
Can I screen for a golden cross or a moving average crossover?
Yes, you can screen for a golden cross or any moving average crossover in Deepvue by setting one average above another as a condition, for example the 50 day line over the 200 day, and comparing the two averages against each other in the screen builder. Shorter settings suit swing holding periods and longer ones suit position trades.
Do indicator screens work for recent IPOs?
Indicator screens work for recent IPOs only when the indicator has enough history to compute, which rules out 200 day and 50 day averages for a stock that listed weeks ago. The 21 period EMA is the first trend line a new listing supports, and the IPOs Above 21 EMA screener under this hub is built on it.
Is a stock screener by indicator the same as charting software?
No, a stock screener by indicator is not the same as charting software. Charting software draws the indicator on one stock at a time; the screener evaluates the indicator across every stock and returns the matches. Deepvue does both, and the chart opens beside each screen result so the reading can be checked in context.