Deepvue Position Size Calculator: Know Your Share Count Before You Click Buy
The Position Size Calculator is a dashboard app inside Deepvue that turns your risk rules into a share count. Enter an account size, what you will risk on one position, a cap on position size, a profit target, a stop and an entry price.
It returns four numbers: position size in shares, position value, dollars actually at risk, and the trade’s R multiple. All of it works next to the chart you are reading, not in a separate browser tab.
and size your next trade from the stop, not from a gut feeling.
The Deepvue position size calculator, in numbers:
Key Takeaways
Position sizing gets talked about constantly and calculated rarely. Everyone agrees you should risk a fixed percentage per position. Far fewer work out, in the moment, what that means in shares when the stop is 2 percent below the entry instead of the 3 percent they had in mind.
That gap is arithmetic, and arithmetic is what a calculator is for. Get it right and every trade risks the same amount whatever the stock costs. Get it wrong and one bad position can undo a month of good ones.
- ✓Six inputs, four outputs: share count, position value, dollars at risk and R multiple, from one press of Calculate.
- ✓Dollars or percentages, row by row. Four input rows accept either unit, so you work in whichever you think in.
- ✓A position cap protects you when a very tight stop would otherwise justify an enormous share count.
- ✓Get Quote pulls the current price into the Entry Point once you type a symbol.
- ✓A color group links the app to your chart and lists, so it follows the name you are viewing.
- ✓No separate purchase. Size your next trade in Deepvue.
Position Size Calculator at a Glance
- Inputs
- Account Size, Equity at Risk Per Position, MAX Position Size Allowed, Profit Taking Price, Stop Loss Exit Price, Entry Point
- Paired fields
- Four rows accept a dollar figure or a percentage; the other box matches
- Outputs
- Position Size (Shares), Position Value, $ at Risk, R Multiple
- Live price
- A Symbol field and a Get Quote button next to the Entry Point
- Empty state
- The Results panel asks for values until the inputs are complete
- Header controls
- A color group square plus the three dot menu
- Where to find it
- Add Apps, under Tools
- Cost
- Comes with the one Deepvue subscription at $49 per month
What Is the Deepvue Position Size Calculator?
It is a stock market position size calculator built into the platform as a dashboard app, and it answers one question: given my rules and this setup, how many shares do I buy? Some traders call it a share size calculator, which is exactly what it produces.
Rather than a general purpose calculator on another site, it works next to the chart you are reading, and that proximity is the difference between doing the math and skipping it. You add it from the Tools group in Add Apps with a single click.
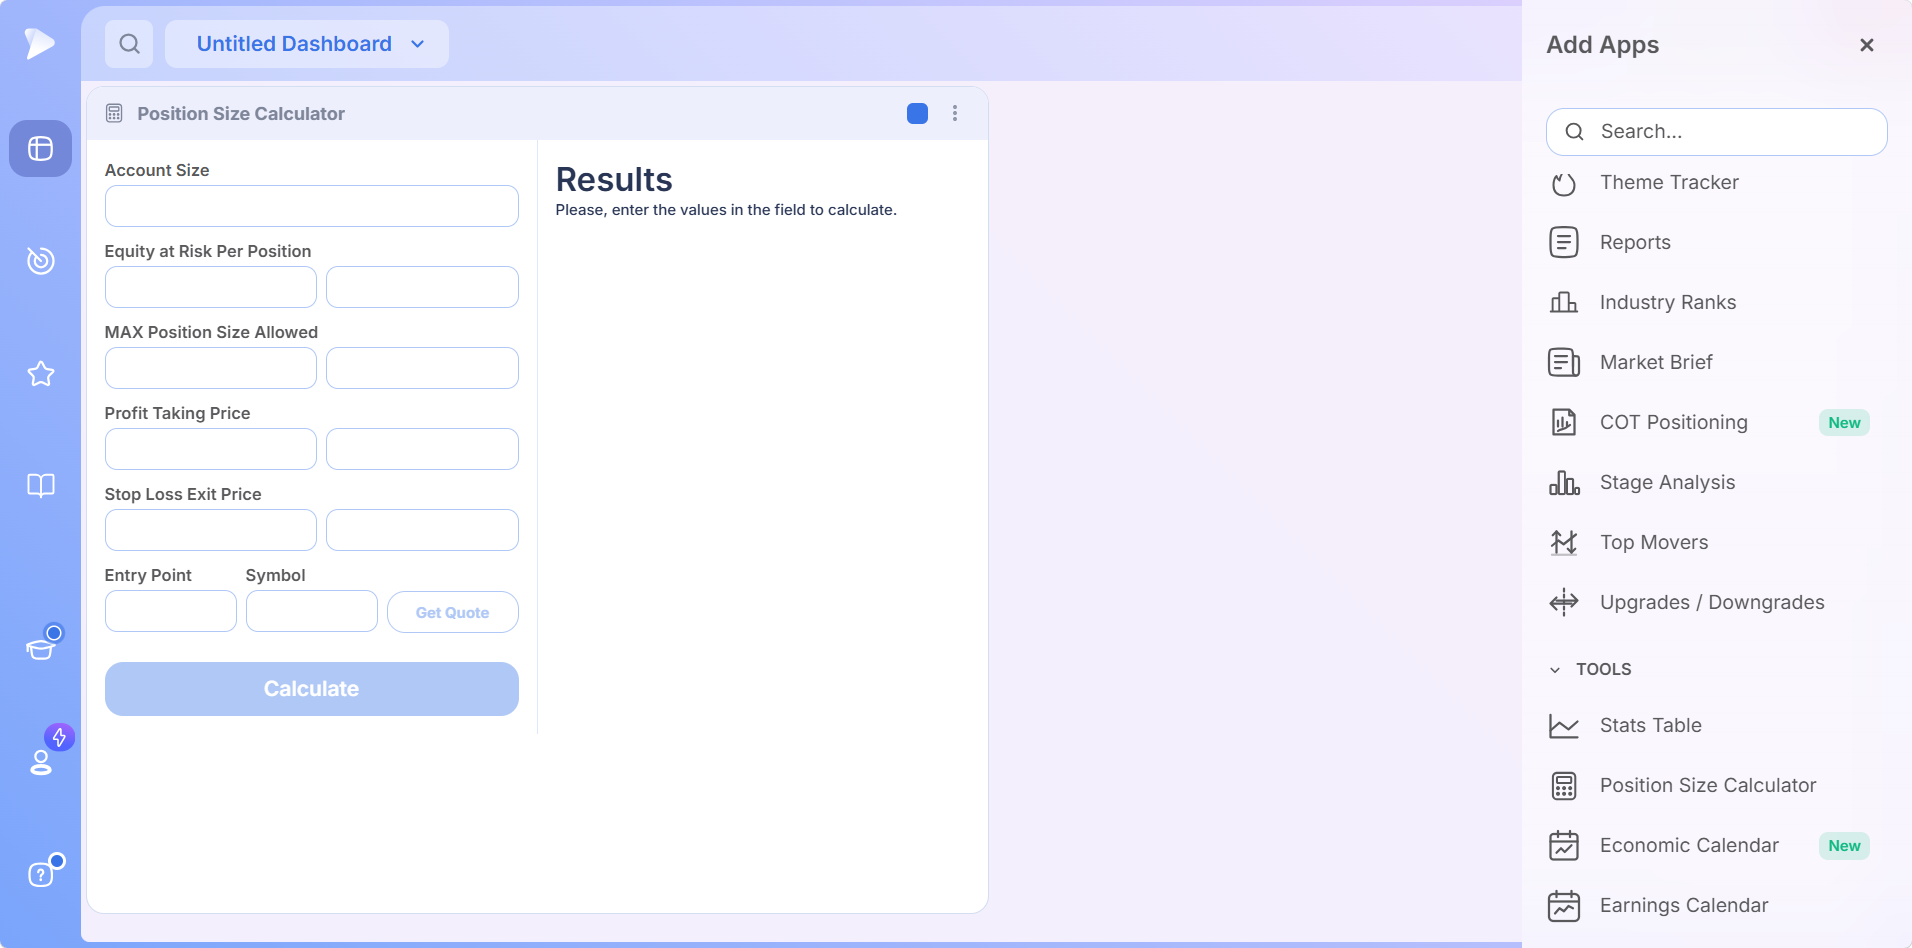
- •Inputs on the left: six labeled rows, four of them split into a dollar box and a percentage box.
- •Results on the right: empty until you calculate, with a prompt asking for values.
- •Header: the app name, a color group square and a three dot menu.
Why Position Sizing Starts From the Stop
Your risk budget for a position is a fixed amount of money; the distance between entry and stop is the risk per share. Divide one by the other and you get a share count that holds the loss to your budget however volatile the stock is.
The consequence catches people out: a tighter stop means a larger position, a wider stop a smaller one. Two trades with completely different share counts can carry identical risk, and two trades with the same share count almost never do. Sizing by feel, or always buying the same dollar amount, quietly makes every position a different size in the only unit that matters.
Who the Position Size Calculator Is For
Anyone trading with defined stops. A stock position size calculator only earns its keep when you already know where you are getting out.
- ✓Swing traders whose stop distance changes with every setup, so the share count should change with it. Deepvue for swing traders shows the full routine.
- ✓Position traders holding fewer, larger positions, where getting size wrong is expensive. Deepvue for position traders maps out that longer horizon.
- ✓Breakout traders buying volatile growth stocks, where a fixed dollar amount produces wildly inconsistent risk.
- ✓CANSLIM® traders following a written stop rule who want every entry sized to it without a spreadsheet.
- ✓Traders with a risk rule they do not apply consistently yet, a very common gap.
- ✓Anyone who wants the R multiple before taking a trade instead of working it out afterward.
Every Field Explained
Six rows, top to bottom, each with a job. Account Size and Entry Point are the only two without a percentage box: account size is the reference everything else measures against, and the entry shares its row with the Symbol field and Get Quote.
| Field | What it is | Why it matters |
|---|---|---|
| Account Size | Your total trading capital | Sets the scale for your risk rule, so a 1 percent rule means something concrete |
| Equity at Risk Per Position | How much you accept losing if the trade hits your stop | The single most important number here. It is a rule you set once, not a decision per trade |
| MAX Position Size Allowed | A ceiling on how large any one position may become, in money or as a share of the account | Risk based sizing has no upper bound of its own; this stops a very tight stop from justifying an oversized holding |
| Profit Taking Price | Where you intend to take profit | Leaves the share count untouched. It drives the R multiple, which tells you whether the trade is worth taking |
| Stop Loss Exit Price | The level where you accept the idea was wrong | With the entry, sets risk per share and therefore the whole calculation. It changes most often, because it belongs to the chart |
| Entry Point | Where you expect to buy, with a Symbol field and Get Quote beside it | Get Quote pulls the current price in, so the figure you size against does not go stale while a setup develops |
The Paired Dollar and Percentage Fields
This is the detail that makes the app quick to use, and the one people most often miss. Four rows have two boxes holding the same instruction in two units. Type whichever you find natural and the other box matches.
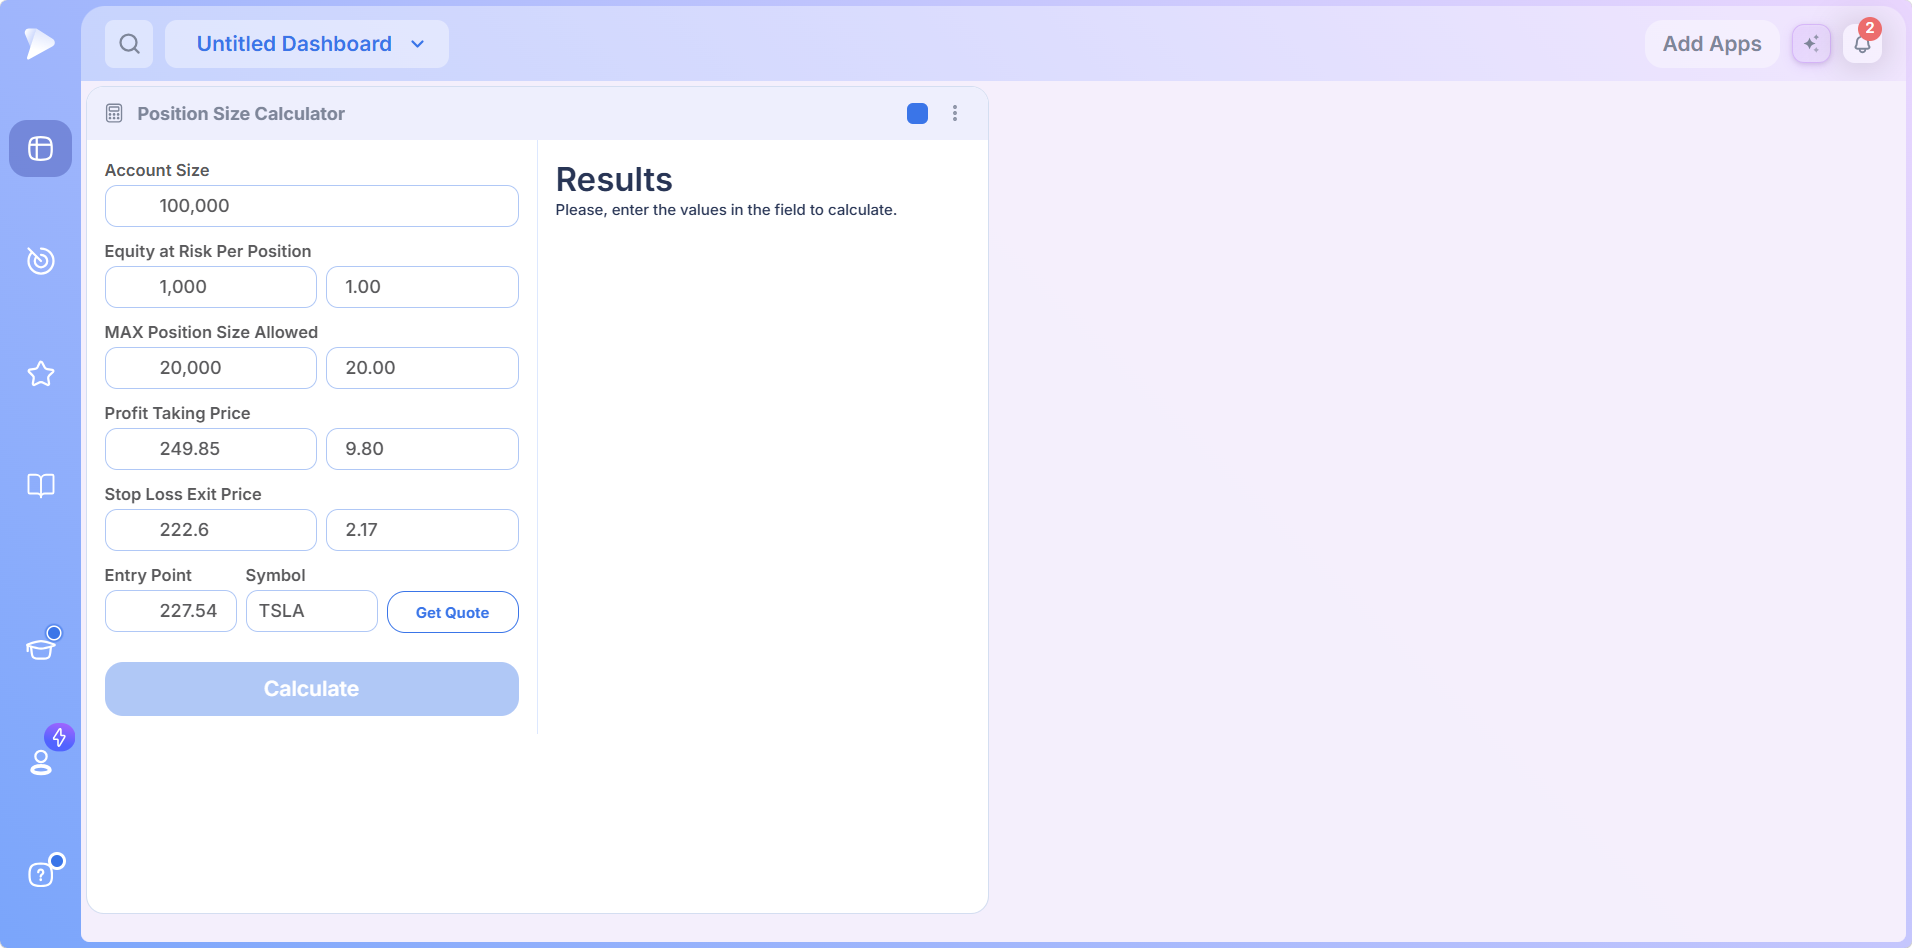
| Row | Left box | Right box measures |
|---|---|---|
| Equity at Risk Per Position | Dollar amount | Percent of account size |
| MAX Position Size Allowed | Dollar amount | Percent of account size |
| Profit Taking Price | Target price | Percent above the entry |
| Stop Loss Exit Price | Stop price | Percent below the entry |
The two upper rows are percentages of your account; the two lower rows are percentages of the entry price. That distinction is worth holding onto, because it is easy to assume all four work the same way.
The flexibility saves real time. Risk rules come naturally in percentages and stops come naturally in prices, so entering each in its own unit means no mental conversion at the moment you are trying to act.
Reading the Results
Press Calculate and the right panel fills with four figures. The share count leads in large type, because it is the number you actually need, with three supporting figures below it.
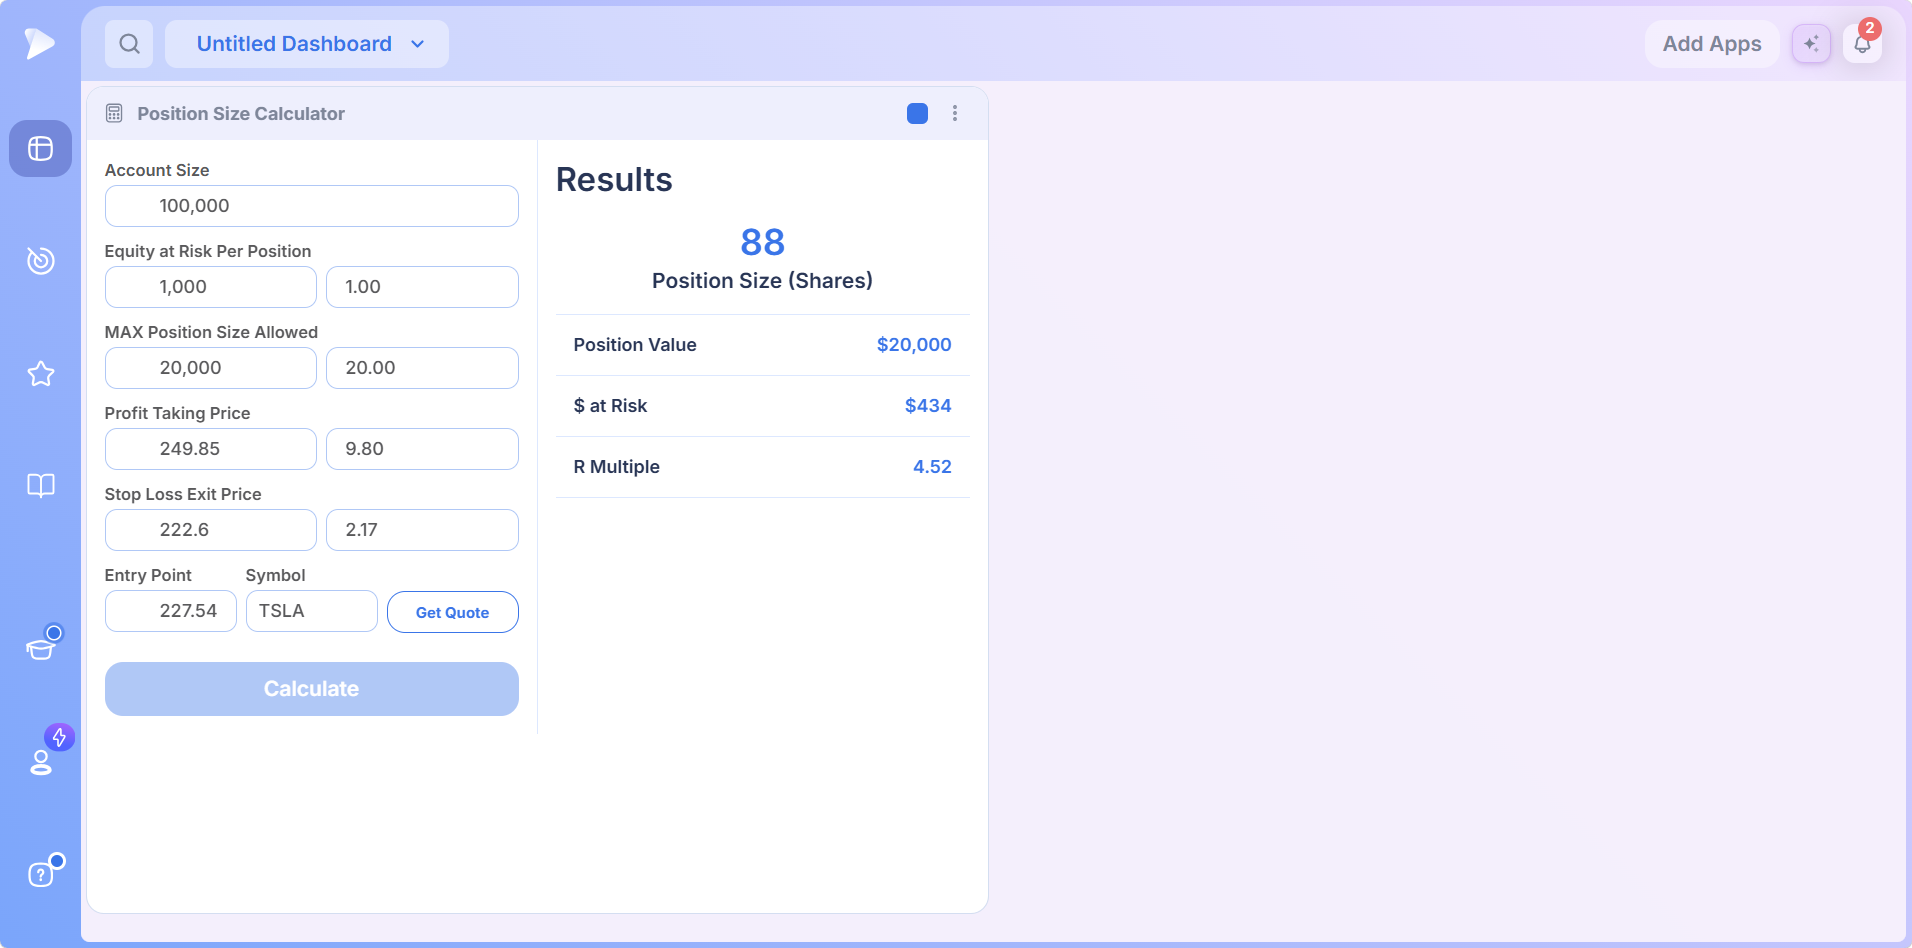
| Output | What it tells you |
|---|---|
| Position Size (Shares) | How many shares to buy |
| Position Value | What the position costs at the entry price |
| $ at Risk | What you lose if the stop is hit |
| R Multiple | How many units of risk the target is worth |
When the position cap is doing its job, $ at Risk comes in below your Equity at Risk budget. That is the safe direction for the two numbers to disagree.
How the Four Numbers Are Derived
Nothing here is a black box, and any result can be checked in seconds. Take the example in the screenshots: a $100,000 account, a $1,000 risk budget, a $20,000 position cap, entry at $227.54, stop at $222.60 and target at $249.85.
Risk per share is the entry minus the stop: $227.54 minus $222.60 gives $4.94.
Uncapped position size is the budget divided by risk per share: $1,000 divided by $4.94 gives about 202 shares, worth roughly $46,000.
The cap steps in because $46,000 exceeds the $20,000 ceiling, so the position stops at 88 shares, worth about $20,000.
Dollars at risk is shares times risk per share: 88 times $4.94 gives about $434, well under the $1,000 budget rather than over it.
R multiple is reward per share divided by risk per share: $249.85 minus $227.54 is $22.31, and $22.31 divided by $4.94 gives 4.52.
That is the cap doing its job. Without it, a stop about 2 percent below the entry on a stock at that price would have committed nearly half the account to one position.
What the R Multiple Is Telling You
The R multiple compares what you stand to make against what you stand to lose, in the same unit, which makes it a clean read on the risk reward ratio. A reading of 3.00 means the target is worth three times the risk.
Nothing checks a trade idea faster, because it exposes setups where the stop is so far away that the target no longer justifies it. Under 2, most traders would want a reason to proceed. It also compares very different trades: a high priced stock with a tight stop and a low priced one with a wide stop cannot be compared on share count, but they can be compared on R.
Try the calculator on Deepvue and check the R multiple on the setup you are watching right now.
What Happens When the Position Cap Binds
This is the behavior worth understanding before you rely on the app, and the one place where the answer is not simply risk divided by risk per share.
Risk based sizing gets more aggressive as the stop tightens. Halve the distance to your stop and the share count doubles. Push the stop very close and the arithmetic can ask for a position larger than your whole account. MAX Position Size Allowed is the backstop, and when the two rules disagree, the cap wins.
WatchPosition Size Calculator tutorial: manage risk like a proDeepvue’s tutorial shows this with a 100,000 dollar account, one percent risk per position and a 40,000 dollar maximum position size:
- •A three percent stop produced 159 shares, a position value near 33,000 dollars, exactly 1,000 dollars at risk and an R multiple of 4.
- •Tightening the stop to 2.25 percent pushed the position to its 40,000 dollar ceiling. Because the cap bound before the budget was fully used, dollars at risk came out near 900, the R multiple rose to 5.33, and the share count landed just under 200.
When the cap binds, your actual risk lands under target rather than over it. That is the safe way to be wrong, but worth noticing: a run of capped positions means you are consistently risking less than your rules allow.
A third stock in the same tutorial returned 853 shares on identical stop parameters, purely because its price was lower. Nothing about the risk changed, which is precisely the work you want a calculator doing instead of your instinct.
Adding the Stock Trading Position Size Calculator to a Dashboard
Go to the Dashboard module and start a blank board, or load the one you normally work from.
Open Add Apps, the button in the dashboard’s top right corner.
Click Position Size Calculator in the Tools group. It appears on the board straight away, empty and ready for your rules.
Pick a color group with the square in the app header, so the calculator follows your chart and lists.
Link It So It Follows Your Scan
The color square assigns the calculator to a dashboard color group, the step that turns it from a utility into part of a workflow. Put a watchlist, a chart and the calculator in one group, and the entry price tracks whatever name you land on as you move through the list. Sizing stops being a separate task: you stop on something that looks ready, and the share count for that name is already on screen.
A Layout That Works
The tutorial layout puts a watchlist or screen in a column on the left, the calculator beneath it in the same column, and the chart across the rest of the board. Nothing needs scrolling, and every input you change is in view of the chart that justified it.
Start a Deepvue subscription and build that layout in about a minute.
Using It While a Setup Is Forming
Set up once, use constantly: that pattern is what earns the app a permanent dashboard slot.
Set Your Rules Once
Account size, equity at risk per position and maximum position size are rules, not decisions. Enter them when you first add the app and leave them alone. Everything after that is per trade.
Then Work Trade by Trade
Find the setup and identify where your stop belongs on the chart, usually a level rather than a round percentage, such as beneath the low of the day or under a base.
Measure the distance from your intended entry to that level. The tutorial does this on the chart itself, shift clicking and measuring down to the low to read the percentage directly.
Enter that figure in the Stop Loss Exit Price row, as a price or a percentage, whichever you measured.
Confirm the entry point, either with Get Quote or by typing the level you intend to buy at.
Press Calculate and read the share count. Check the R multiple before you act.
The whole loop takes seconds once the rules are in place, and that speed is the point. A sizing process that takes two minutes gets skipped when a stock is moving. One that takes ten seconds does not.
Why the Stop Should Come From the Chart
A round number for the stop is tempting because it is easier. The tutorial deliberately does the opposite, replacing a default three percent with a measured 2.25 percent taken from an actual level on thechart. The share count changed as a result, and the R multiple rose from 4 to 5.33 purely because the stop moved closer. A stop placed where the chart says the idea is wrong gives better risk control and often a better risk reward ratio too.
Choosing Your Risk Per Trade
The stock market position size calculator applies whatever figure you give it, so that figure is the decision that matters most. Deepvue’s tutorial suggests newer traders generally do well starting around half a percent per position, with more experienced traders working roughly three quarters of a percent to one percent.
That is a starting frame, not a recommendation, and the right number depends on your strategy, your win rate and how many positions you hold at once. None of it is financial advice. What the app does deliver is consistency: every position sized through it carries the same risk, which removes a very common failure, going large on a stock you feel good about and small on one you do not.
What Makes the Deepvue Position Size Calculator Different
Free calculators are everywhere and the arithmetic inside them is identical, so the case for a stock position size calculator built into your platform comes down to friction and context, the two things that decide whether position sizing actually happens:
- ✓Right next to the chart, so there is no tab switching at the moment you are trying to act, which is when sizing usually gets abandoned.
- ✓It follows your scan. Linked to a chart and watchlist, the entry price updates as you move through names.
- ✓The current price is one click away through the Symbol field and Get Quote.
- ✓Dollars or percentages, row by row, so each input goes in the unit you actually think in.
- ✓A position cap built in, so risk based sizing cannot quietly produce an oversized holding.
- ✓The R multiple included, so the reward to risk check happens automatically.
A calculator is one piece of a platform decision. Weigh the whole package in the Deepvue comparisons hub, which breaks down each matchup with MarketSurge, TradingView, TC2000, TrendSpider and Finviz feature by feature.
What Traders Say About Deepvue
Independent reviews of the wider platform, quoted as published.
“I was very impressed by the flexibility of DeepVue’s screen creator.”
Dave of Day Trade Review, who scored Deepvue 4.7. Read the review
“I believe DeepVue is purpose built for swing or position trading.”
Shared by u/DLightman1983 on r/swingtrading. Join the discussion
“It’s powerful, simple, and SUPER clean/easy to navigate.”
From a verified G2 reviewer in the financial services industry. See it on G2
“Deepvue is the most economical and impressive trading platform I have used.”
Left as an App Store review in November 2024. Go to the listing
Across the Deepvue reviews wall, more than 220 verified reviews give the platform a 4.8 average, and 97 percent of reviewers say they would recommend it.
Where the Calculator Fits in Your Workflow
Sizing is the last step before a trade. These tools produce the candidates it sizes.
- •The screener for building the candidate list, with formation based scans in the screener by pattern category and each prebuilt strategy collected in stock screener by strategy.
- •Charts for locating the level your stop belongs at, and watchlists for holding names you are ready to act on, linked through a color group.
- •Industry Ranks plus Stage Analysis to check the group behind a trade before committing size to it.
- •The AI Terminal for understanding a move you are about to trade, and the Ultimate Screening Guide for assembling the lists that eventually arrive here.
- •The Stats Table, also in the Tools group, for checking earnings and sales growth before you size a position.
Module by module reference is in the Deepvue Knowledge Base.
What the Position Size Calculator Costs
The Position Size Calculator comes with Deepvue’s single plan at $49 per month, with monthly and annual options. Dashboard apps are never sold one by one, and there is no premium tier.
That one plan covers:
- •The screener and its 1,152 data points.
- •Charts, watchlists, and alerts, all of them unrestricted.
- •Fully customizable dashboards, with every app in the catalog.
- •The Theme Tracker, Market Brief, and AI Terminal, the last with unbounded usage.
Deepvue has one plan, so there are no tiers to compare. For reference, MarketSurge, the legacy platform in this niche, runs $149 per month.
New subscribers also get a one on one onboarding session with a Deepvue team member, an onboarding email series covering platform features and use cases, and weekly live webinars that each go deep on one part of the platform.
Size Every Trade the Same Way
The difference between traders who survive volatility and traders who do not is rarely idea quality. One group risks a consistent amount on every position and the other guesses. A stock position size calculator next to the chart removes the excuse, because the number takes seconds to produce and the arithmetic is right there to check.
Create a Deepvue account and let the share count follow your rules instead of your mood.
↑ Back to contentsFrequently Asked Questions
The questions worth answering before you rely on it.
What is a position size calculator?
A position size calculator is a tool that converts a risk rule into a share count. You set how much you are willing to lose and where your stop is, and it works out how many shares keep the loss at that amount. Deepvue’s version runs next to your chart and also returns position value, dollars at risk and the R multiple.
How do you calculate position size for stocks?
You calculate position size for stocks by dividing your risk budget by your risk per share, which is the entry price minus the stop price. Risking $500 with a stop $2 below entry gives 250 shares. The Deepvue calculator applies the same formula, then checks it against your maximum position size.
How many shares should I buy?
How many shares you should buy depends on your risk budget and the distance to your stop, not on how confident you feel. The Deepvue Position Size Calculator, a share size calculator at heart, divides one by the other, applies your position cap and returns the share count in large type at the top of its Results panel.
What is the 1% risk rule?
The 1% risk rule means risking no more than one percent of your account on any single trade, so a losing streak stays survivable. On a $100,000 account that is $1,000 of risk per position. In Deepvue you set it once in the Equity at Risk field, and every trade is sized to that loss.
How much of my account should I risk per trade?
How much of your account to risk per trade depends on your strategy, win rate and number of open positions. Deepvue’s tutorial suggests around half a percent for newer traders and roughly three quarters of a percent to one percent for experienced ones. That is general guidance, not financial advice.
What is a good risk reward ratio?
A good risk reward ratio for most trend and swing traders is a target worth at least twice what the stop risks, an R multiple of 2.00 or higher. The Deepvue Position Size Calculator prints the R multiple automatically, so you see whether a setup clears your own threshold before committing.
Why does a tighter stop mean a bigger position?
A tighter stop means a bigger position because position size is your risk budget divided by the distance to your stop. Halve the distance and the same budget buys twice the shares at the same risk, which is why the Deepvue calculator pairs risk based sizing with a maximum position size.
Should I size positions based on volatility?
Yes, you should size positions based on volatility, and sizing from the stop does it for you. A volatile stock needs a wider stop, and a wider stop means fewer shares for the same dollar risk. Because Deepvue sizes from the stop distance, volatility feeds into the share count without a separate setting.
What is the MAX Position Size Allowed field for?
The MAX Position Size Allowed field is for capping how large any single position can become. Risk based sizing has no natural ceiling, so a very tight stop can justify an outsized position. When the cap binds in Deepvue, the position stops at the ceiling and dollars at risk come in under budget.
Why is my $ at Risk lower than my risk budget?
Your $ at Risk is lower than your risk budget because the position cap bound first. The Deepvue calculator stopped the position at your MAX Position Size Allowed before the full budget was used, so the loss at your stop is smaller than your rule permits. Loosen the cap only if you are comfortable with a larger position.
What does the R Multiple output mean?
The R Multiple output means reward per share divided by risk per share. A reading of 3.00 means the profit target is worth three times what the stop risks. In Deepvue it is the fastest way to judge whether a trade is worth taking and to compare setups with very different prices.
What is the difference between position size and position value?
The difference between position size and position value is shares versus dollars. Position size is how many shares to buy; position value is what those shares cost at the entry price. The Deepvue calculator shows both beside the dollars actually at risk, since the three can move independently.
Does the profit target change my share count?
No, the profit target does not change your share count. In the Deepvue calculator, share count comes entirely from the entry, the stop, your risk budget and the position cap. The target only moves the R multiple, so you can adjust it freely to test a setup.
Can I enter percentages instead of dollar amounts?
Yes, you can enter percentages instead of dollar amounts in four rows of the Deepvue calculator. Equity at Risk and MAX Position Size take percentages of your account; Profit Taking Price and Stop Loss Exit Price take percentages of the entry price. Type either box and the other matches.
Can the calculator pull in a live price?
Yes, the calculator can pull in a live price. Type a symbol into the field next to the Entry Point and Deepvue’s Get Quote button, grayed out until a symbol is entered, fills the entry with the current price so the figure you size against stays fresh.
What do I need to enter before the calculator shows results?
You need to enter account size, equity at risk, maximum position size, a profit target, a stop and an entry before the calculator shows results. Until the inputs are complete, the Deepvue Results panel simply asks for values; press Calculate once they are in.
Can the calculator follow the stock I am looking at?
Yes, the calculator can follow the stock you are looking at. Give the Deepvue calculator, a chart and a watchlist the same color group using the square in each app header, and the entry price tracks whichever name you land on as you scan.
Where do I find the Position Size Calculator in Deepvue?
You find the Position Size Calculator, Deepvue’s stock trading position size calculator, in the Add Apps menu, under Tools. One click adds it to any dashboard, and the color group square in its header links it to your chart and lists.
Does it account for commissions or slippage?
No, it does not account for commissions or slippage. The Deepvue calculator has no input for either, so the dollars at risk figure is clean arithmetic before costs. It also assumes your stop fills at the price you set, which a gap through the level can prevent.
Is the Position Size Calculator included in the standard Deepvue plan?
Yes, the Position Size Calculator is included in the standard Deepvue plan. Deepvue has a single plan at $49 per month that covers the calculator along with the screener, charts, watchlists, alerts, dashboards, the Theme Tracker, the Market Brief, and the AI Terminal.
CAN SLIM® is a registered trademark of O’Neil Capital Management, Inc. (U.S. Reg. No. 3,081,940). Deepvue is not affiliated with, sponsored by, endorsed by, or licensed by O’Neil Capital Management, Inc., Investor’s Business Daily, MarketSurge, or their affiliates. Any reference to CAN SLIM® is for descriptive purposes only. Deepvue’s scores, ratings, and screeners are independently calculated by Deepvue and are not the proprietary ratings of MarketSurge or IBD.