Deepvue Screener: The Stock Market Screener With 169 Presets and a Chart Beside Every Row
The Deepvue screener filters US listings across 1,152 data points, 568 of them live over WebSocket, and returns results with a chart, a volume panel, eight quarters of earnings and a data panel beside every row.
A picker in the header holds your saved screens alongside 169 preset screens in nine categories. Every preset loads in one click, and any row can be tagged, saved to a watchlist or turned into an alert without leaving the table.
and every preset on this page is one click away.
The Deepvue stock market screener, in numbers:
Key Takeaways
A screener is only as good as three things: what it can filter on, how fast results arrive, and what you can do with a result once you have one.
Most are strong on one, adequate on another and weak on the third. It is almost always the third, because the result list is a dead end and the chart is somewhere else.
This stock market trading screener was built by traders who run screens every morning, and it shows in exactly that place. A result is a row with a chart, volume, the last eight quarters and a panel of fundamentals already open beside it, and the spacebar moves all of them together.
- ✓169 preset screens in nine categories, with Top Traders the deepest, organized trader by trader.
- ✓1,152 data points to filter on, with 568 streaming live, so result counts and column values move during the session.
- ✓A chart beside every row, with Enhanced Volume, a stats table and a data panel, all advancing together on the spacebar.
- ✓Rows are actionable. Open the row menu to color tag a result, add it to a watchlist, create an alert or copy the symbol.
- ✓Saved screens file into folders, carry a column set that loads with them, and can be combined into combos.
- ✓Included in the one plan. Get started with Deepvue here.
Screener at a Glance
- Data points
- 1,152 across the library, 568 of them streaming live over WebSocket
- Preset library
- 169 screens across nine categories, read only until duplicated
- Saved screens
- Your own work, organized in folders, with combos and per screen column sets
- Result table
- Checkbox, logo, ticker and your chosen column set, with sortable headers
- Column library
- Ten categories, searchable, with display toggles and drag to reorder
- Row actions
- Color tags, Add to watchlist, Add alert, Copy and Narrow Rows
- Side panel
- Four tabs: Data, Terminal, Alerts and News
- Layouts
- Table, chart layout, and a mini chart grid
- Where to find it
- Second icon in the sidebar, and Screener in the Core group of the app catalog
- Cost
- Covered by the standard plan, with no screener tier
What Is the Deepvue Stock Market Screener?
It is the stock trading screener at the center of the platform: the module where you choose or build a screen, read the names it returns and judge each one without leaving the page. It has its own icon in the left sidebar and a Screener entry among the Core apps, so a screen can run beside anything else on a customizable dashboard.
Each capture here was taken during a live session, so whatever it shows is what that screen returned at that moment. Read them for how the module behaves, not for the names in them.
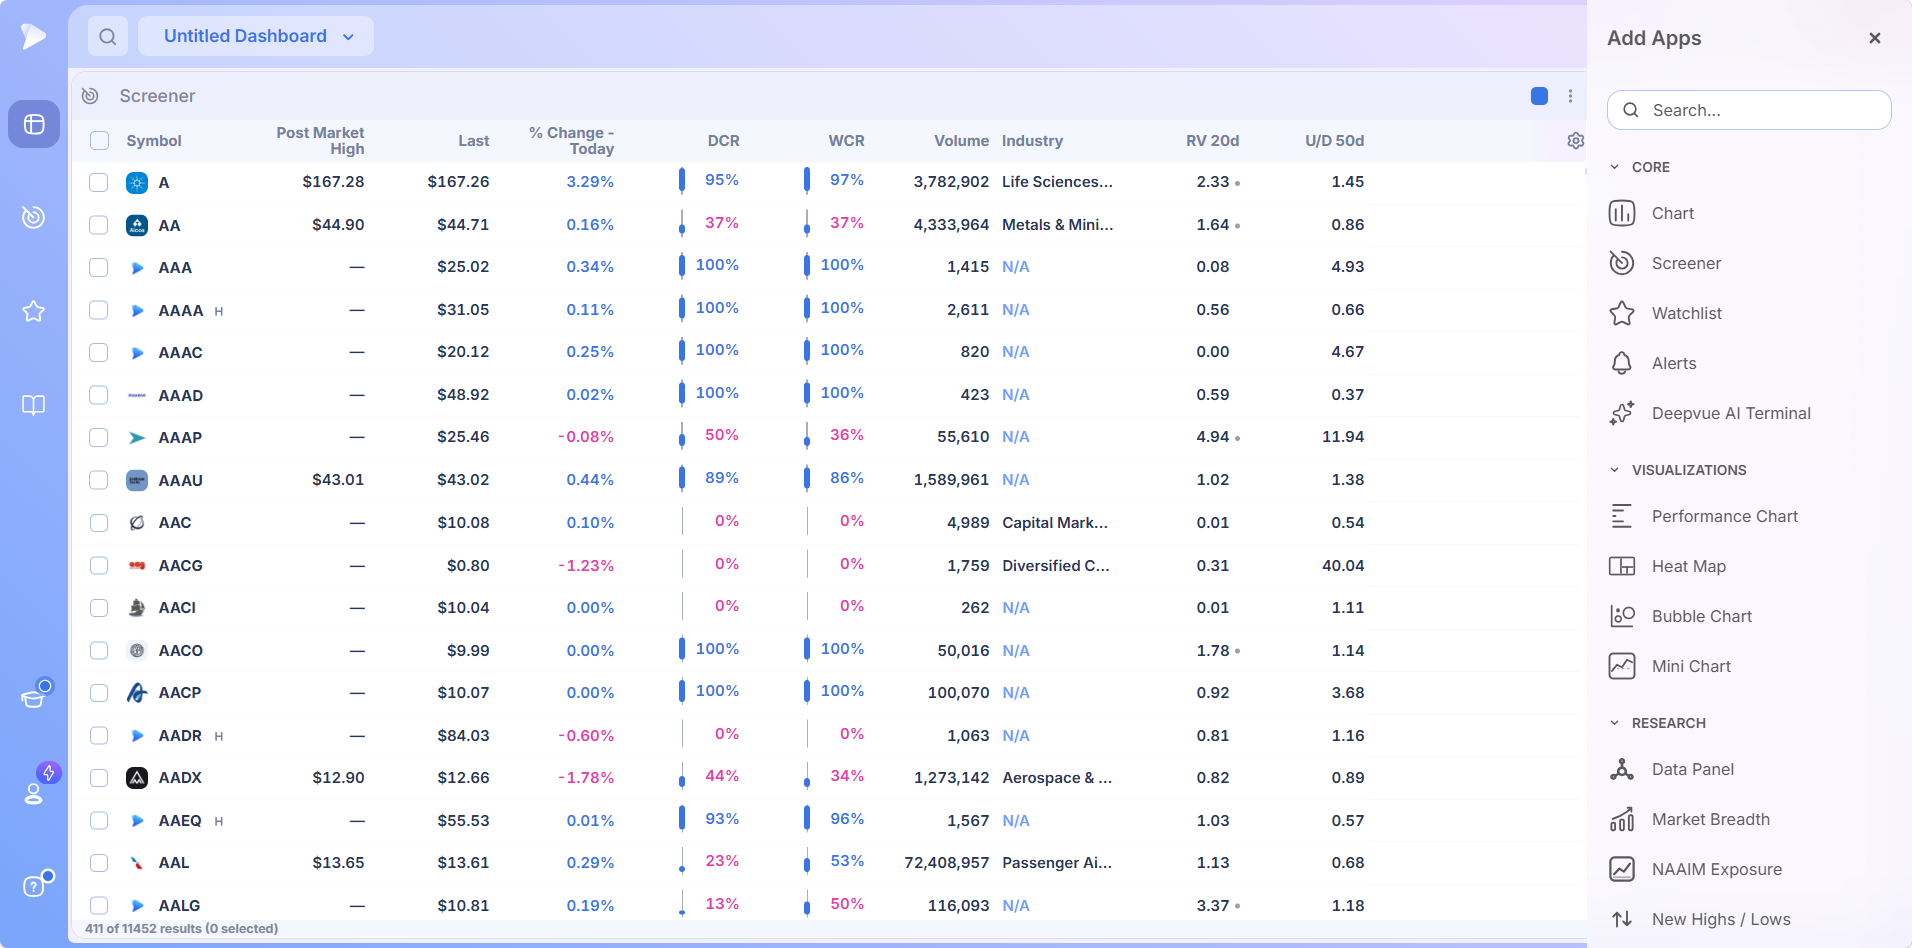
The header holds the controls: a pill naming the loaded screen that opens the picker, a filter icon badged with how many filters the screen applies, and the column set and layout controls. The settings gear at the right edge of the header row opens Column Settings.
Who the Screener Is For
Traders who start from criteria rather than headlines, holding for weeks and months instead of trading the session.
- ✓CANSLIM® traders, for whom the Deepvue and Fundamental categories were written.
- ✓Breakout traders running the leaders and volume screens each morning.
- ✓Swing traders working the Technical category for pullbacks and tightness.
- ✓Traders combining chart work with the numbers who want both sides in one filter set.
- ✓Anyone who learns by running other people’s routines, since the Top Traders category is exactly that.
A routine for every style is collected under Deepvue for.
The Picker: Saved Screens and Screener Presets
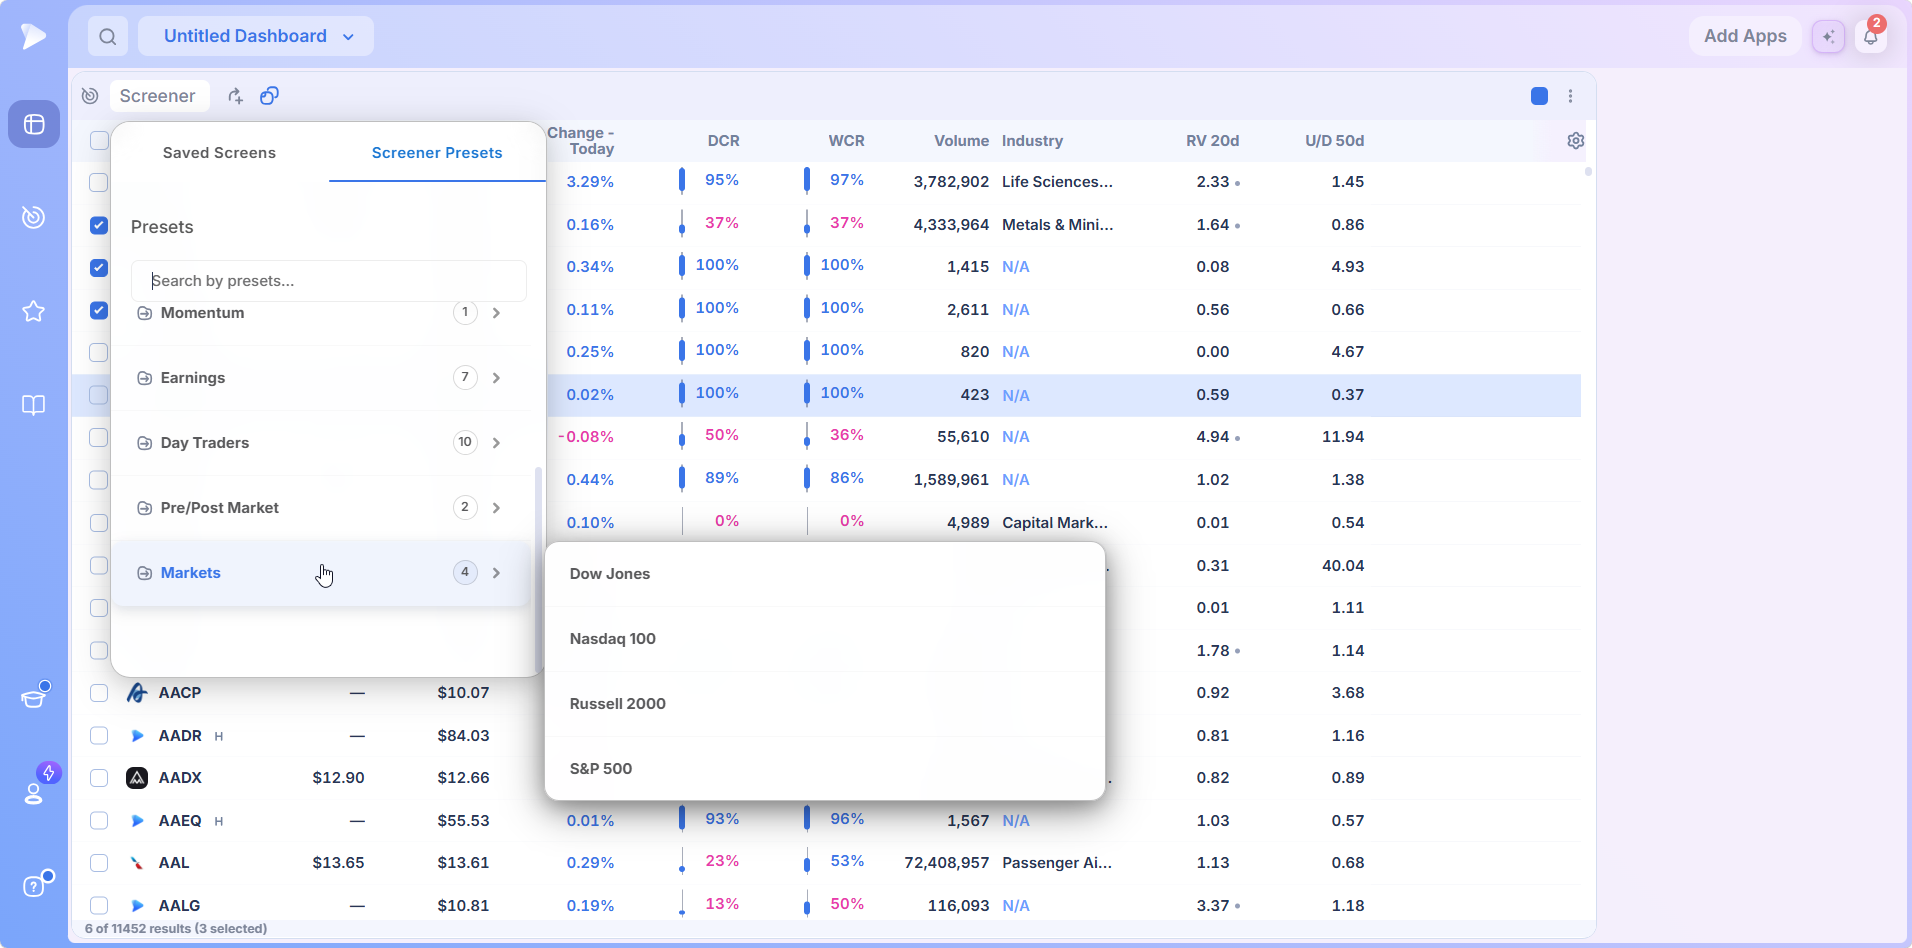
Click the screen name and a picker opens with two tabs. Screener Presets holds the Deepvue screener presets library, with a search field and nine categories, each carrying a count. Saved Screens holds your own work. Hover a category and its screens open in a second column, several with an information icon explaining what the screen looks for. Every one of the stock market screener presets is read only until you duplicate it.
| Category | What it holds |
|---|---|
| Deepvue | The house screens, from CANSLIM® Type RS, Character Change and Deepvue Leaders to the highest volume screens and Liquid Leaders |
| Top Traders | Routines from professional traders, filed by trader, each under the trader’s own name |
| Technical | Setup and chart action screens: pullbacks, tightness, gaps, outside days and new highs |
| Fundamental | Accelerating earnings and sales, estimate revisions, surprises, and a CANSLIM® screen |
| Momentum | Float Squeeze |
| Earnings | Reporting dates and what follows them |
| Day Traders | Gap, volume and range screens that also surface the session’s strongest movers |
| Pre/Post Market | Premarket movers and gap ups, and post market movers |
| Markets | The Dow Jones, Nasdaq 100, Russell 2000 and S&P 500 as universes |
Deepvue
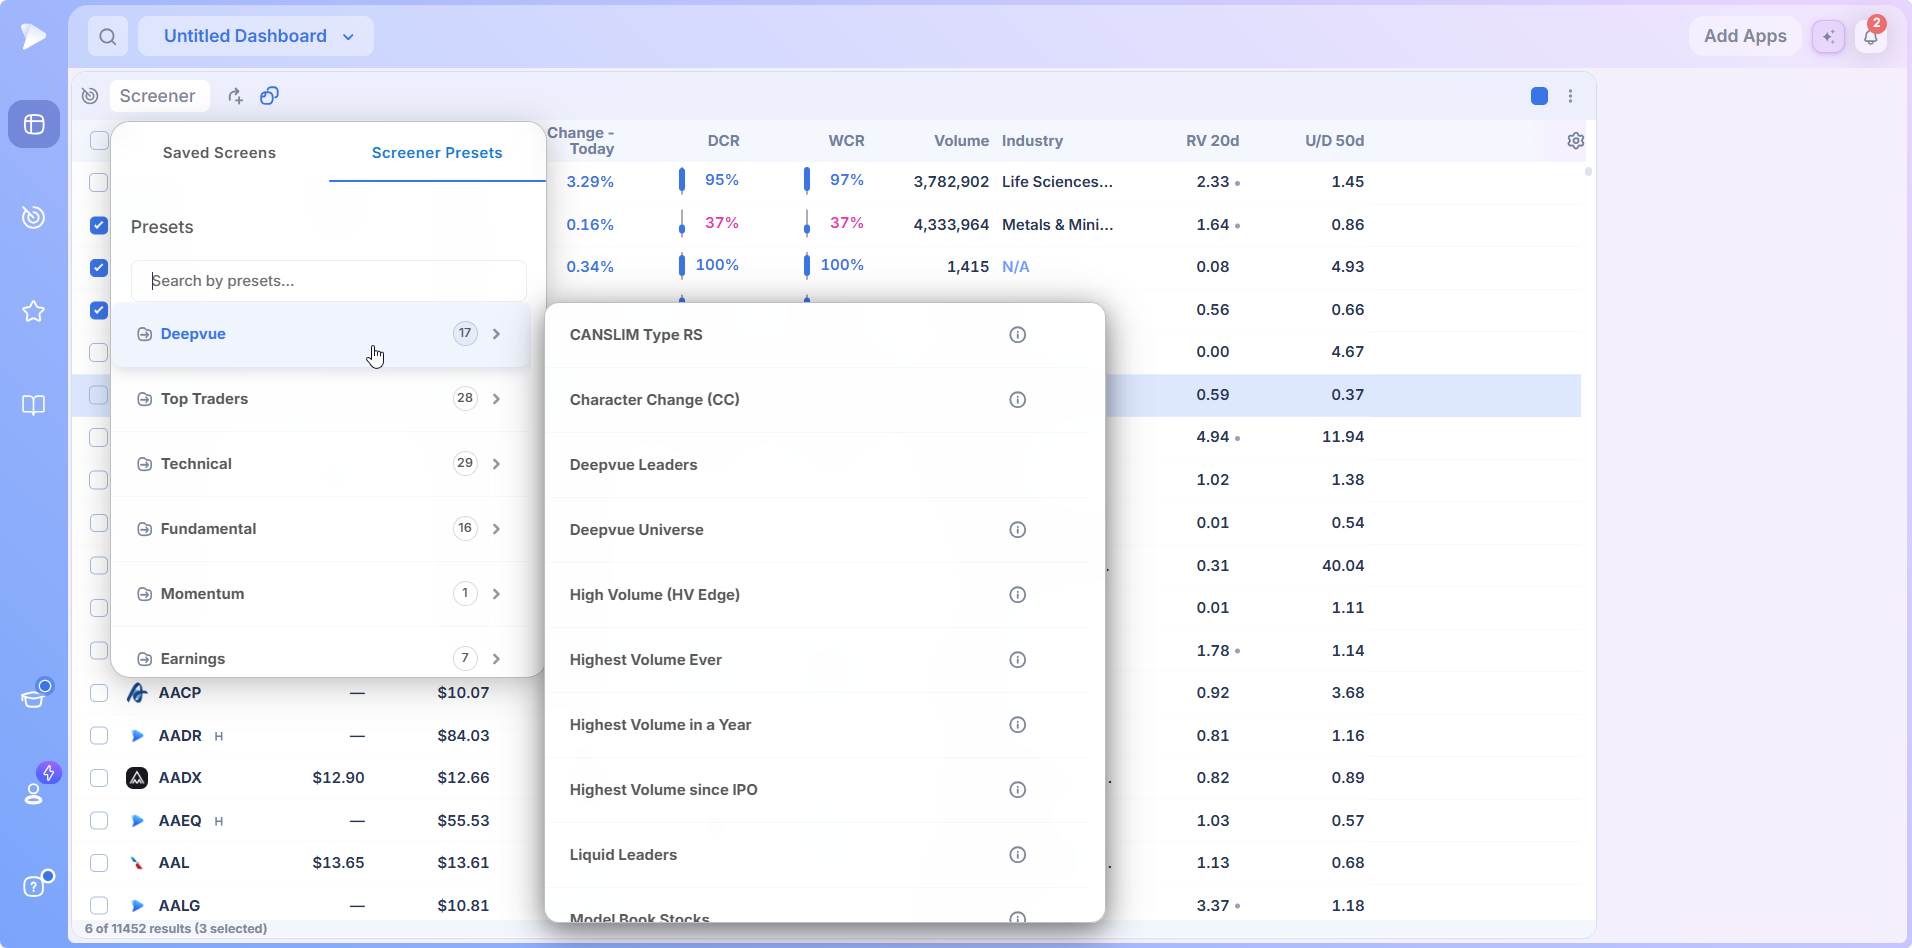
The house screens are the platform’s methodology expressed as filters. CANSLIM® Type RS applies the relative strength side of the method, Character Change flags a shift in how a stock trades, Deepvue Leaders is the team’s go to universe of strong names, and Deepvue Universe is the broad liquid universe several dashboard apps default to.
HV Edge and the highest volume screens, from the highest volume in a year to the highest since the IPO or ever, find volume events. Liquid Leaders and Model Book Stocks isolate leadership and the characteristics of historical winners. Start here for the platform’s opinion of what matters; the Deepvue screener presets are the foundation the rest build outward from.
Top Traders
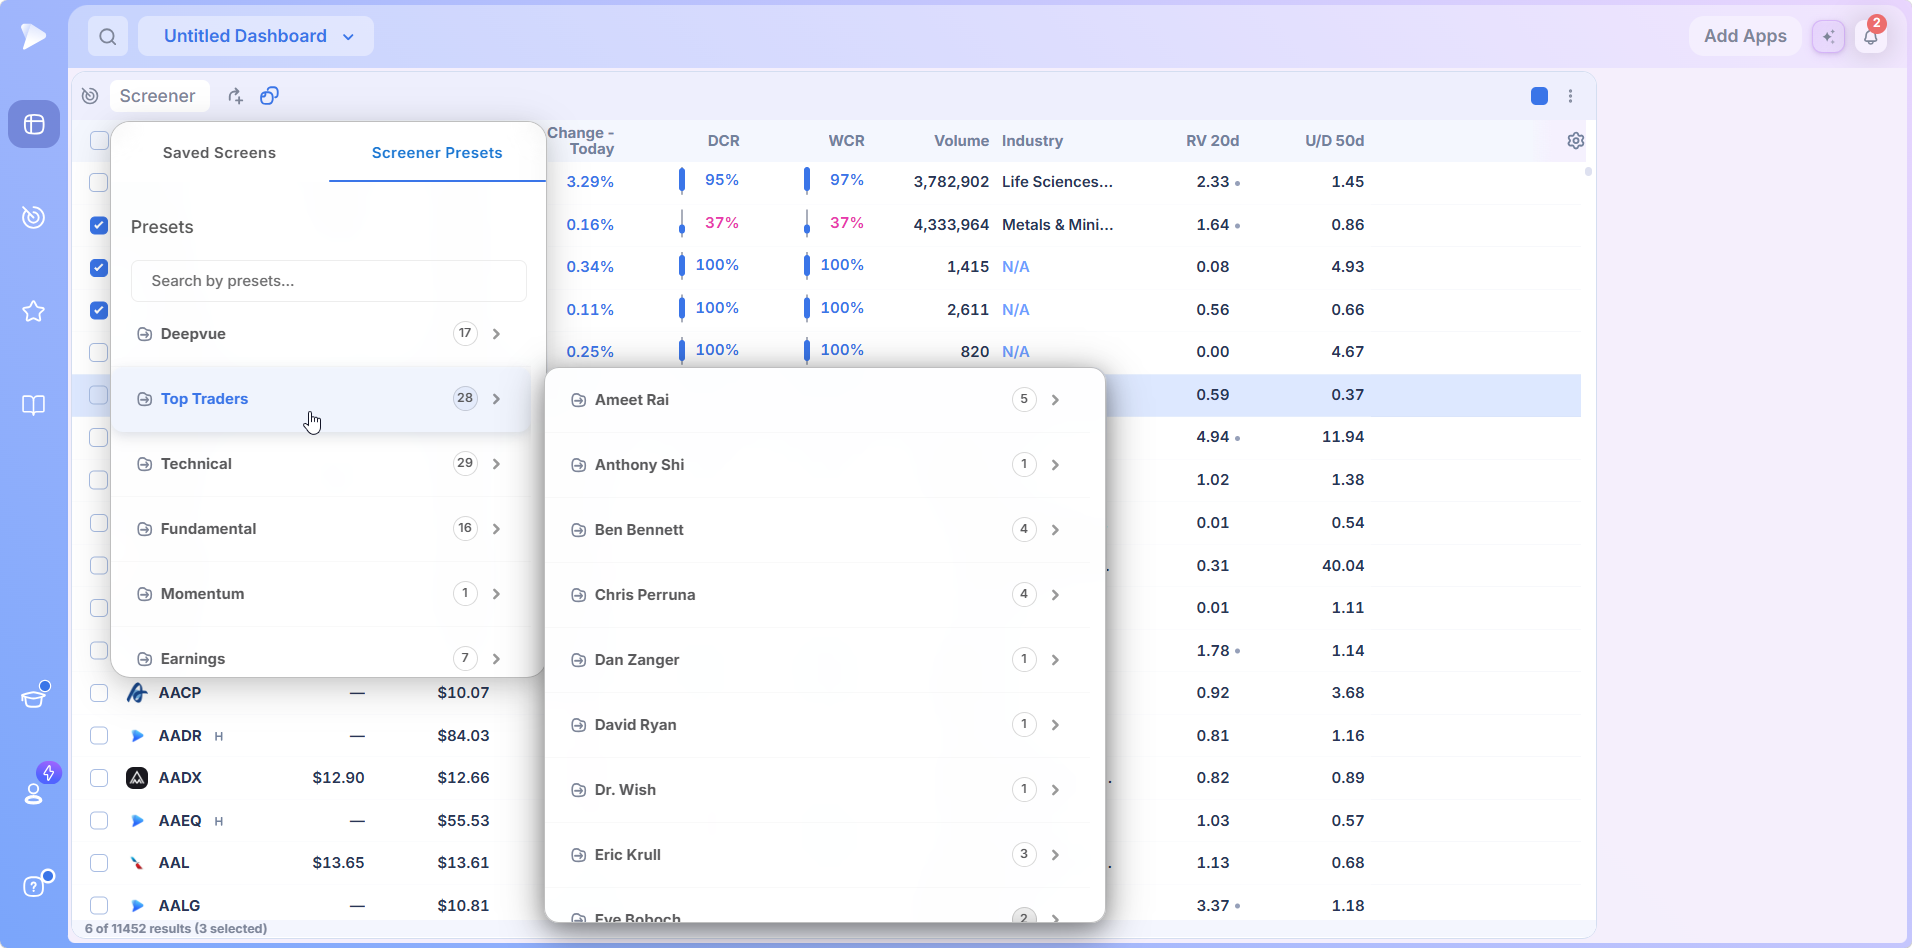
The deepest category, now filed trader by trader, with a count beside each name showing how many screens they contribute. Ameet Rai’s include corrections, daily liquidity, high tight flags and recent IPOs. Ben Bennett contributes a Down Day RS screen, a Focus List, a Power Screen and a Velocity Screen.
Anthony Shi, Chris Perruna, Dan Zanger, David Ryan, Dr. Wish and Eric Krull are among the names, alongside the screens from Oliver Kell, Mike Webster and Mark Minervini the platform is known for. Loading one is the quickest way to trade a routine you have read about, using the exact filters its author uses.
Technical
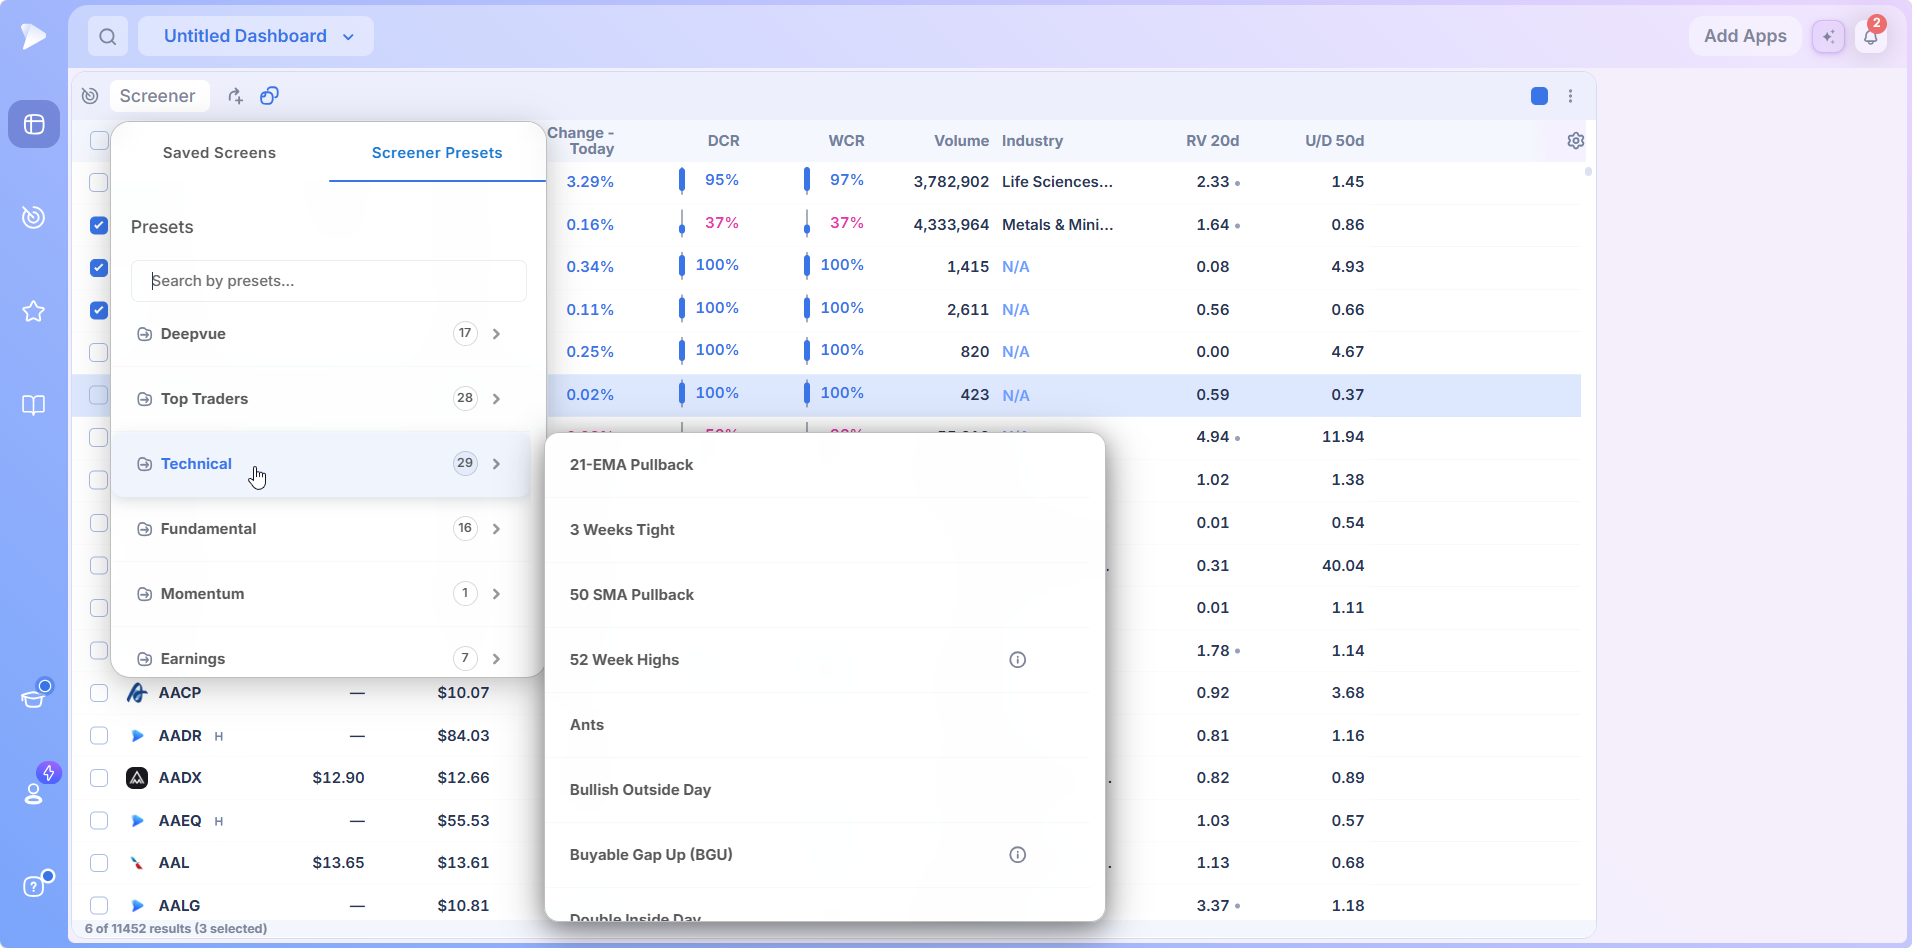
The Technical screens cover chart action: pullbacks to the 21 EMA and 50 day SMA, tightness in 3 Weeks Tight and Double Inside Day, strength in 52 Week Highs, Bullish Outside Day and Buyable Gap Up, and multi timeframe alignment. These are the screens most swing traders run daily, and the screener by pattern and screener by indicator pages walk through the logic behind several.
Fundamental and Momentum
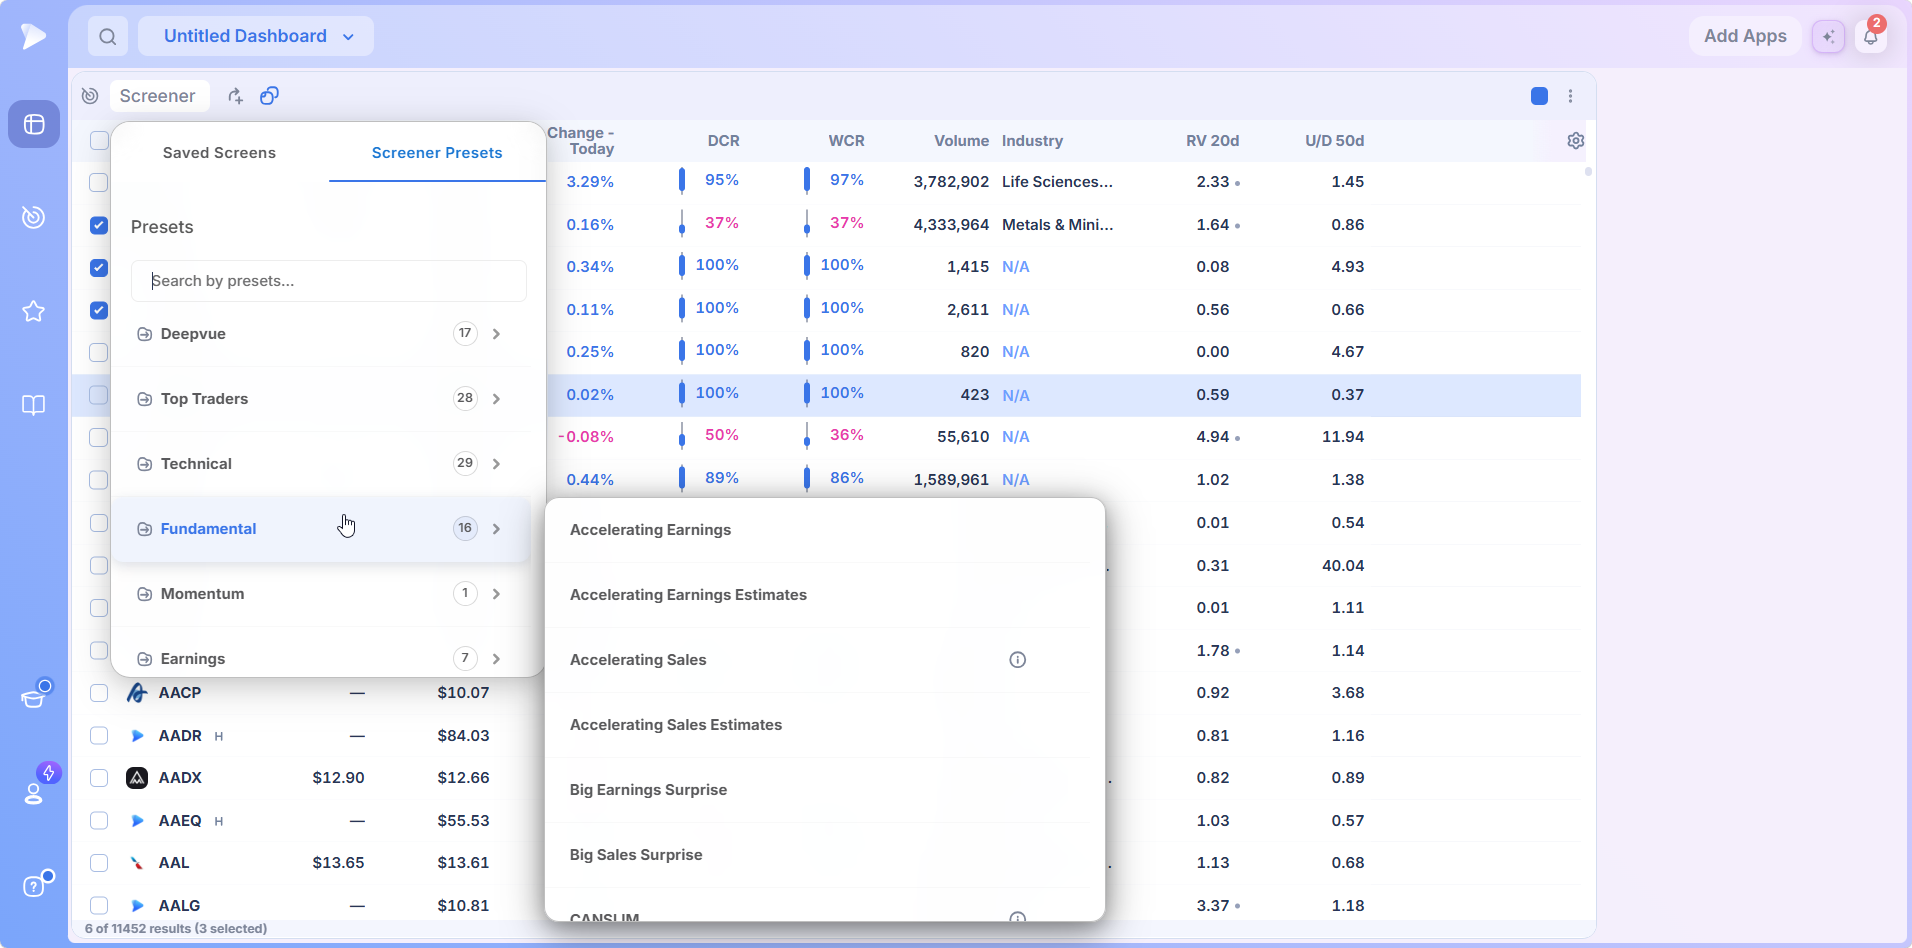
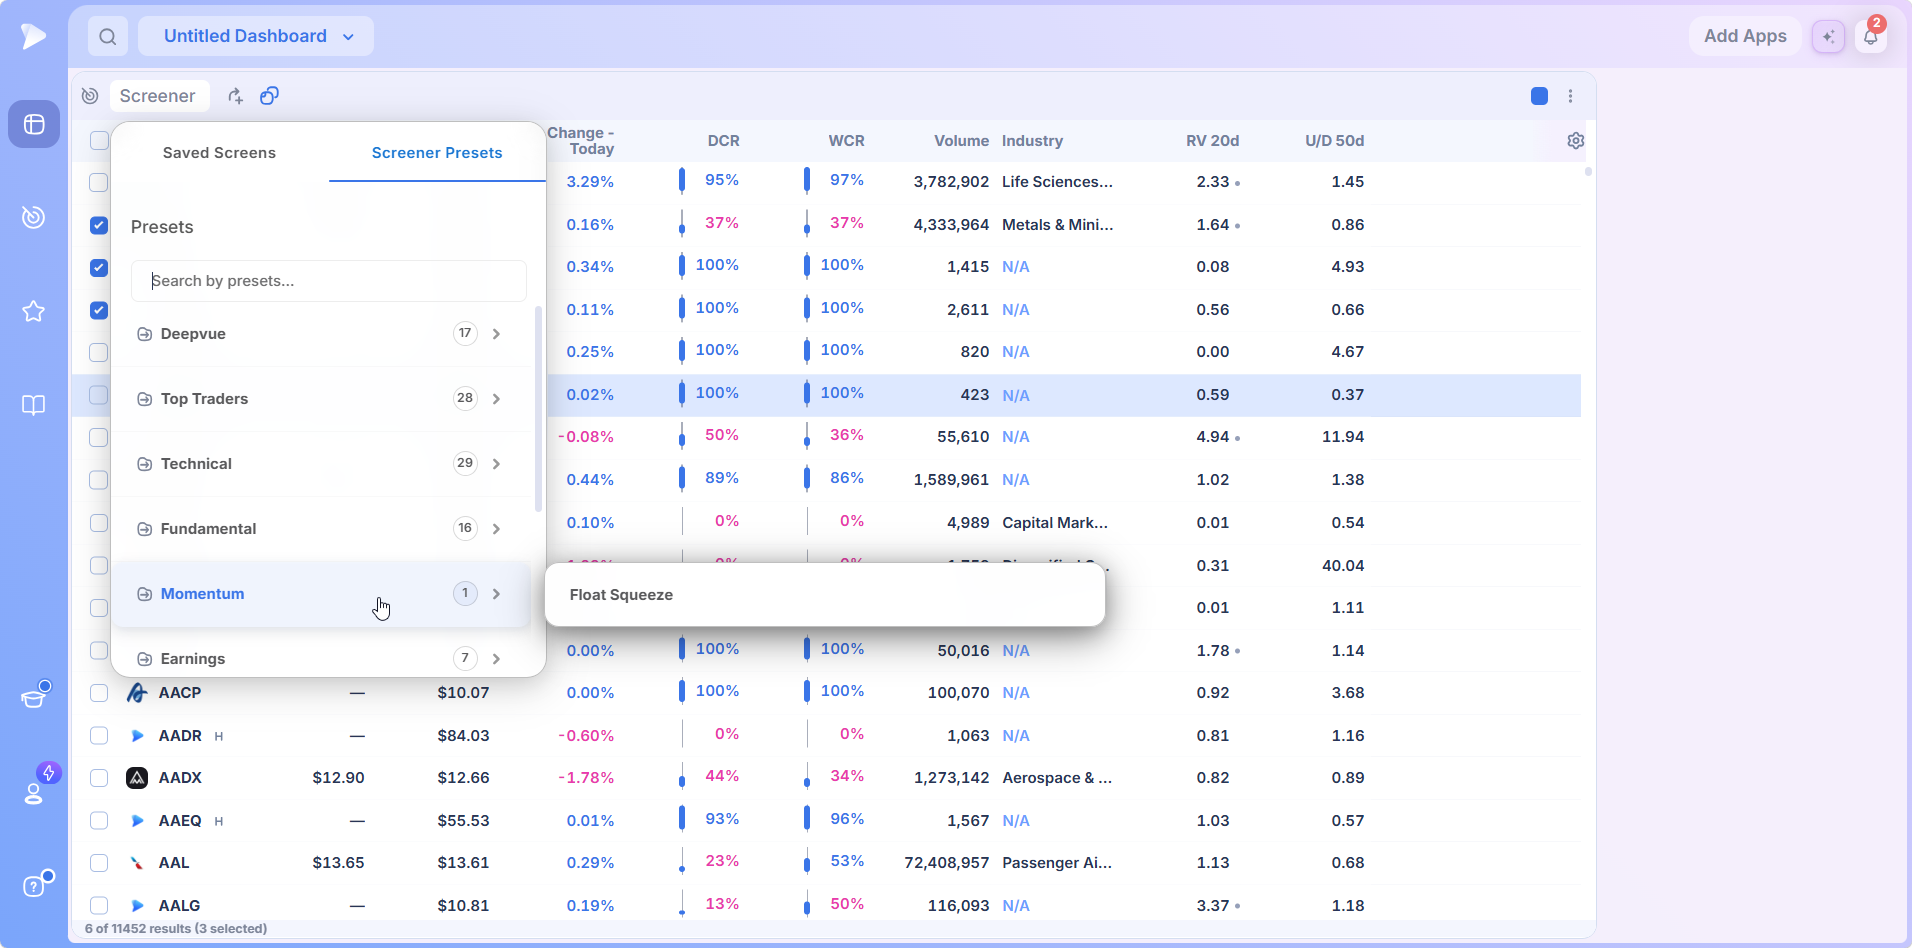
Fundamental holds the growth screens: Accelerating Earnings and Accelerating Sales, the matching estimate screens, Big Earnings Surprise and Big Sales Surprise, and a CANSLIM® screen. Momentum holds one, Float Squeeze.
Earnings
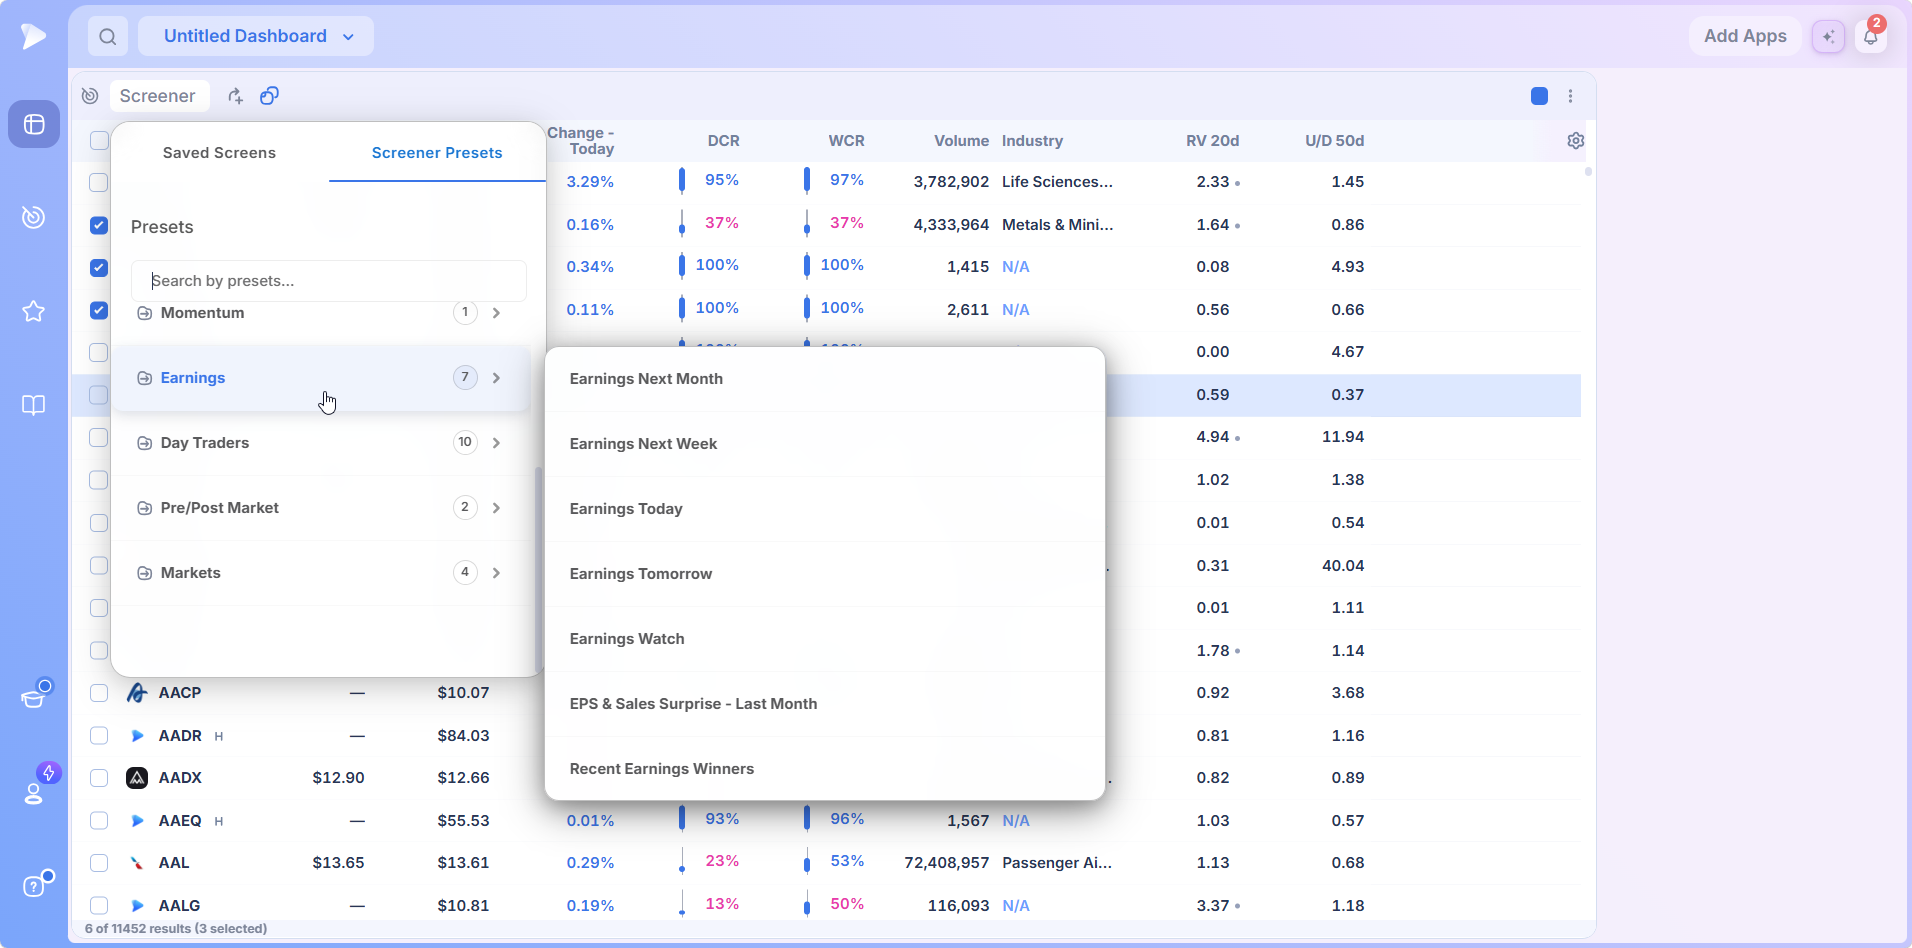
Earnings screens are keyed to reporting dates, so the names reporting today, tomorrow, next week and next month are one click away, alongside Earnings Watch, Recent Earnings Winners and an EPS and sales surprise screen for the last month. Run Earnings Tomorrow every afternoon and you will never hold through a report you did not know was coming.
Day Traders, Pre/Post Market and Markets
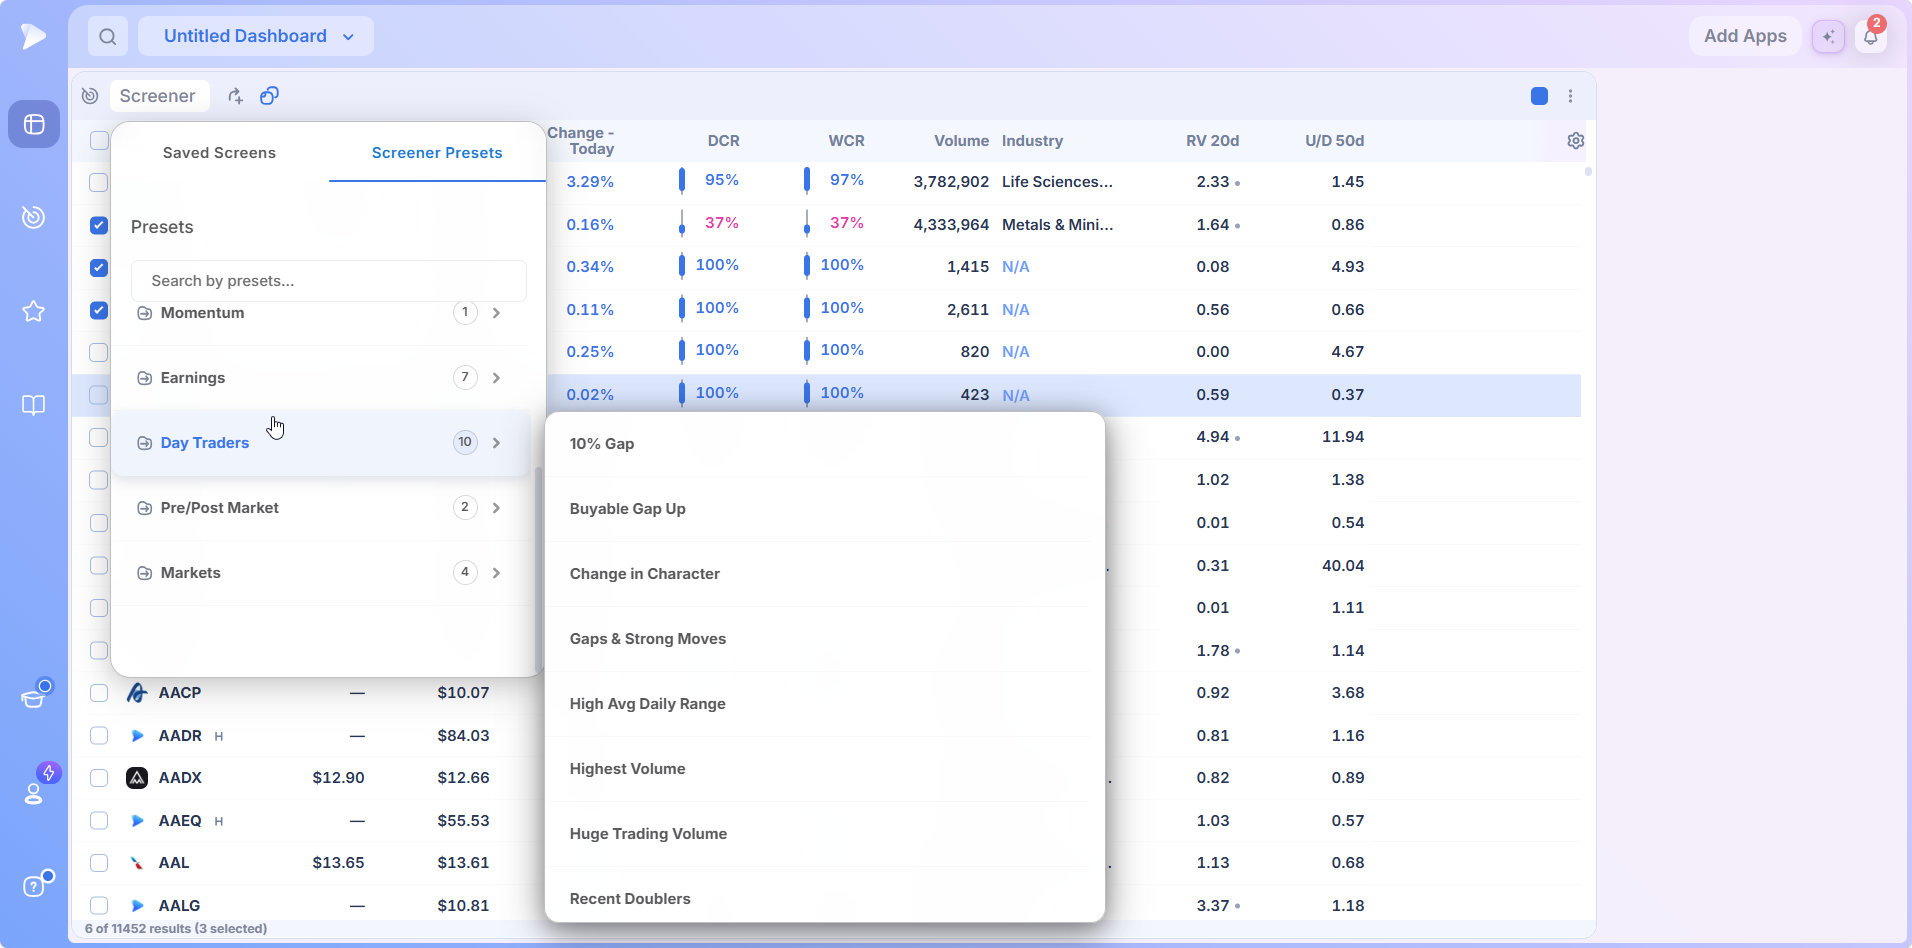
Day Traders holds gap and activity screens such as 10% Gap, Buyable Gap Up, Gaps & Strong Moves, Highest Volume, Huge Trading Volume and Recent Doublers. The platform is not built around intraday trading, but these are exactly the participation filters a momentum or swing trader uses to spot the session’s strongest names.
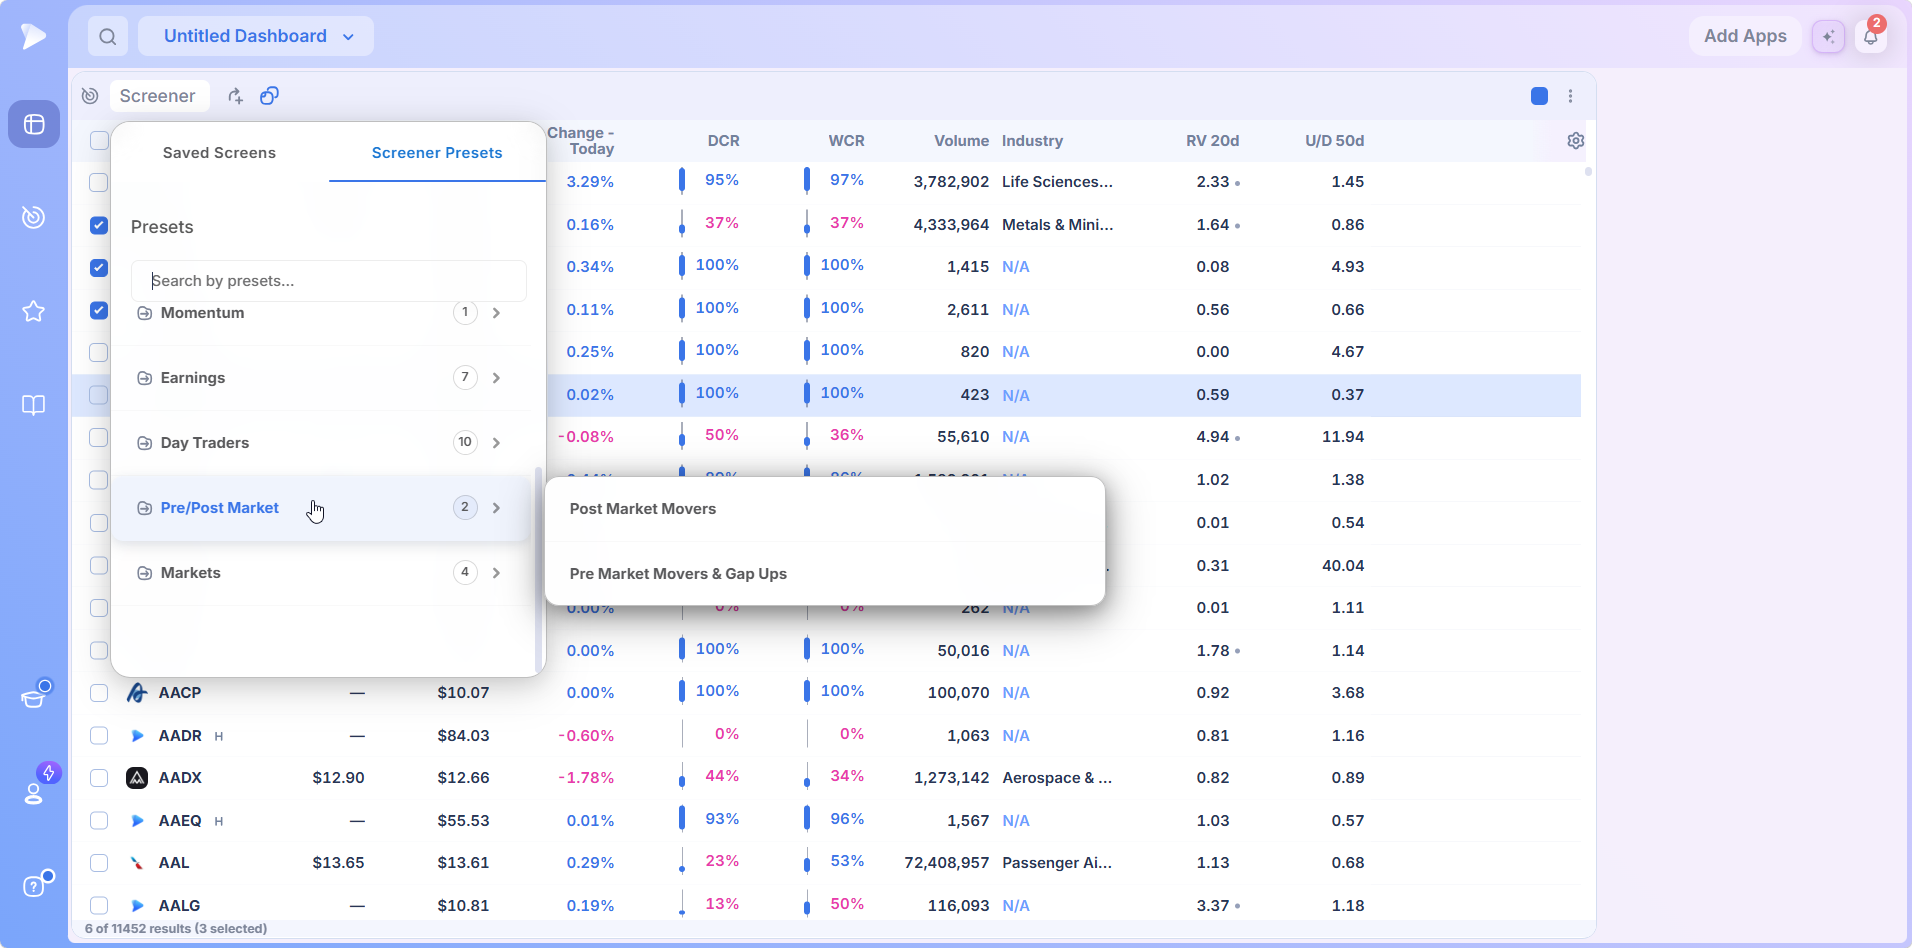
Pre/Post Market holds two screens for the sessions either side of the bell, covered on the screener by market timing pages. Markets turns the four major indexes into universes, so any column set can be read against a benchmark’s constituents.
Try Deepvue and load a Top Traders routine on your first screen.
Saved Screens, Folders and Custom Screens
The Saved Screens tab is home to Deepvue custom screeners. Every custom stock screener you build is filed here, whether it started from scratch or from a preset. Creating one opens a compact dialog: name it, pick a folder, choose the column set it loads with, and write a description for your future self.
The column set is the detail worth pausing on. A volume events screen opens with volume columns, a fundamentals screen with growth columns, so the table is right for the question the moment it loads. Deepvue custom screeners can also be joined into combos.
An independent review, linked below, describes the screen creator as offering OR logic between conditions, value ranges as well as greater and less than tests, and adjustable timeframes on most parameters. Those observations are the reviewer’s; the confirmed platform figure is 1,152 data points across the library.
Duplicating a Preset to Make It Yours
Presets are read only. Load one and you can see every filter it applies, but the controls for adding are grayed out, so the preset stays as its author wrote it for everyone who loads it.
Use the three dot menu beside the screen in the presets list and choose Duplicate.
Name the copy and file it in a folder. Deepvue’s tutorial keeps one just for preset duplicates.
Save it. The copy lands in Saved Screens with every option live.
Add your criterion. The tutorial adds price above the 50 day moving average to an inside days screen, saves, and the list reruns with only the names meeting both conditions.
That two minute sequence is how most custom stock screener work starts: a preset that is nearly right, one filter that makes it yours, and a folder keeping originals and variants apart.
Configuring Columns
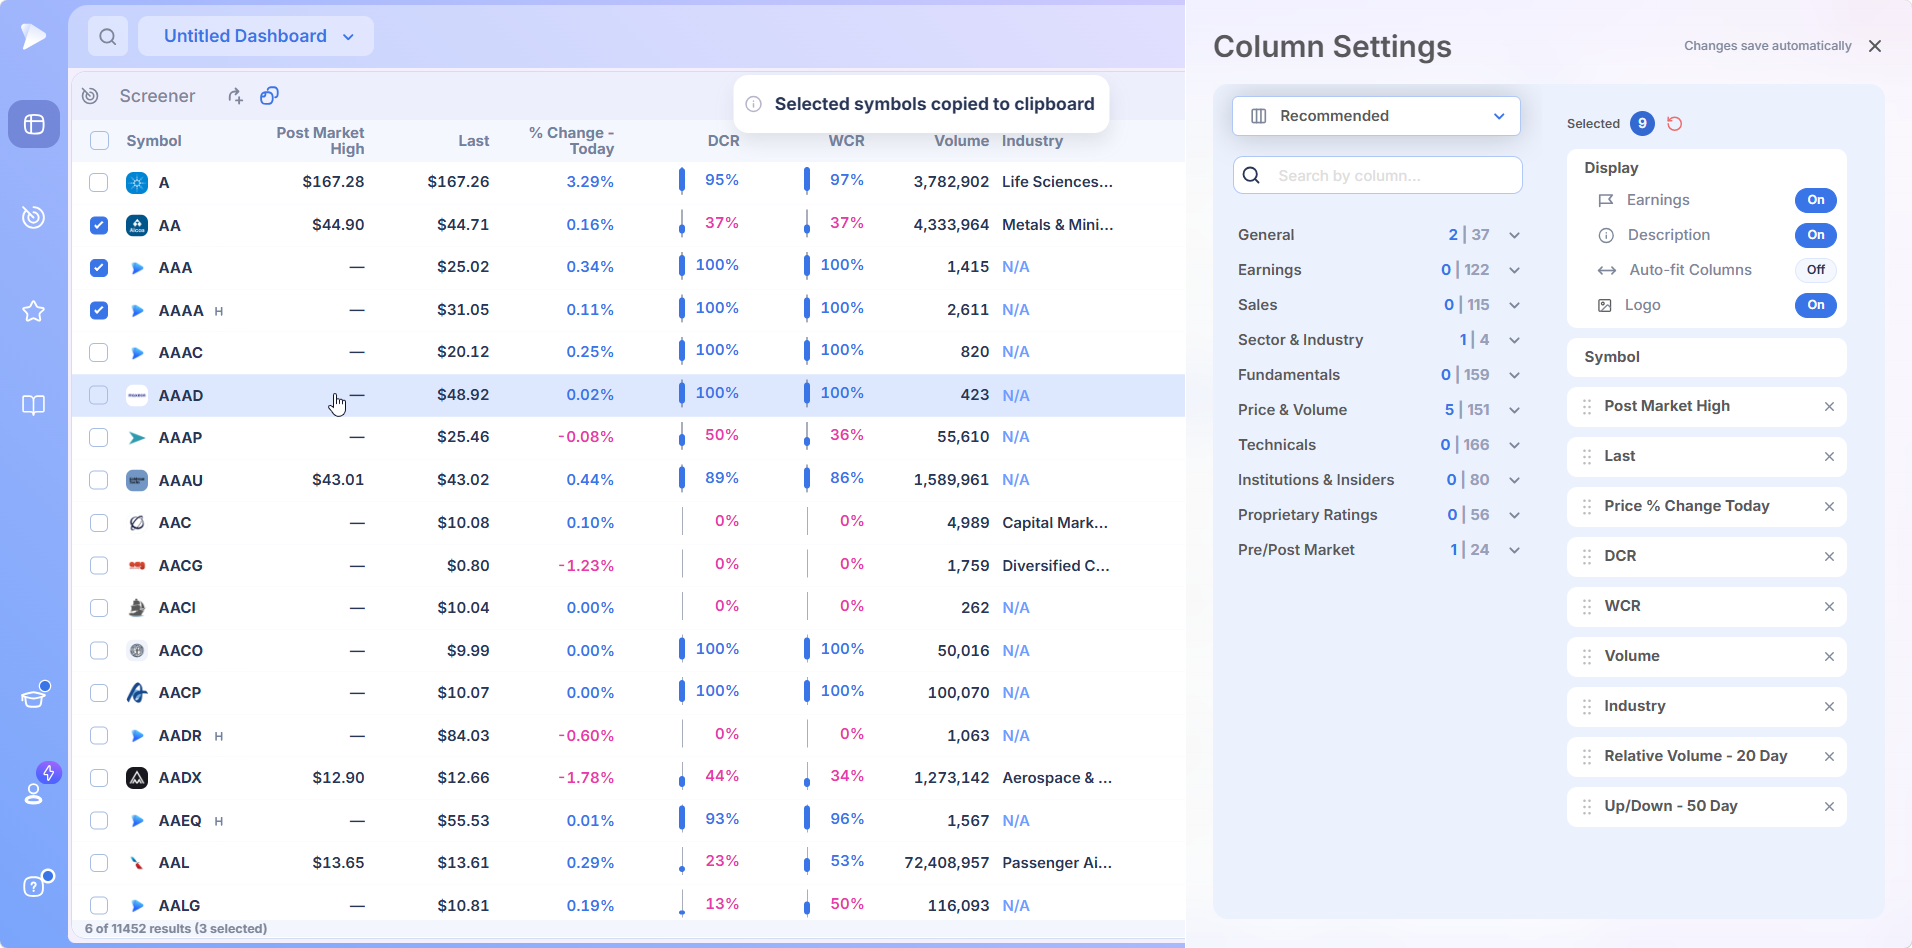
That settings gear on the right of the header row slides Column Settings open, and every change is saved as you make it.
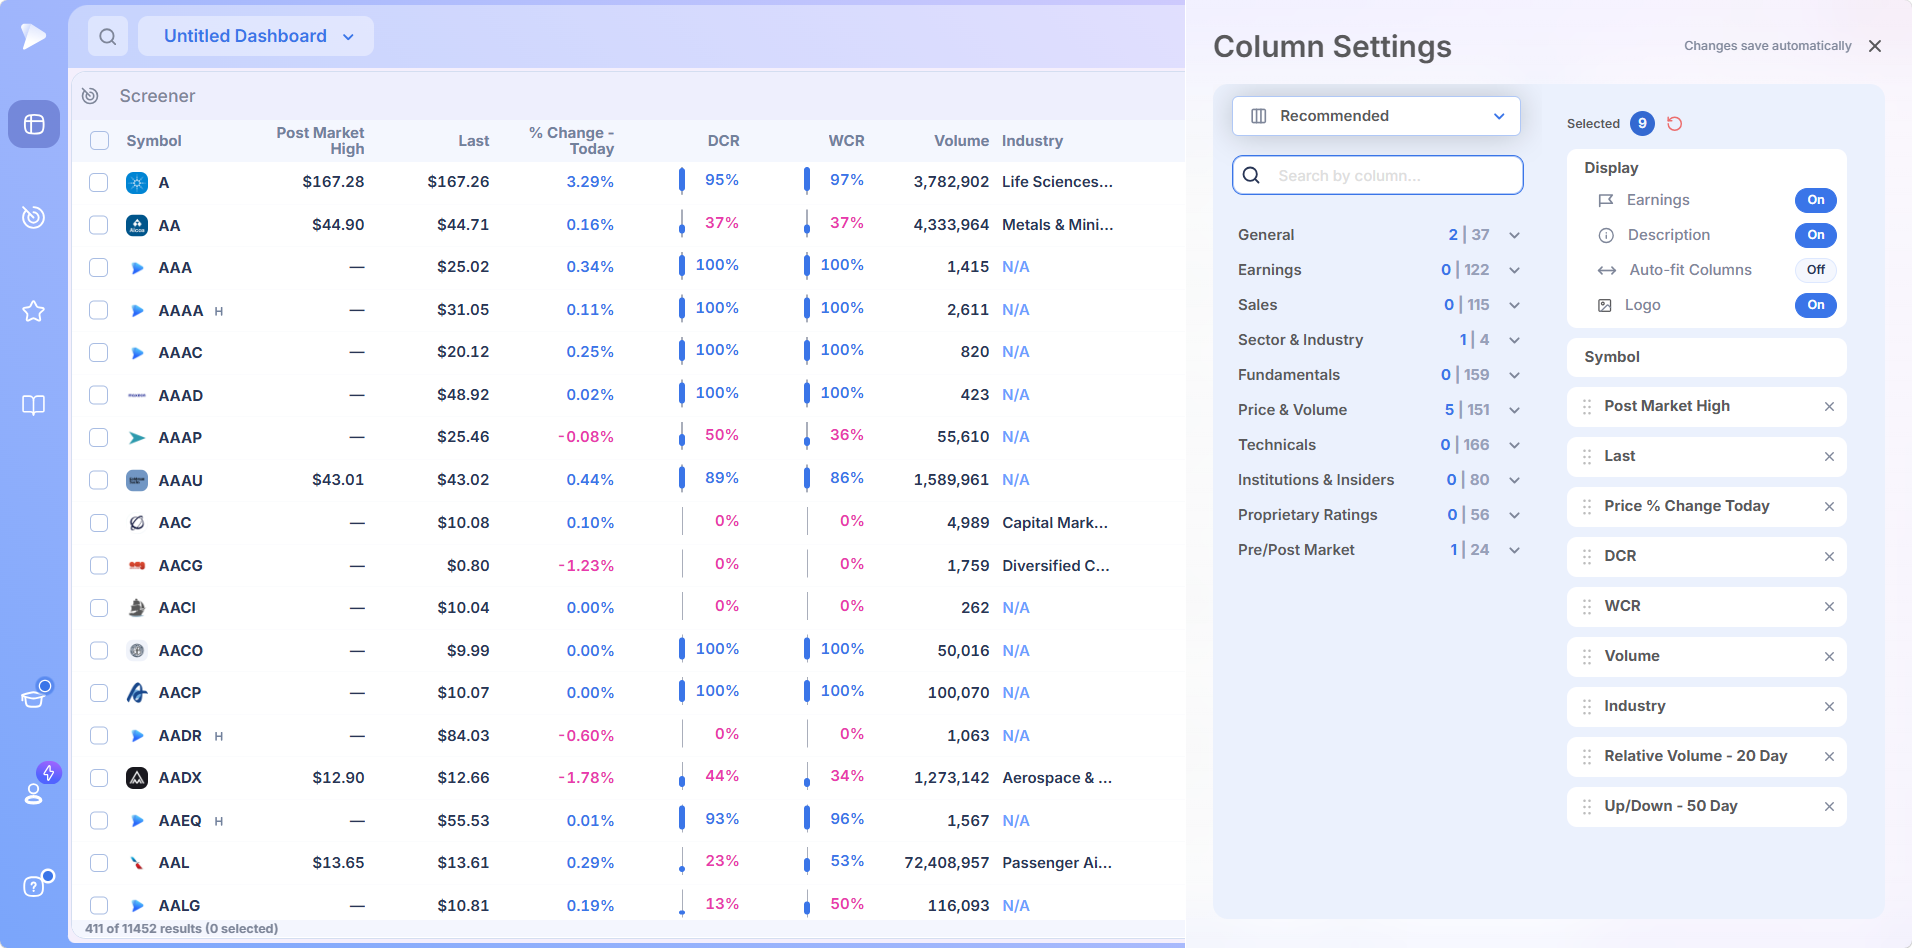
The library is split into ten categories, running from General and Earnings to Technicals, ownership, Proprietary Ratings and extended hours data, and each shows how many of its columns are on the table. A search box finds a column by name faster than browsing. On the right, toggles switch earnings flags, descriptions, auto fit and logos on or off, and each selected column is a chip you drag into position or remove.
Pair a column set with each saved screen and the table always opens showing what that screen is for.
Reading the Results
Results fill a table with a checkbox, logo and ticker on each row and the loaded column set across the top. Gains and losses are colored apart, closing range columns such as DCR and WCR draw a small bar beside the percentage, and the footer keeps a running count with how many rows are selected.
Column headers sort, the fastest way to push a screen’s results into the order that suits your question. At the right a panel offers four tabs: Data for the Data Panel on the selected row, Terminal for the AI Terminal with the screen as context, plus Alerts and News for the name in focus.
The Chart Beside Every Row
Switch the layout and the table narrows to make room for a full Deepvue chart in the middle, Enhanced Volume under it with its stats strip, and beneath both a Stats Table of eight quarters of earnings and sales.
Now a result is a decision in one screen: the filter found the name, the chart shows the setup, the volume panel shows participation, the table shows the earnings trend. Press the spacebar and all of it advances to the next row together, which turns a 160 name screen into a twenty minute review rather than an afternoon. The layout icons also offer a mini chart grid for a first pass.
Live Results, Not Snapshots
With 568 data points streaming over WebSocket, this is a real time stock screener. A screen re evaluates as prices move, so result counts and column values shift through the session.
Left open all day, a real time stock screener is a live list. That is why the Reports app can track how many names pass each screen through the day, and why a Performance Chart can rank a screen’s results as they change.
Acting on a Result Without Leaving the Table
This is what turns a screen from a list into a working queue. Click the plus button that replaces a row’s logo on hover, or right click the row, and a menu opens beside it.
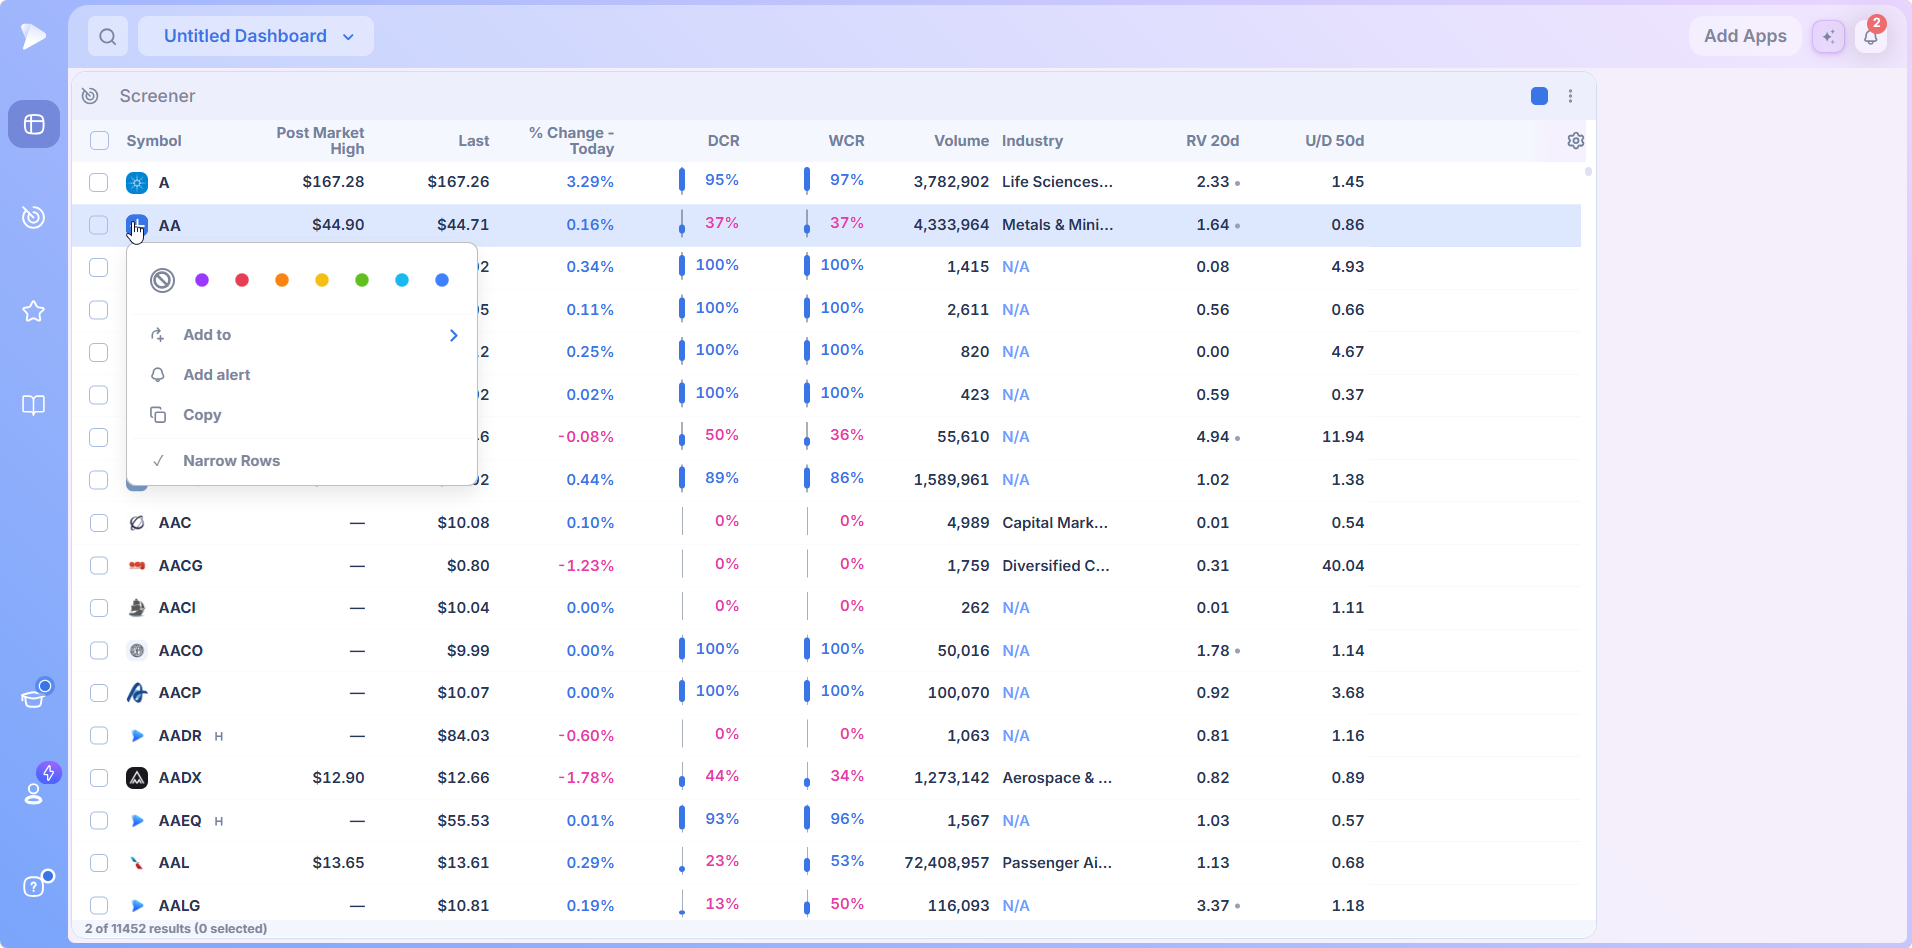
- •Color tags, with a clear option, for marking names in whatever coding you use.
- •Add to, which lists your watchlists with a search box and a Create watchlist option at the bottom.
- •Add alert, covered below.
- •Copy, which drops the ticker onto your clipboard.
- •Narrow Rows, which tightens row height so more results fit on screen.
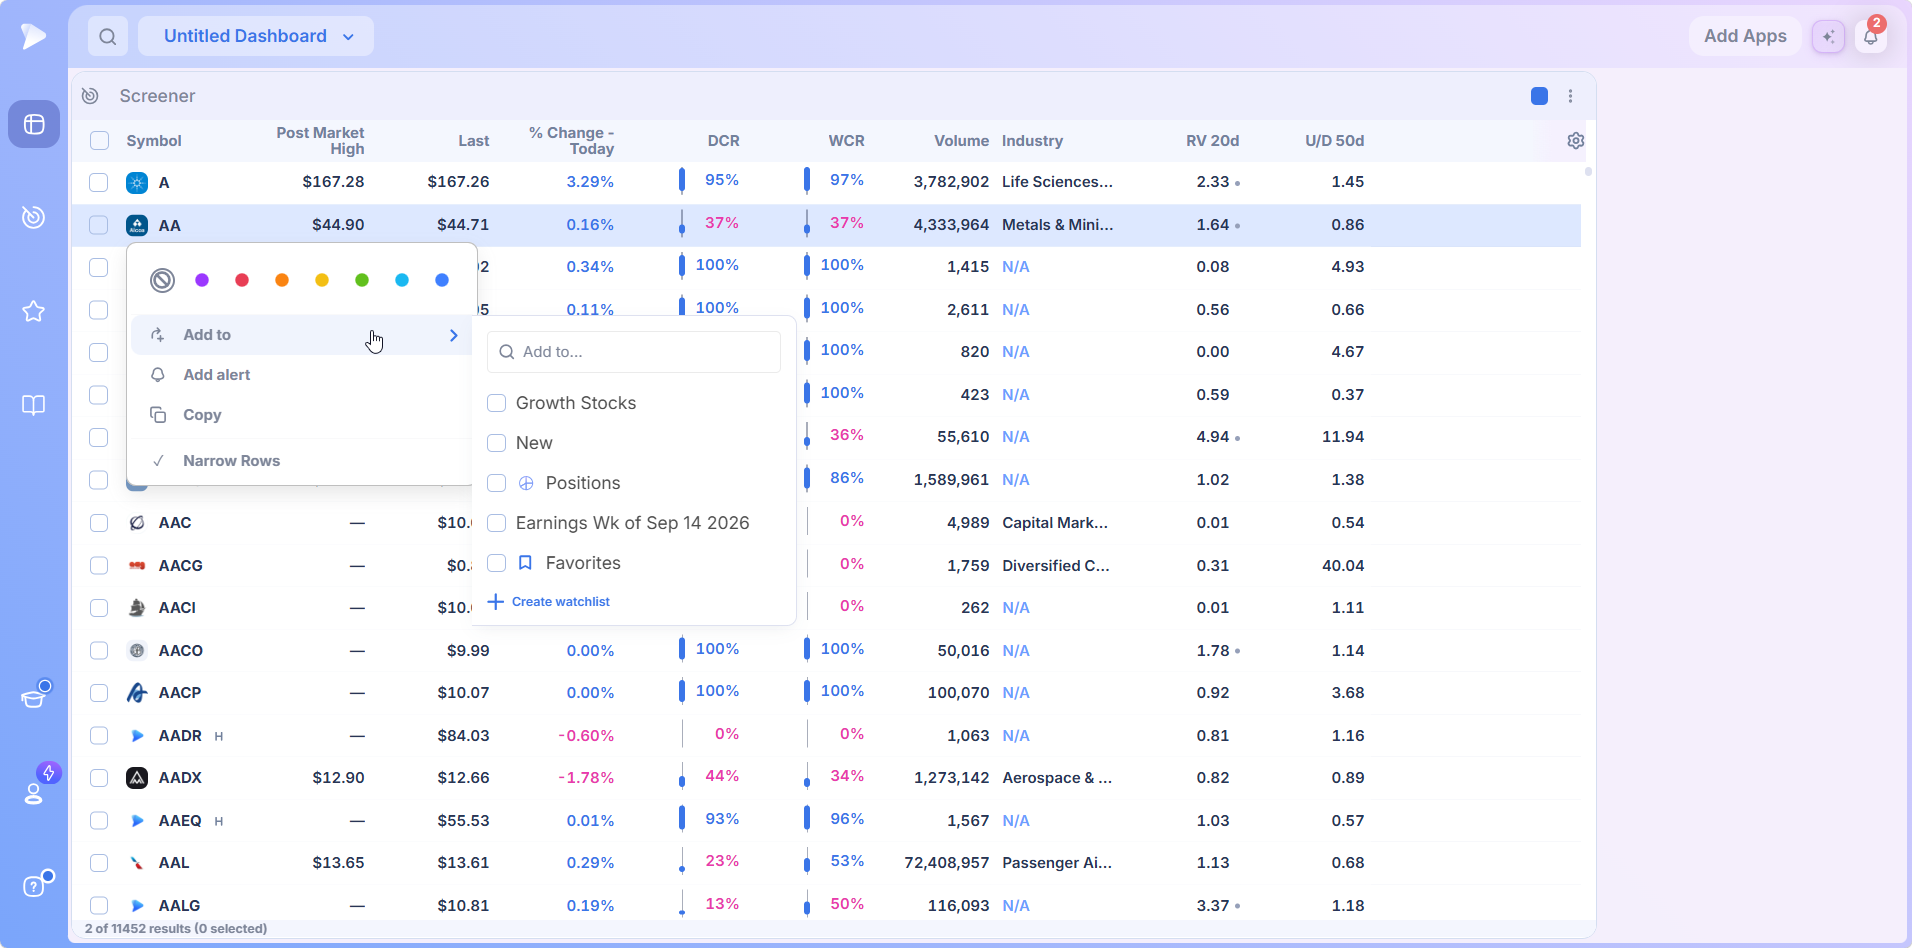
So a name that looks promising joins a watchlist in two clicks, without interrupting the review you are in the middle of.
Creating an Alert From a Screen Result
Choose Add alert and the full alert panel opens on the right with the symbol already filled in and the price field starting at the current price.
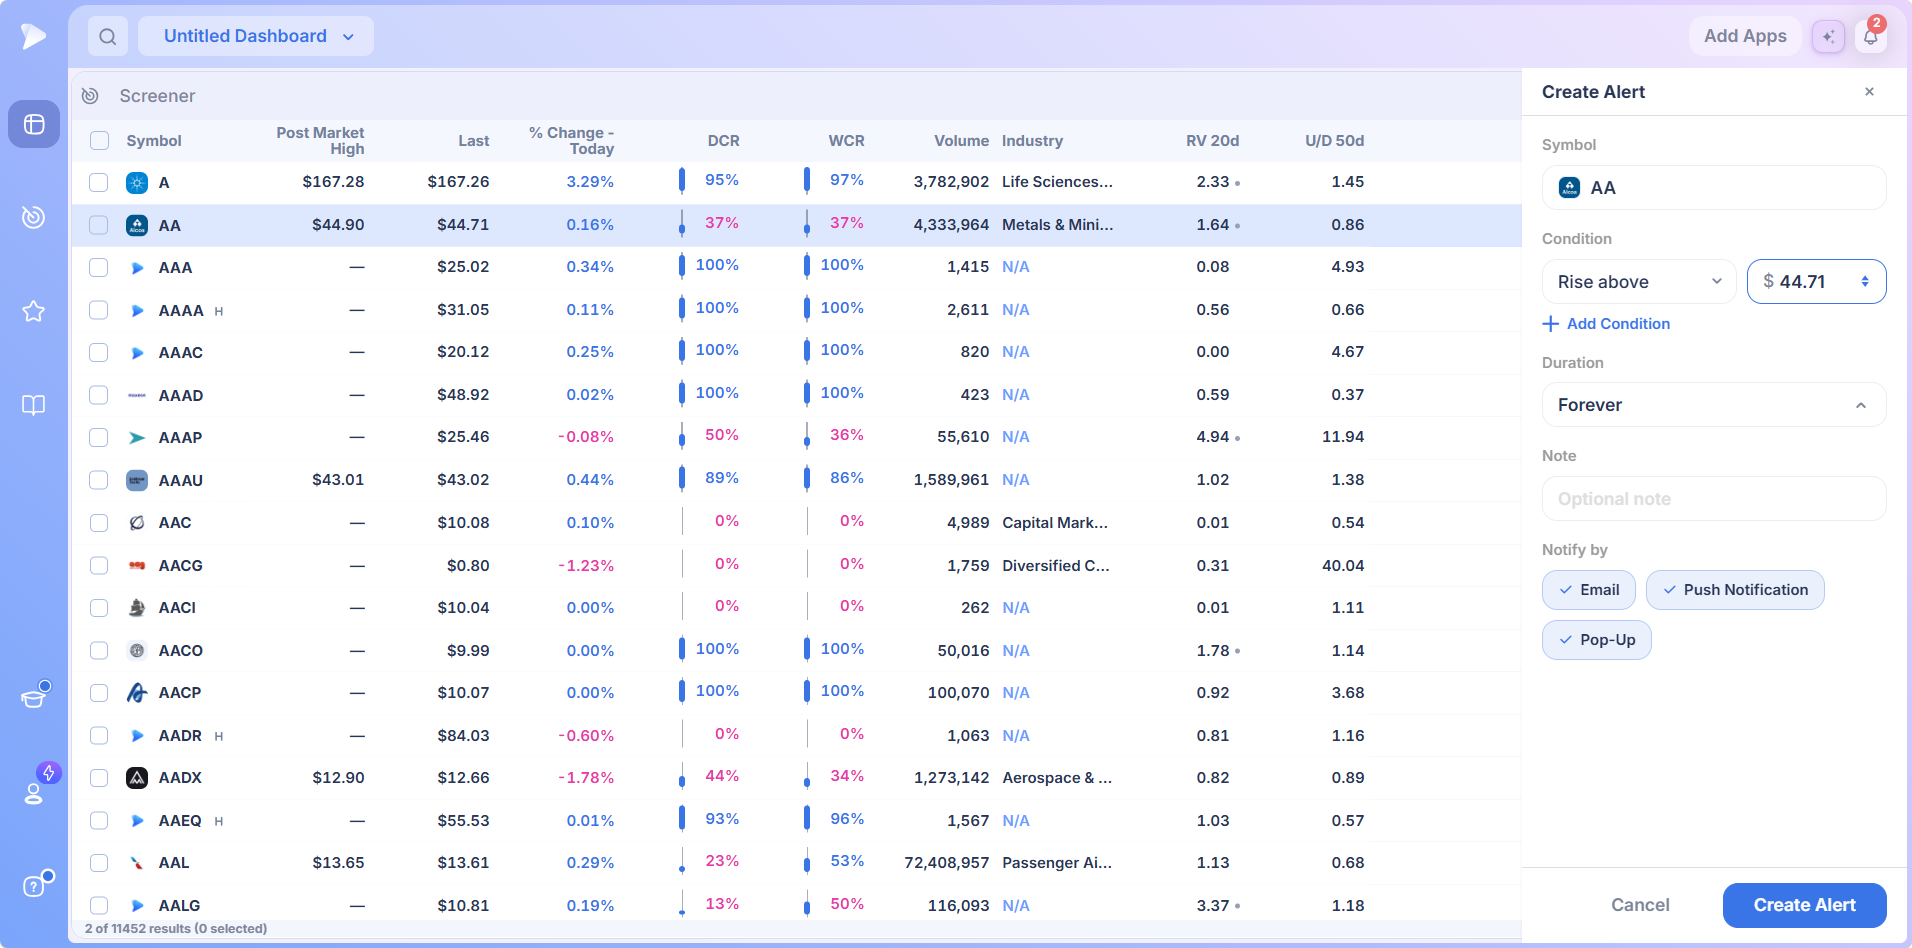
Everything the Alerts app offers is here: a direction and price level, an Add Condition control for pairing it with a data point condition, a duration, an optional note, and email, push and pop up as independent channels. A screen result you are not ready to buy becomes a level you are watching in about fifteen seconds, from the row itself.
Copying a Whole List of Symbols
Tick several rows and two controls appear beside the screen name in the header: one to add the selection to a list, one to copy every selected symbol to the clipboard. Handy whenever tickers need to go somewhere else: a broker, a spreadsheet or a note.
Start a Deepvue subscription and turn tonight’s screen into a watchlist and a set of alerts.
How to Run Your First Screen
Open the screener from the left sidebar, or add the Screener app to a dashboard from the Core group.
Open the picker from the screen name pill, go to Screener Presets, and hover a category. The information icon beside several screens explains what they look for.
Read the footer and the filter badge for the result count and how many filters the screen carries, then pick the column set that suits the question.
Switch to the chart layout, put your daily chart template on, and spacebar down the list with the data panel open.
Act on what you find. Tag the names worth keeping, send them to a watchlist, or set an alert. To make the screen your own, duplicate it into Saved Screens and adjust the filters.
Three Routines Worth Stealing
The preset rotation. Rather than one screen, run a rotation: a leaders screen for the universe, a Technical screen for setups inside it, an Earnings screen for what reports this week. Ten minutes, three angles, and the names appearing on two of the three are the ones to chart first.
The borrowed routine. Pick one trader in the Top Traders category and run their screens as named, the daily ones daily and the weekend ones at the weekend, for a month. It is the closest thing to sitting beside a professional while they work.
The custom screen build. Start from the preset nearest your method, duplicate it, change one filter at a time and watch the result count. Then track that count in the Reports app to see how the supply of setups changes with the market. The Ultimate Screening Guide covers filter construction in depth.
What Makes This Stock Trading Screener Different
Plenty of tools filter stocks. What separates the best stock market screener for growth traders is the fit of the filters and what happens after a result appears:
- ✓The data points are built for growth stock trading, so RS Rating, relative volume, closing range, up down volume, and base and pattern flags are native rather than approximated.
- ✓The presets are written by named traders as their own routines, not generated from a template.
- ✓The result is never just a list. The chart, volume panel, stats table and data panel are part of the screen, the difference between finding a candidate and evaluating one.
- ✓Results stream live, with 568 data points updating through the session.
- ✓Every row is actionable, from watchlist capture to a prefilled alert.
The Deepvue vs Finviz and Deepvue vs MarketSurge comparisons go into detail. No platform is right for everyone, and the honest way to decide is a proper comparison: our Deepvue comparisons hub sets Deepvue against MarketSurge, TradingView, TC2000, TrendSpider, and Finviz feature by feature, and the compare category collects every comparison article in one place.
What Traders Say About Deepvue
Screening in particular, as reviewers describe it, each linked to the original.
“I was very impressed by the flexibility of DeepVue’s screen creator.”
Dave at Day Trade Review, scoring the platform 4.7. His review
On the screens: “the multitude of screeners and the allowable customization” make it easy to find what you want.
From an April 2026 App Store review. The listing
“It includes the key features that matter for those styles.”
A five star G2 review covering momentum and CANSLIM trading. On G2
“It’s really the best screener I’ve ever used.”
u/Trading_Intern987, posting an r/CANSLIM update. Read it here
Across Deepvue’s reviews page, the platform holds a 4.8 rating from 220 plus verified reviews, with 97 percent of reviewers recommending it.
Where the Screener Connects
- •The screener by strategy pages group the prebuilt approaches, screener by pattern covers formations, and screener by indicator covers signals.
- •Charts for the chart beside every row, and the Data Panel for the numbers in the side panel.
- •The screener by market timing pages for the Pre/Post Market screens and live session work.
- •The AI Terminal for asking about a screen’s results, and the Model Book for saving the setups a screen keeps finding so you can study the pattern.
The Core Features hub gathers the daily apps, and each data point is documented in the Knowledge Base.
What the Screener Costs
The screener, all 169 presets, custom screens without limit, and the chart and data panel beside every row are included in Deepvue’s single plan at $49 per month, with monthly and annual options. No screener tier exists and nothing is priced per preset.
That one plan covers:
- •The screener and its 1,152 data points.
- •Charts, watchlists, and alerts, all of them unrestricted.
- •Fully customizable dashboards, with every app in the catalog.
- •The Theme Tracker, Market Brief, and AI Terminal, the last with unbounded usage.
Deepvue has one plan, so there are no tiers to compare. For reference, MarketSurge, the legacy platform in this niche, runs $149 per month.
New subscribers also get a one on one onboarding session with a Deepvue team member, an onboarding email series covering platform features and use cases, and weekly live webinars that each go deep on one part of the platform.
A Stock Trading Screener That Finishes the Job
Finding a stock is the easy half. Judging it is the hard half, and that is where a stock market trading screener earns its keep or quietly wastes your evening.
Is the chart beside the row? Is the volume there? The earnings? Can you move to the next name without clicking three times, and act on one without leaving the table? Here the answer is yes five times, which is what any best stock market screener claim has to rest on.
Join Deepvue and spacebar through a Top Traders screen tonight with the chart open.
↑ Back to contentsFrequently Asked Questions
Answers on the stock screener, from the platform itself.
What is a stock screener and how does it work?
A stock screener is a tool that filters the whole market down to the names meeting rules you set, such as price, volume, trend or growth, and it works by testing every ticker against those rules. Deepvue’s screener turns thousands of tickers into a list you can work in twenty minutes.
How do you use a stock screener for swing trading?
You use a stock screener for swing trading by starting with liquidity, adding a trend filter, then a setup condition such as a pullback to a moving average or a tight consolidation near highs, and running it on a schedule. Deepvue’s Technical category holds prebuilt versions of exactly those.
What filters should I use in a stock screener?
The filters you should use in a stock screener are fewer than you think: a liquidity floor, a trend condition, a relative strength measure and one setup filter carry most swing and position trading. Start from a Deepvue preset that balances those and adjust one condition at a time.
How often should you run a stock screener?
You should run a stock screener once a day on a multi week horizon, usually after the close when the data is final. Consistency beats frequency: the same Deepvue screens at the same time, feeding a watchlist you set alerts on, so you are ready when a setup triggers.
Are free stock screeners good enough?
Free stock screeners are good enough for a first pass, but the limits show in two places: they usually run on delayed data, and you open each chart somewhere else. Deepvue’s screener streams live data and puts the chart in the same window to fix both.
Do I need a separate charting tool alongside a screener?
No, you do not need a separate charting tool alongside a screener if it shows a real chart beside the row. In Deepvue the chart, volume panel, quarterly stats and data panel are on the screener screen and advance together on the spacebar, removing the biggest time cost in screening.
What is the Deepvue Screener?
The Deepvue Screener is a module that filters US listings across 1,152 data points, returns a result table with a configurable column set, and opens a chart, Enhanced Volume, a quarterly stats table and a data panel beside every row. It is also a Core app on the dashboard.
What is the best stock market screener for growth stocks?
The best stock market screener for growth stocks is one whose filters match the method and that lets you judge a result without leaving the page. Growth traders need relative strength, relative volume, closing range and pattern flags as native filters plus a chart beside the row, which is how Deepvue is built.
How do you screen for momentum stocks?
You screen for momentum stocks by filtering for relative strength against the market, above average volume and price holding near recent highs, then confirming on the chart that the move has a base behind it. Deepvue’s house and Technical categories hold prebuilt screens for exactly that.
What should I look for in a stock screener?
You should look for three things in a stock screener: what you can filter on, whether results update live, and what happens after a result appears. The third is where most fall down, which is why Deepvue puts the chart, volume and data panel beside every result.
How many preset screens are there?
There are 169 preset screens in the Deepvue screener, organized in nine categories: Deepvue, Top Traders, Technical, Fundamental, Momentum, Earnings, Day Traders, Pre/Post Market and Markets. Each loads in one click and stays read only until you duplicate it.
Who wrote the Top Traders screens?
The Top Traders screens were written by professional traders under their own names, including Ameet Rai, Anthony Shi, Ben Bennett, Chris Perruna, Dan Zanger, David Ryan and Eric Krull, plus the screens from Oliver Kell, Mike Webster and Mark Minervini that Deepvue is known for.
Can I edit a preset?
No, you cannot edit a preset directly; its filters are visible but locked. In Deepvue, use the three dot menu to duplicate it, name and file the copy, and that copy opens with every filter editable.
Can I build my own screens?
Yes, you can build your own screens in Deepvue. The Saved Screens tab has a Create new menu for a screener, a combo or a folder, and a new screen asks you to name it, file it, pick its column set and describe it before you add filters from the filter control.
Can I set an alert from a screen result?
Yes, you can set an alert from a screen result. Choose Add alert from the row menu and Deepvue’s full alert panel opens with the symbol prefilled and the price field starting at the current price, plus an optional second condition, a duration, a note and your notification channels.
Can I add screen results to a watchlist?
Yes, you can add screen results to a watchlist. Deepvue’s row menu carries an Add to option listing your watchlists, searchable, plus a way to create a new one, alongside color tags, Add alert and Copy.
Can I copy a list of symbols out of the screener?
Yes, you can copy a list of symbols out of the screener. Tick the rows you want and a control appears in Deepvue’s screener header to copy every selected symbol to the clipboard, confirmed with a short notice.
Can I sort the results?
Yes, you can sort the results in the Deepvue screener. Clicking a column header sorts by that column, with an arrow showing the direction, so results order by whichever measure matters right now.
What is a column set?
A column set is the group of columns the screener’s result table shows. In Deepvue each saved screen can carry its own set, chosen from a column library in ten categories, so the table opens with the right data for that screen.
Do results update in real time?
Yes, Deepvue screener results update in real time. Of the 1,152 data points, 568 stream live over WebSocket, so result counts and column values move during the session rather than waiting for a refresh.
What do the DCR and WCR columns show?
The DCR and WCR columns show the daily and weekly closing range: where within that period’s high to low span a stock finished, from 0 percent at the low to 100 percent at the high. Deepvue draws each as a small bar beside the percentage, so no chart is needed.
Is there a screen for stocks reporting earnings soon?
Yes, there is a screen for stocks reporting earnings soon. Deepvue’s Earnings category holds Earnings Today, Tomorrow, Next Week and Next Month, plus Earnings Watch, Recent Earnings Winners and an EPS and sales surprise screen for the last month.
Can I use an index as a universe?
Yes, you can use an index as a universe. Deepvue’s Markets category holds the Dow Jones, Nasdaq 100, Russell 2000 and S&P 500, so any column set can be read against a benchmark’s constituents.
Does the screener cost extra?
No, the screener does not cost extra. The complete Deepvue screener, every preset and any number of custom screens are all included in the single $49 per month plan.
CAN SLIM® is a registered trademark of O’Neil Capital Management, Inc. (U.S. Reg. No. 3,081,940). Deepvue is not affiliated with, sponsored by, endorsed by, or licensed by O’Neil Capital Management, Inc., Investor’s Business Daily, MarketSurge, or their affiliates. Any reference to CAN SLIM® is for descriptive purposes only. Deepvue’s scores, ratings, and screeners are independently calculated by Deepvue and are not the proprietary ratings of MarketSurge or IBD.