Deepvue New Highs / Lows: Which Stocks Are Breaking Out, Which Are Breaking Down, and Where
New Highs / Lows turns Deepvue’s new highs and new lows count into a list of names. A split bar shows how many stocks are at new highs against new lows, and the leading and lagging classifications are ranked with their share of each side.
Every stock is listed under its classification at sector, industry, group or sub industry level. Filters narrow the universe by price and volume, and any ticker adds to a watchlist in two clicks.
and placing the app takes a moment, at no extra cost.
Deepvue new highs lows, in numbers:
Key Takeaways
New highs and new lows are among the oldest breadth readings in the book, the classic new highs lows breadth gauge, and most platforms give you the two numbers and stop there.
A count of highs against lows tells you the tape is leaning one way. It does not tell you which sectors are supplying the highs, which are supplying the lows, or that a bank you have never heard of just joined the list.
The Deepvue new highs lows app supplies the rest. It keeps the count, then unpacks it: which classifications produce each side, in what proportion, and the individual stocks behind them. A number tells you the weather; a list tells you what to buy.
- ✓A split bar shows new highs against new lows as counts and proportion, with the leading and lagging classifications ranked beneath by their share of each side.
- ✓Every name is listed, with a logo, under its classification, and the group’s count and share appear beside the heading.
- ✓Four levels of grouping, from sector down to sub industry, so the granularity matches the question you are asking.
- ✓Three filters narrow the universe by last price, 20 day average volume and 20 day average dollar volume.
- ✓Every ticker is actionable: tag it by color, file it in a watchlist or a new one, or copy the symbol, and a linked chart follows every click.
- ✓Part of the one plan, with nothing gated. Get started with Deepvue here.
New Highs / Lows at a Glance
- Split bar
- New highs count against new lows count, drawn in proportion, blue and pink
- Leading and lagging lists
- The classifications supplying the most highs and the most lows, each with its share
- Level tabs
- Sector, Industry, Group and Sub Industry, regrouping the same stocks
- Stock lists
- Logo and ticker for every name under its classification, with count, share and an overflow badge
- Filter panel
- Min and max for last price, 20 day average volume and 20 day average dollar volume, plus Reset
- Quick menu
- Tagging, watchlist adds with a Create watchlist link, and Copy
- Color group
- Sends each click to any Chart app sharing the same square
- Where to find it
- Filed with the Research apps
What Is the Deepvue New Highs / Lows App?
It is a new high new low indicator built to be drilled into rather than merely read. The count every breadth tool reports is at the top; everything underneath is the part other tools leave out: the composition of that count by classification, and the names themselves.
The images here come from a single session, chosen to show the app’s layout. The counts, percentages, sectors and tickers belong to that day and will differ every time you open the app.
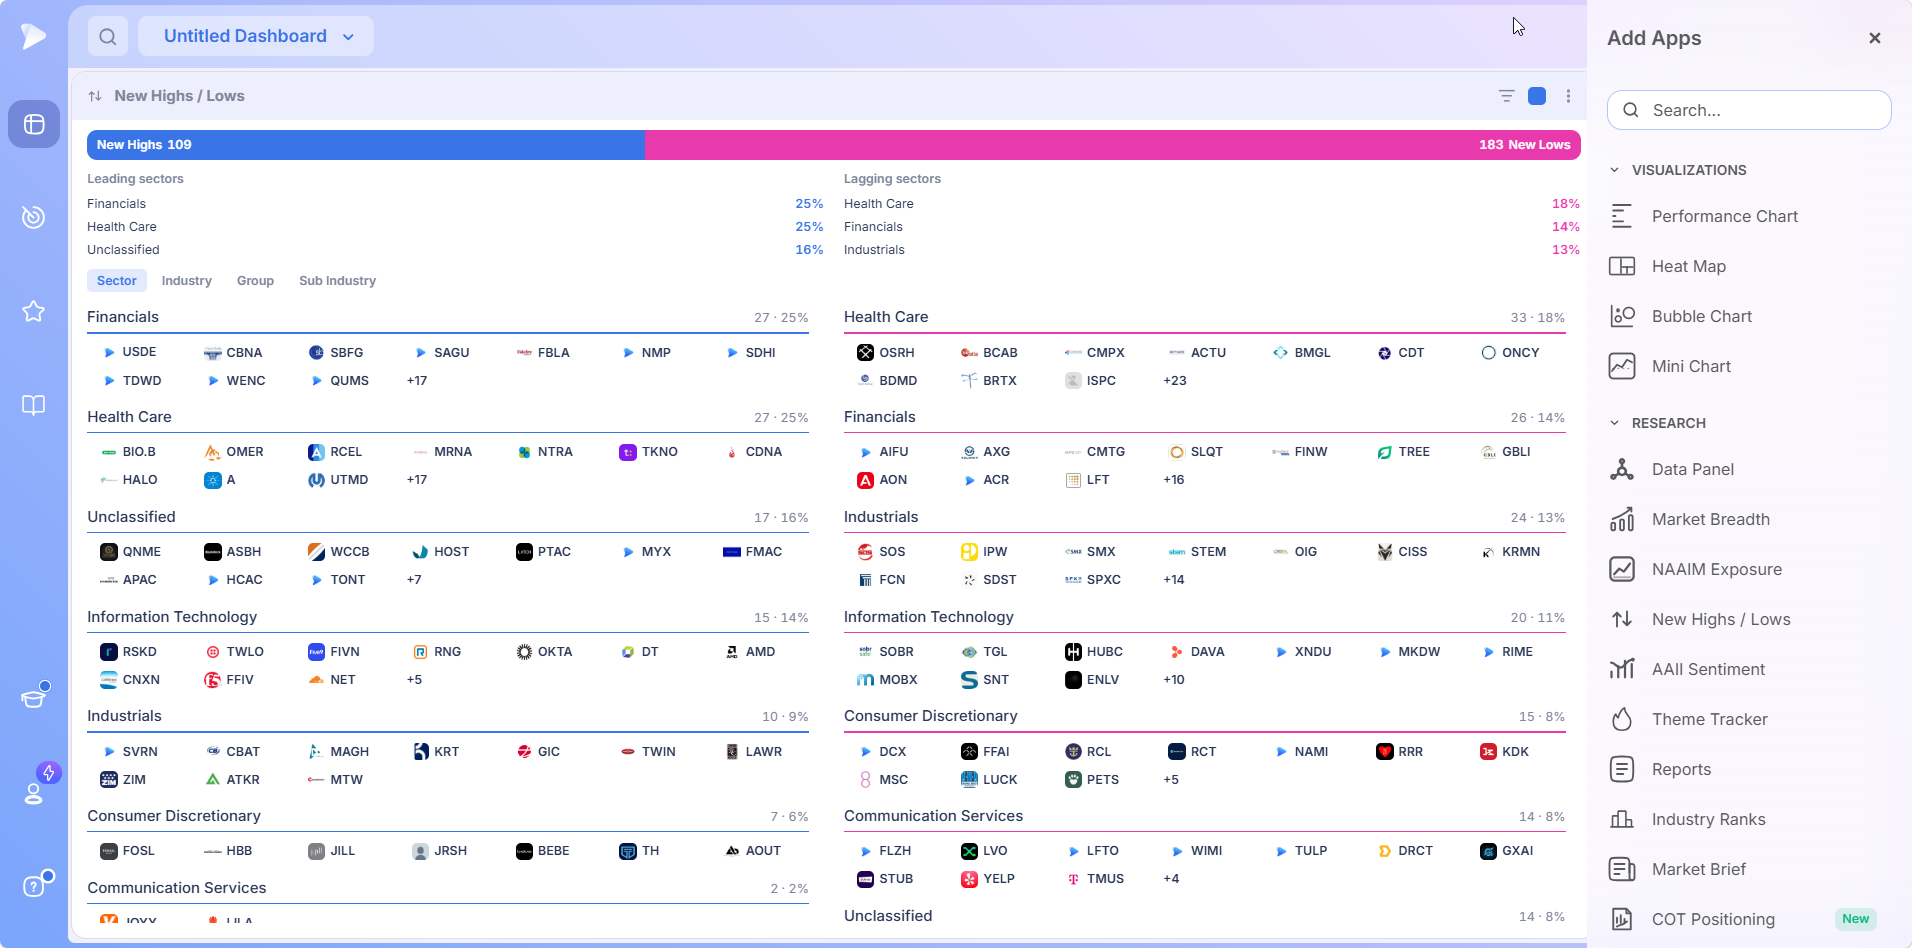
The catalog files it under Research. Placed small, it already shows the whole structure: the split bar, the leading and lagging sectors, the level tabs, and the first list on each side. Widen it and the lists spread into columns.
What Market Breadth Leaves to This New Highs New Lows App
The Market Breadth app includes a highs against lows gauge among its five, giving the count and its bullish share. This new highs new lows app is that one gauge expanded into a full screen: the same count, then every classification and every stock behind it. Read the gauge for the number; open this app when you want to know who.
Who the New Highs / Lows App Is For
Traders who treat stocks making new highs as a hunting ground and stocks making new lows as a warning. Deepvue is designed for positions that run weeks into months, and the list reads best at that pace.
- ✓Breakout traders for whom new highs are the primary universe and the sector split says where the leadership is.
- ✓Swing traders filtering the highs list down to liquid names before checking each chart for a setup.
- ✓CANSLIM® traders, who buy strength by definition and want the new highs list sorted by industry group.
- ✓Position traders holding a name in a classification that has started supplying new lows, since the lagging list is an early warning.
Each trading style has a written routine among the Deepvue for guides.
Reading the New High New Low Indicator
The Split Bar
A single bar runs across the top, blue for new highs on the left and pink for new lows on the right, with the counts printed at each end. The two segments are sized in proportion, so the balance of the day reads before the numbers do. A longer pink segment is a session leaning bearish, a longer blue one the reverse.
Leading and Lagging Classifications
Under the bar are two short ranked lists:
- •On the left, the classifications supplying the most new highs, each with its share of the highs count.
- •On the right, those supplying the most new lows, each with its share of the lows count.
That pairing is new highs new lows by sector in its simplest form, and a rotation read in miniature: money arriving in some groups and leaving others on that particular day. The heading follows the tab, so on the Industry tab the lists read leading and lagging industries, and so on down.
One label deserves a note. Unclassified appears as a group on both sides, holding names with no classification assigned yet. It can rank high on either list, so it is worth knowing it is not a sector.
The Stock Lists
Below the summary, every classification that contributed to the count gets a heading with its count and share, then the stocks themselves, each with a logo and ticker. Highs run down the left under blue rules, lows down the right under pink. The lists are ordered by count, so the classification with the most names comes first and the singles trail at the bottom, new highs new lows by sector read as a league table.
Each heading shows up to about a row and a half of names before an overflow badge takes over, reading as a plus sign and a number. The badge keeps a heavily populated classification from swallowing the screen while still telling you how deep it runs.
| Element | What it shows |
|---|---|
| Split bar | New highs count and new lows count, drawn in proportion |
| Leading and lagging lists | The classifications supplying the most highs and the most lows, with each one’s share |
| Classification heading | Group name, then its count and its share of that side |
| Stock rows | Logo and ticker for each name, with an overflow badge past the first row and a half |
Open a Deepvue account to find out which sectors are supplying today’s new highs.
Four Levels of Grouping
A row of four tabs above the lists regroups everything: Sector, Industry, Group and Sub Industry. The counts at the top do not change, because the same stocks are being sorted; what changes is the resolution of the answer.
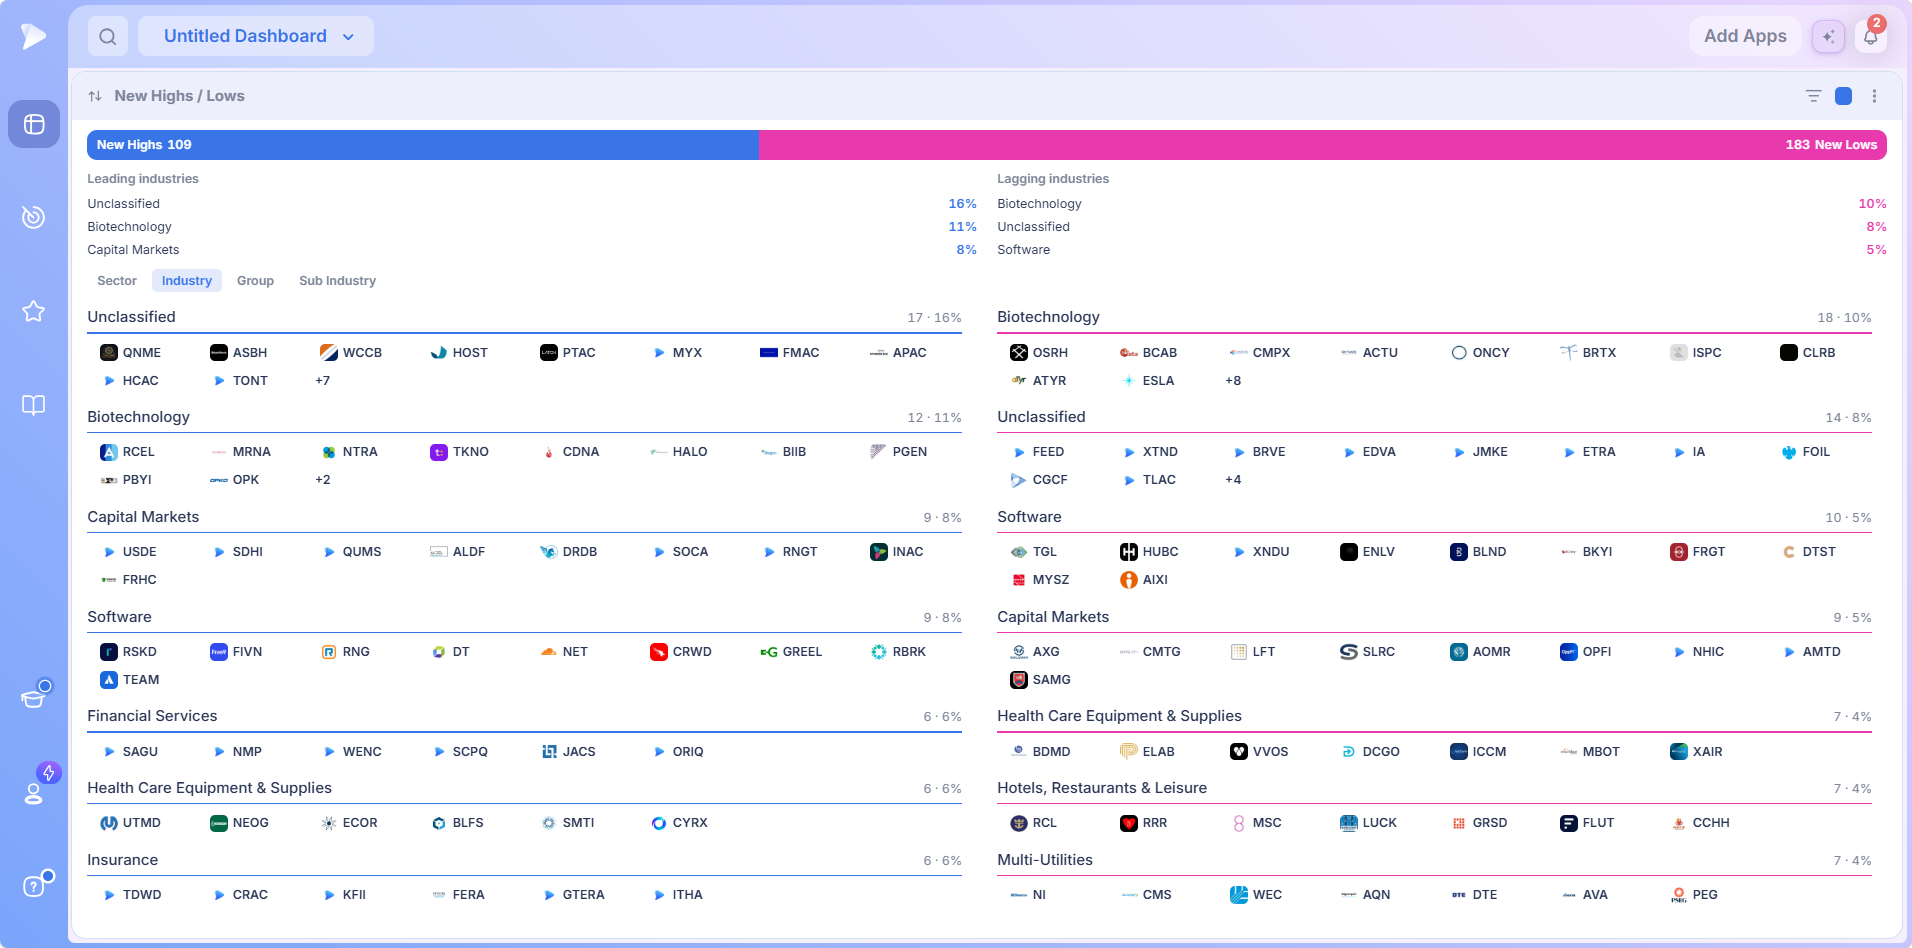
Switch from Sector to Industry and the picture sharpens. A sector that led the highs resolves into the specific industries inside it, and an industry the sector view had folded into a larger heading can surface on its own as a leader or a laggard.
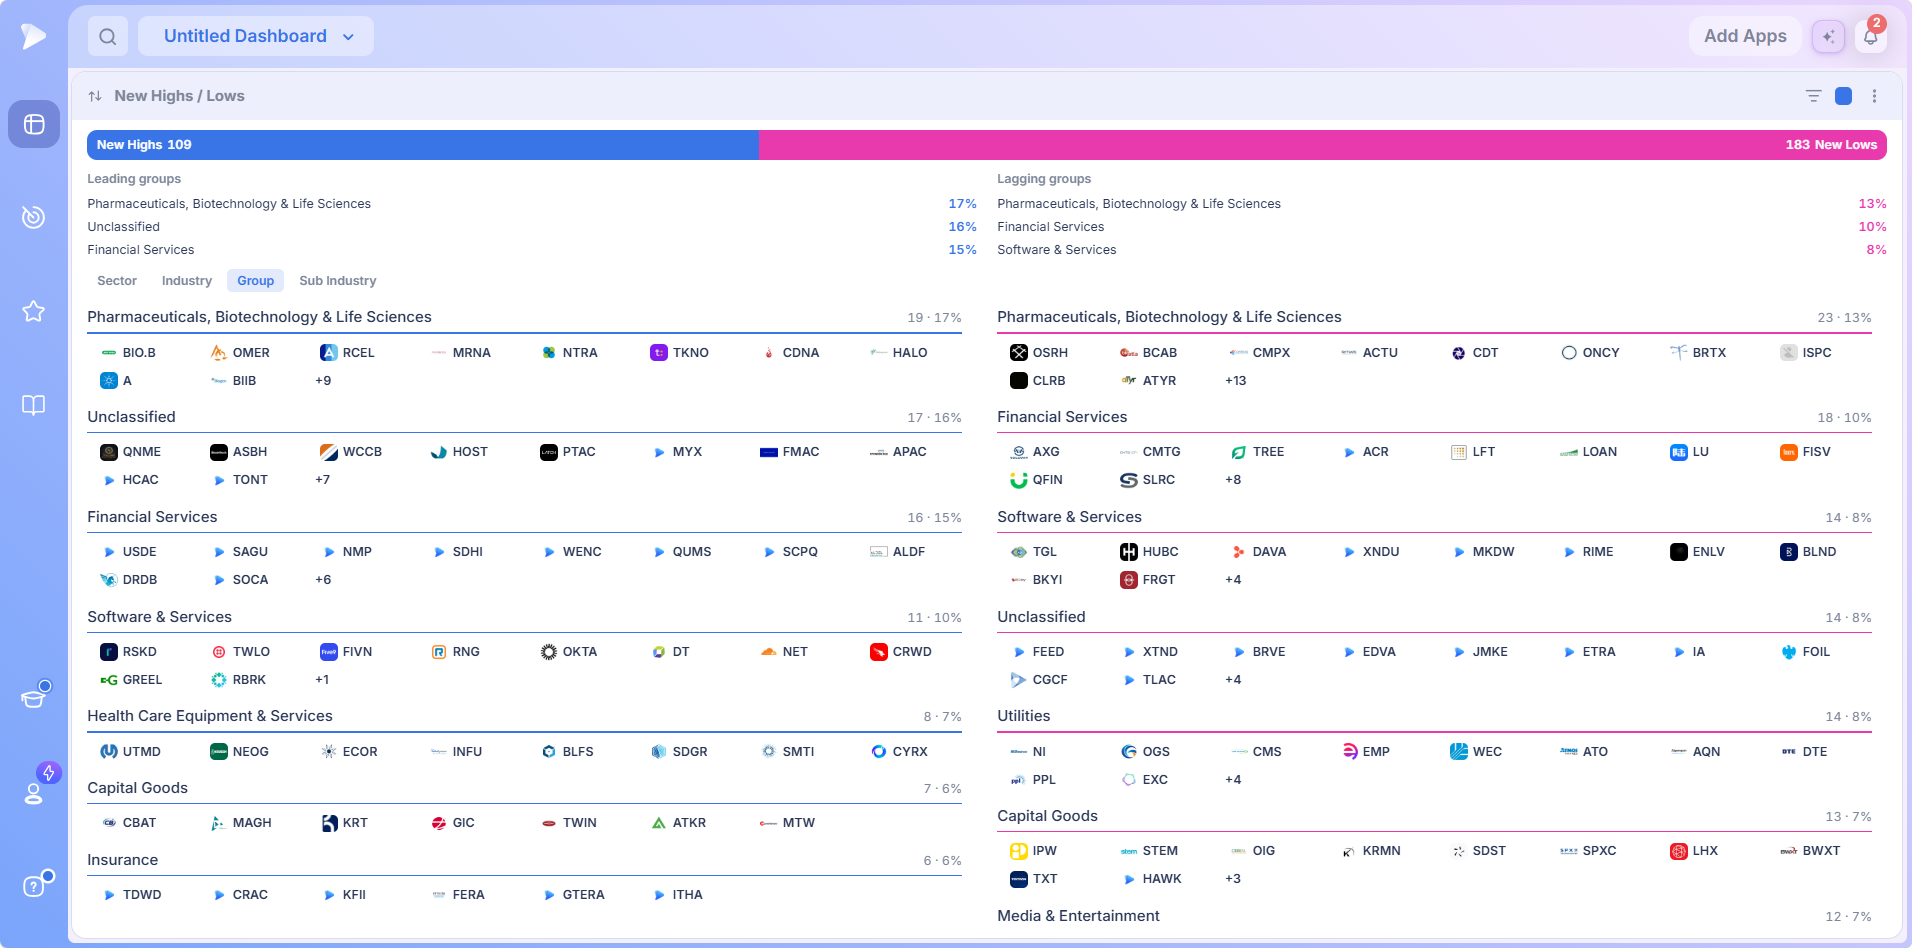
Group is a middle level between sector and industry, and Sub Industry is the finest cut. At that level one sector’s highs can separate into several distinct lists, so when you want to know exactly which pocket of a sector is producing new highs, this is the tab.
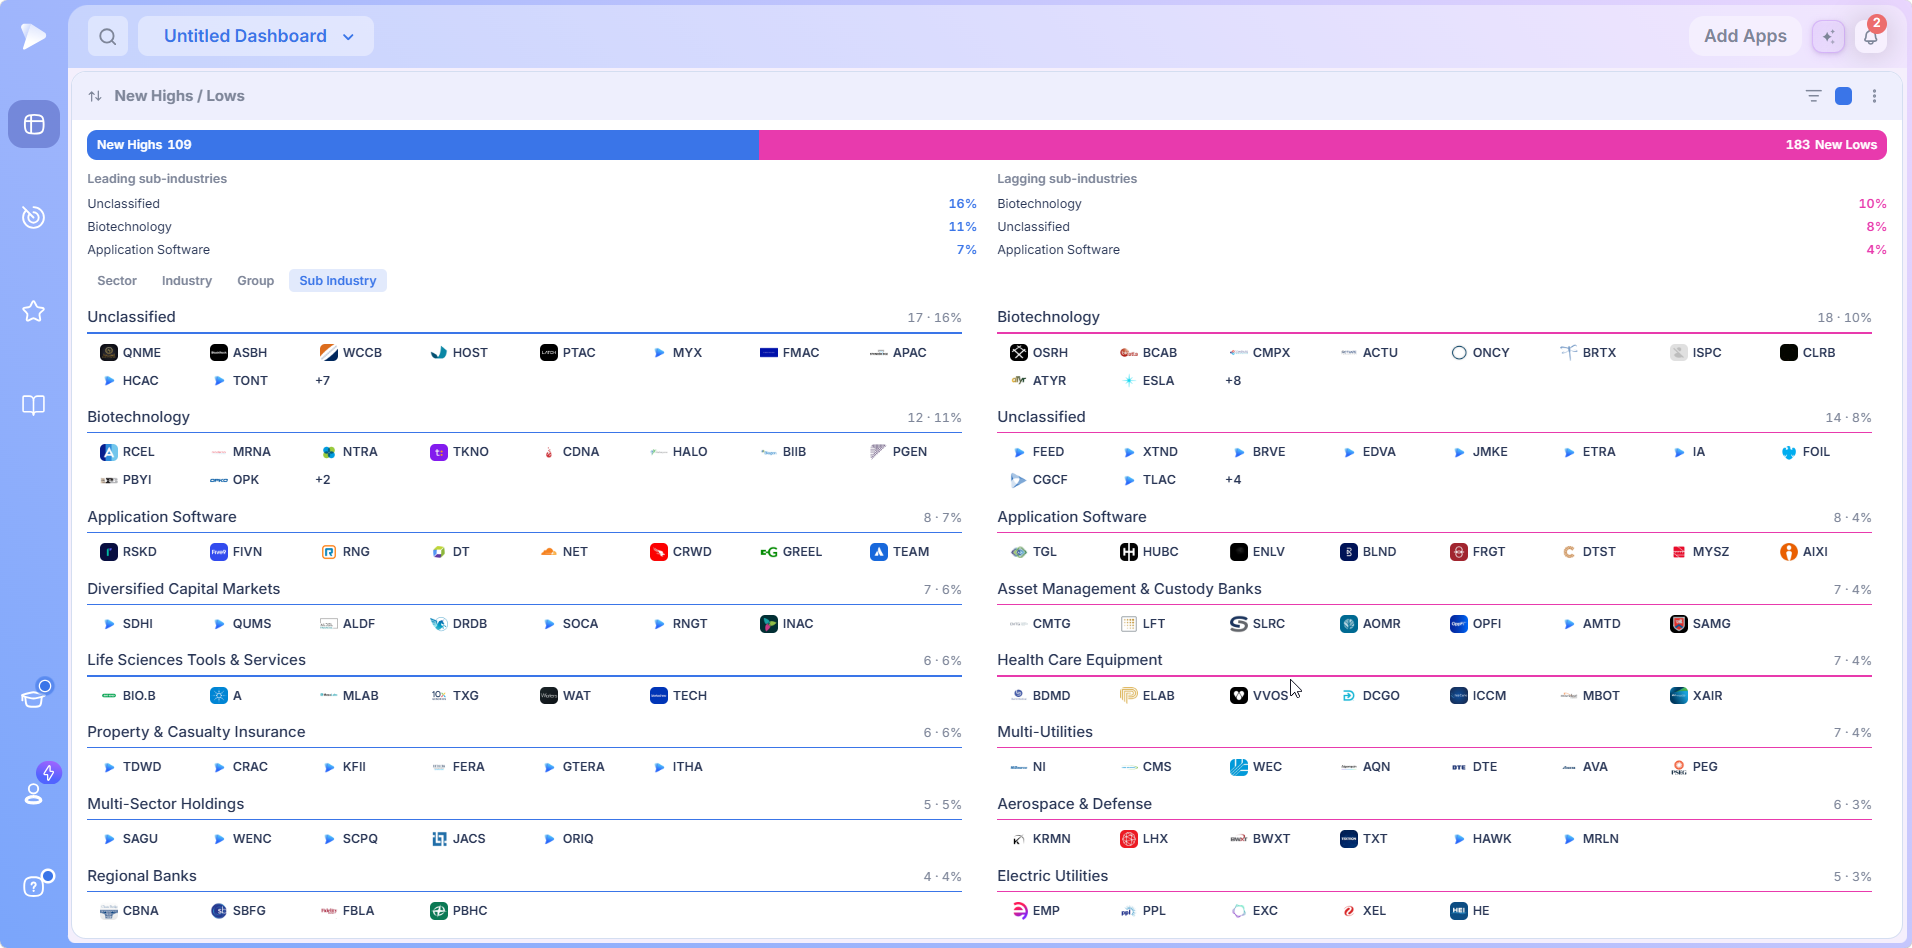
| Tab | Best for |
|---|---|
| Sector | The broadest read on where highs and lows are concentrated |
| Industry | The working level for most routines: precise but quick to read |
| Group | A middle view when sectors blur too much and industries fragment |
| Sub Industry | Pinpointing the exact pocket behind a move |
Filtering the New Highs Lows Widget
The filter icon in the header opens a panel with three paired fields. Last $ takes a minimum and maximum price, Average 20D Volume the same in millions of shares, and Average 20D $ Volume the same in millions of dollars. A Reset link clears them all, and the icon carries a badge counting active filters, so a narrowed view never passes for the whole market by accident.
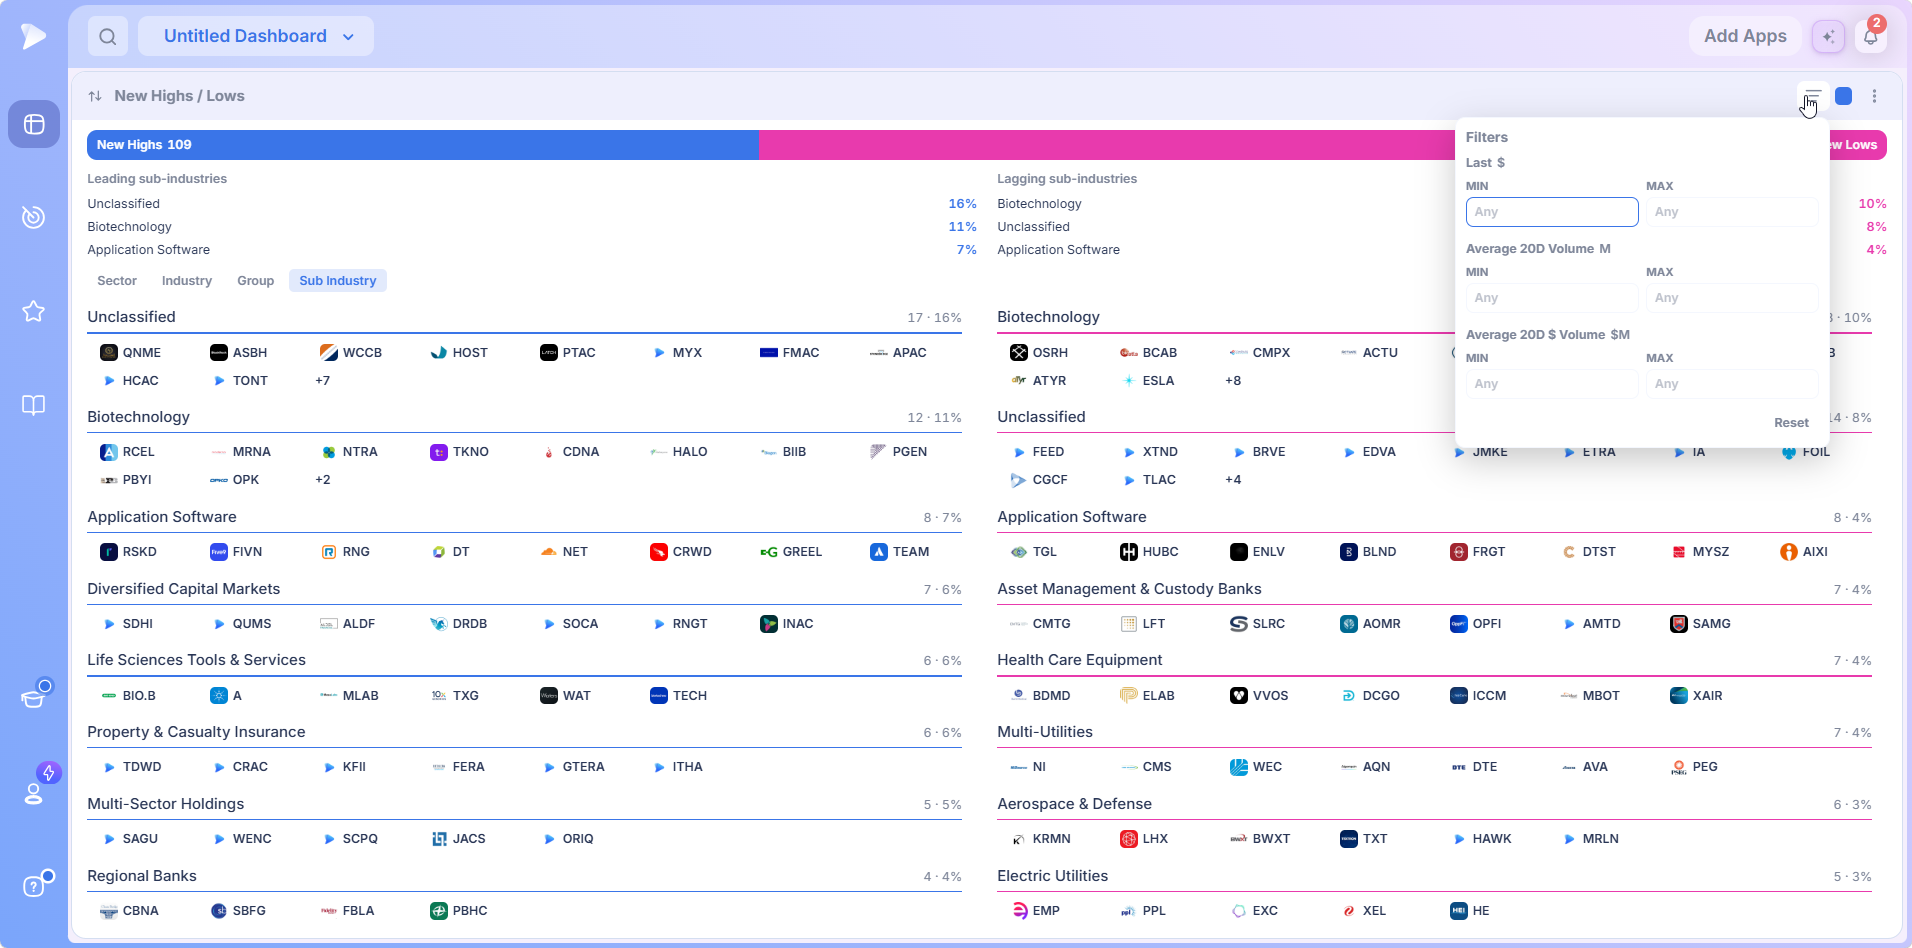
This is the control that makes the list tradeable, and it is worth setting once and leaving. An unfiltered new highs list includes every thinly traded name that ticked to a fresh high on a few hundred shares, and you cannot buy those in size without moving the price against yourself. Set a dollar volume floor that matches your position size and what remains are the highs you could actually trade; a price band and volume floors together can cut a list of hundreds to a few dozen.
From a Name to a List in Two Clicks
Hover a ticker and click the plus button next to it, and a quick menu opens:
- •Color tags across the top, which mark the name with a colored list, plus a clear option.
- •Add to, a picker of your watchlists, searchable, ending in a Create watchlist link for a name that belongs somewhere new.
- •Copy, which copies the ticker and flashes a confirmation.
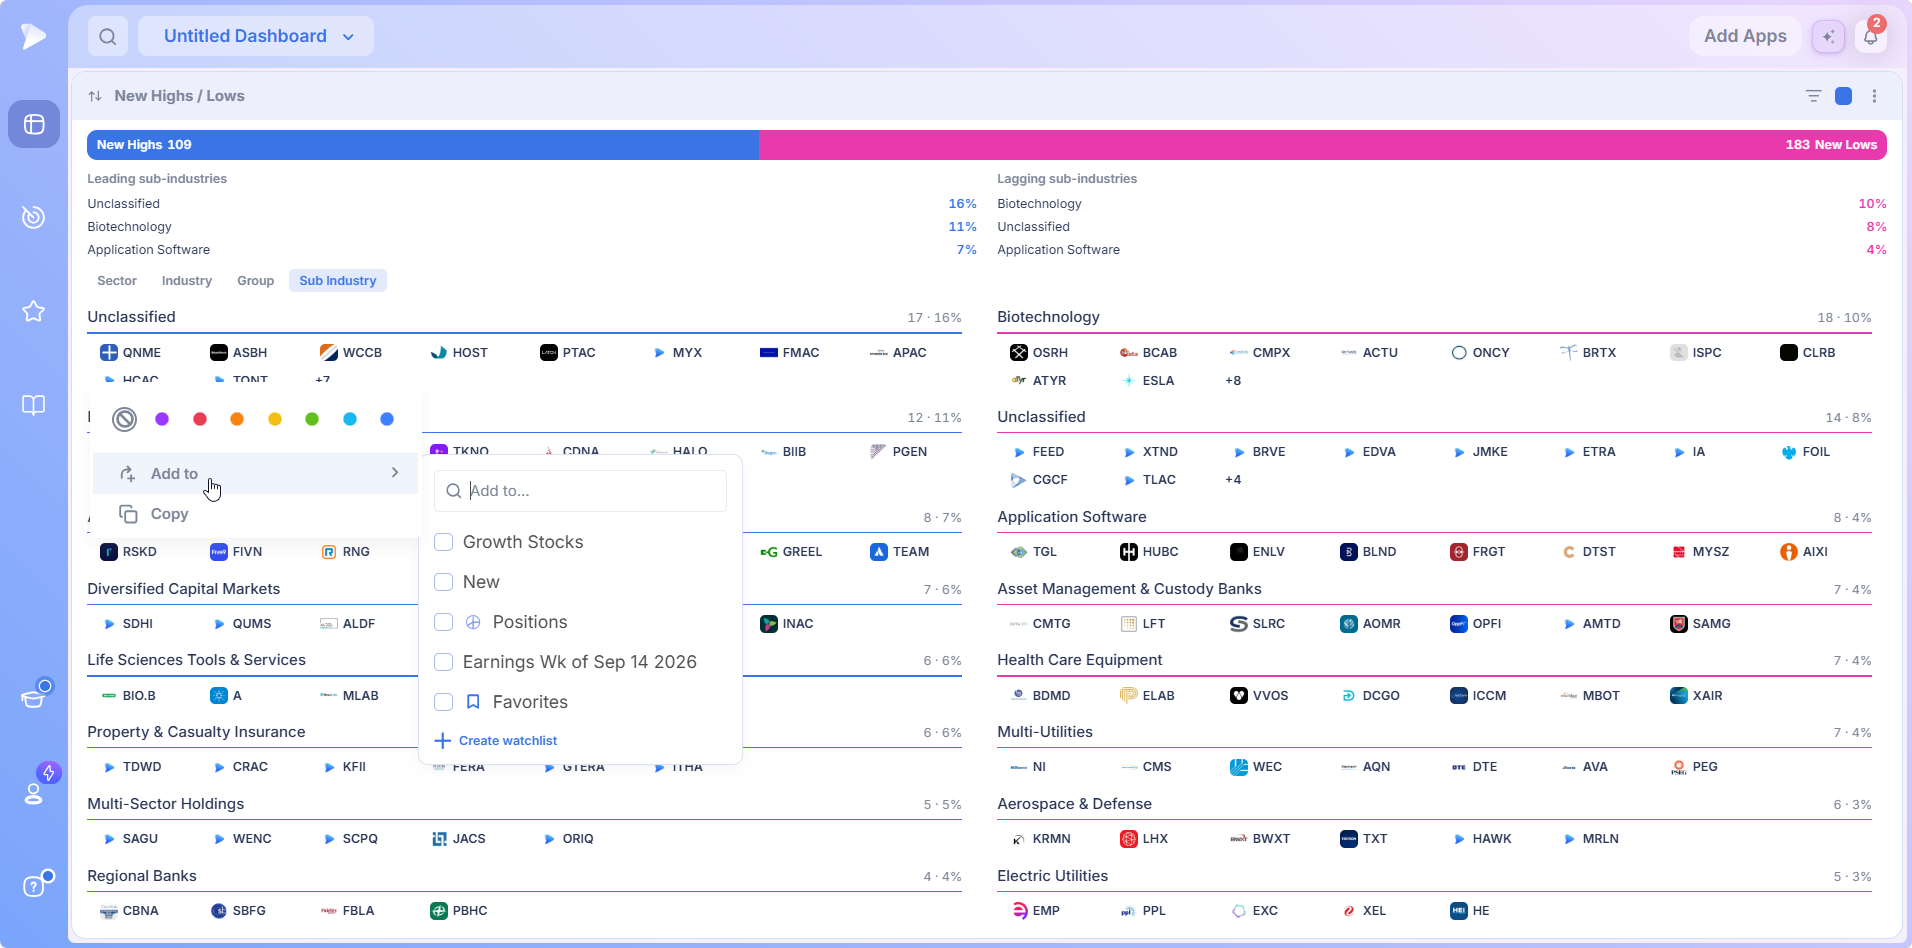
Choose Create watchlist and a dialog asks for a name, an optional folder, a column set that defaults to Recommended, and an optional description. The list is built and the name filed into it without leaving the app: a breadth reading that produces a watchlist rather than a number to remember.
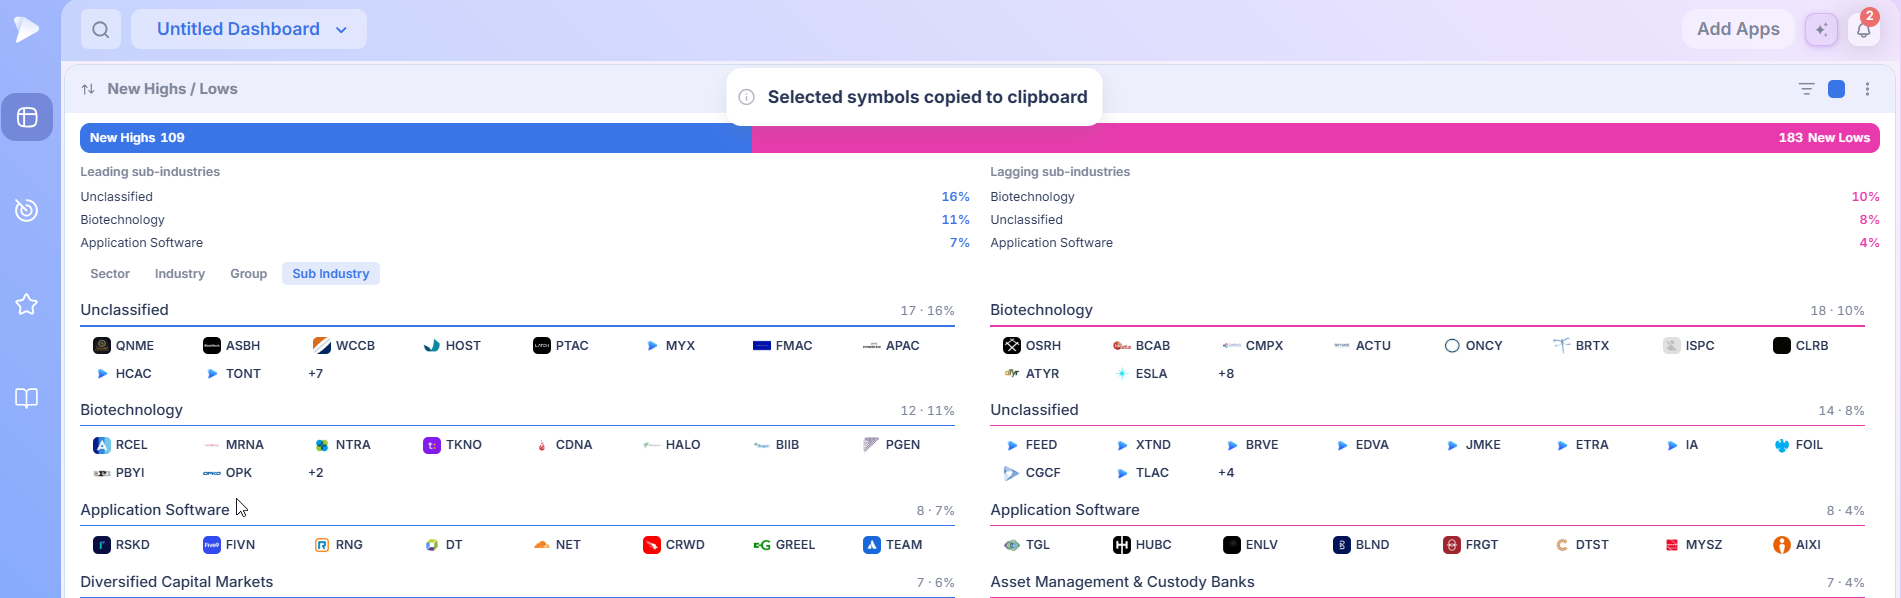
Linked to a Chart
The header carries a color group square. Match a Chart app to that square and every name you click loads there, so working down a list of new highs is a chart review rather than a reading exercise. On Deepvue’s charts the RS Line, stage readings, AVWAP and Enhanced Volume are on hand for judging whether a new high is a breakout worth owning or a name that merely edged past an old level.
Start with Deepvue and turn tomorrow’s new highs list into a watchlist before the open.
Three Routines for New Highs and New Lows
The Liquid Highs Scan
Set the dollar volume floor to your own minimum, switch to the Industry tab, and read the stocks making new highs from the top. The classifications with the most names are where leadership is broad; a lone name at the bottom is either early or noise. Click through the top groups with a chart linked and you have a first pass through the day’s genuine breakouts in minutes. Deepvue’s strategy screens track names ahead of the high.
The Rotation Read
Ignore the names for a moment and read only the leading and lagging lists on the Sector and Group tabs. Two sectors on the left and two different ones on the right is a specific statement about where money is moving, and one you can check against the Theme Tracker or Industry Ranks in the same sitting. When three apps agree, the rotation is real.
The Position Check
Once a day, scan the stocks making new lows for any classification you hold a position in. A group that has begun supplying new lows is a group under distribution, and knowing that before the chart of your own name breaks is worth the ten seconds it takes. Pair it with Stage Analysis to see whether the group’s stage mix is deteriorating too.
Get started with Deepvue to run the position check on every group you hold before the close.
What Makes This New Highs New Lows Dashboard Different
- ✓Names, not just numbers, with every stock behind the count listed under its classification.
- ✓Four levels in one tab row, so a sector read becomes an industry or sub industry read in one click.
- ✓Liquidity filters built in, so the list shows the highs you could actually trade.
- ✓Actionable tickers, from color tags and watchlist adds to a linked chart.
The same sector view also appears as area rather than lists on the Heat Map. No platform is right for everyone, and the honest way to decide is a proper comparison: our Deepvue comparisons hub sets Deepvue against MarketSurge, TradingView, TC2000, TrendSpider, and Finviz feature by feature.
What Traders Say About Deepvue
Each is quoted in the reviewer’s own words and linked to its source.
“Deepvue feels extremely well tailored to momentum trading and CANSLIM investing.”
Five stars on G2, from a verified reviewer. Read it on G2
“Deepvue is the most economical and impressive trading platform I have used.”
From the App Store, November 2024. App Store listing
Deepvue’s dashboards are “a lot more helpful than the market overview pages” found elsewhere.
Dave, Day Trade Review, discussing the dashboards. Full review
“Great team. Great product. Scanning and charts are great.”
u/patentgrinder, writing in r/CANSLIM. Go to the thread
On the company’s reviews page, over 220 verified reviews average 4.8, and 97 percent recommend Deepvue.
What New Highs / Lows Costs
New Highs / Lows is included in Deepvue’s single plan at $49 per month, with monthly and annual options. A list of names is worth more than a count, and here it costs the same.
That one plan covers:
- •The screener and its 1,152 data points.
- •Charts, watchlists, and alerts, all of them unrestricted.
- •Fully customizable dashboards, with every app in the catalog.
- •The Theme Tracker, Market Brief, and AI Terminal, the last with unbounded usage.
Deepvue has one plan, so there are no tiers to compare. For reference, MarketSurge, the legacy platform in this niche, runs $149 per month.
New subscribers also get a one on one onboarding session with a Deepvue team member, an onboarding email series covering platform features and use cases, and weekly live webinars that each go deep on one part of the platform.
Count New Highs and New Lows, Then Name Them
The number of stocks at new highs and new lows has told traders about the health of a market for a century. What it has never done is hand over the list. This app does: the count, the classifications behind it, and every name, filtered to the size you trade and one click from a chart.
Sign up with Deepvue and read tomorrow’s breadth as a list of stocks rather than a pair of numbers.
↑ Back to contentsFrequently Asked Questions
Answered from what the app shows on screen.
What does it mean when a stock hits a new 52 week high?
When a stock hits a new 52 week high, it is trading above any price it reached in the past year, which puts every holder in profit and removes overhead supply from sellers waiting to break even. Momentum and CANSLIM® traders using Deepvue treat stocks making new highs as a hunting ground rather than a warning.
What is the new high new low indicator?
The new high new low indicator is a market breadth measure comparing how many stocks are hitting new highs against how many are hitting new lows. More new highs points to healthy leadership; more new lows points to weakness. Deepvue keeps that count, then names every stock behind it, grouped by classification.
Is a stock making a new high bullish or bearish?
A stock making a new high is generally bullish in the momentum and CANSLIM® frameworks Deepvue is built for: it has cleared overhead supply and every holder is in profit, which tends to invite continuation. Context still matters, and a new high inside a group of new highs is stronger than a lone name.
How do I find stocks making new highs today?
You find stocks making new highs today by placing Deepvue’s New Highs / Lows app on a dashboard, where it fills with the current session automatically. Set a dollar volume floor so thinly traded names drop out, pick the Industry tab, and read from the top, where leadership is broadest.
How do I see which sectors are making new highs?
You see which sectors are making new highs by reading the leading list under the split bar in Deepvue New Highs / Lows, which ranks the classifications supplying the most new highs with each one’s share. Switch to Industry, Group or Sub Industry to see which pocket inside a sector is doing the work.
What do new highs versus new lows tell you about the market?
New highs versus new lows tell you about the market’s breadth. More new highs than new lows means leadership is expanding and new positions have a tailwind; more new lows means distribution is spreading, often before it shows in the index. Deepvue shows both counts and the names behind them.
Should I buy stocks at new highs or wait for a pullback?
Whether you should buy stocks at new highs or wait for a pullback is a strategy question, and both approaches have long track records. What Deepvue’s New Highs / Lows app contributes is context: whether a new high is part of broad participation in its group or a lone name running by itself.
What is the Deepvue New Highs / Lows app?
The Deepvue New Highs / Lows app is a breadth tool for the dashboard that shows how many stocks are at new highs against new lows, ranks the classifications supplying each side, and lists every stock by name at whichever of four levels you choose, with price and volume filters and a quick menu for watchlist adds.
What do the percentages beside each classification mean?
The percentages beside each classification mean its share of the count on that side. In Deepvue New Highs / Lows, a sector at 40 percent under leading sectors supplied 40 percent of the day’s new highs, while one at 25 percent under lagging sectors supplied 25 percent of the new lows.
What is the Unclassified group?
The Unclassified group holds names with no classification assigned yet. Deepvue counts and lists them like any other group so the totals stay complete, but the label is not a sector.
What do the four tabs do?
The four tabs regroup the same stocks at different granularity: Sector for the broadest read, Industry for the level most routines use, Group as a middle view, and Sub Industry for the finest cut. In Deepvue New Highs / Lows the counts at the top stay the same whichever tab you choose.
What does the plus badge after a stock list mean?
The plus badge after a stock list means the classification holds more names than fit in the visible rows, with the badge showing how many more. In Deepvue New Highs / Lows the heading beside it carries the full count.
Can I filter the new highs and new lows list?
Yes, you can filter the new highs and new lows list. The filter icon in Deepvue’s app header opens minimum and maximum fields for last price, average 20 day volume in millions of shares, and average 20 day dollar volume in millions of dollars, with a badge counting active filters and a Reset link.
How do I add a stock from the list to a watchlist?
You add a stock from the list to a watchlist by clicking the plus button beside its ticker. Deepvue’s quick menu offers color tags, an Add to picker listing your watchlists with a search field and a Create watchlist link, and Copy for the symbol.
Can I copy symbols from the list?
Yes, you can copy symbols from the list. Choose Copy in the quick menu and Deepvue puts the ticker on your clipboard and shows a brief confirmation, ready to paste into a note, a spreadsheet or another tool.
Can I open the chart of a stock on the list?
Yes, you can open the chart of a stock on the list. Give the app and a Deepvue Chart app the same color group square, and clicking a name loads it in the chart.
What does this add to the Market Breadth app?
New Highs / Lows adds the names to Market Breadth’s count. Market Breadth shows new highs against new lows as one gauge among five; the Deepvue New Highs / Lows app expands that single reading into the classifications and individual stocks behind it.
What counts as a new high or new low?
What counts as a new high or new low depends on the lookback window, which the app does not display on screen. The traditional breadth measure uses 52 week highs and lows, and Deepvue’s Knowledge Base confirms the definition the app applies.
Is this an intraday tool?
No, New Highs / Lows is not an intraday tool by design. Deepvue serves multi week and multi month positions, and the list is a way to find breakouts and spot distribution on that horizon rather than an intraday trigger.
Is New Highs / Lows included in the standard Deepvue plan?
Yes, New Highs / Lows is included in the standard Deepvue plan. Deepvue has a single plan at $49 per month that covers New Highs / Lows along with the screener, charts, watchlists, alerts, dashboards, the Theme Tracker, the Market Brief, and the AI Terminal.
CAN SLIM® is a registered trademark of O’Neil Capital Management, Inc. (U.S. Reg. No. 3,081,940). Deepvue is not affiliated with, sponsored by, endorsed by, or licensed by O’Neil Capital Management, Inc., Investor’s Business Daily, MarketSurge, or their affiliates. Any reference to CAN SLIM® is for descriptive purposes only. Deepvue’s scores, ratings, and screeners are independently calculated by Deepvue and are not the proprietary ratings of MarketSurge or IBD.