Deepvue Economic Calendar: Every Market Moving Release Before It Hits
The Economic Calendar brings the macro schedule into Deepvue as a dashboard app, listing releases such as inflation prints, jobs reports, GDP and Fed rate decisions, each beside its Actual, Forecast and Previous values.
Every event carries a High, Medium or Low impact rating, and the list filters by impact and country across Day, Week and Month views. Plan entries and position sizes around the releases that actually move markets.
and see what the macro schedule holds before your next entry.
The Deepvue economic calendar, in numbers:
Key Takeaways
Some of the largest candles on any chart have nothing to do with the company underneath them. A CPI print, a payrolls surprise or a Fed press conference can reprice a whole watchlist in seconds, and every one of those moments is scheduled weeks ahead. Being caught out by one is a choice.
The Deepvue economic calendar, a realtime economic calendar built into the platform, puts that schedule on the same dashboard as your screener, charts and watchlists, so a release stops catching you mid trade.
- ✓Actual, Forecast and Previous in one row, with beats and misses colored green and red as figures land.
- ✓High, Medium and Low impact markers on every event, and a filter that shows one tier or combines them, such as High + Medium.
- ✓Day, Week and Month views reaching from this morning’s prints to next month’s Fed decision.
- ✓A searchable country filter that keeps the list on US data or widens it to economies worldwide.
- ✓Times shown in your local zone, so an 8:30 AM Eastern release reads correctly wherever you trade.
- ✓One subscription, nothing extra to unlock. Add the Economic Calendar in Deepvue.
The Economic Calendar at a Glance
- Where to find it
- The Tools list inside Add Apps
- Columns
- Time (Local), Event with impact marker and country flag, Actual, Forecast, Previous
- Views
- Day, Week and Month, with arrows around the date label to move the range
- Impact filter
- All Impact, High, Medium and Low; tiers can be combined, such as High + Medium
- Impact markers
- Red H for high, orange M for medium, gray L for low
- Country filter
- Searchable list with an All Countries option and two letter country codes
- Actual column
- Green for a better than forecast reading, red for a worse one; a dash for events with no figure
- Header controls
- Date stepper, view toggle, impact and country menus, the color group square, then the three dot menu
- Cost
- Included at $49 per month on Deepvue’s one plan
What Is the Deepvue Economic Calendar?
It is a dashboard app that lists scheduled macroeconomic events in a filterable table. One click in the Tools list of Add Apps adds it, and from then on it is part of your board every morning, next to the charts and screens you already use.
That is the whole pitch: a stock market economic calendar where decisions happen, instead of in a browser tab you forget until a ten point candle reminds you.
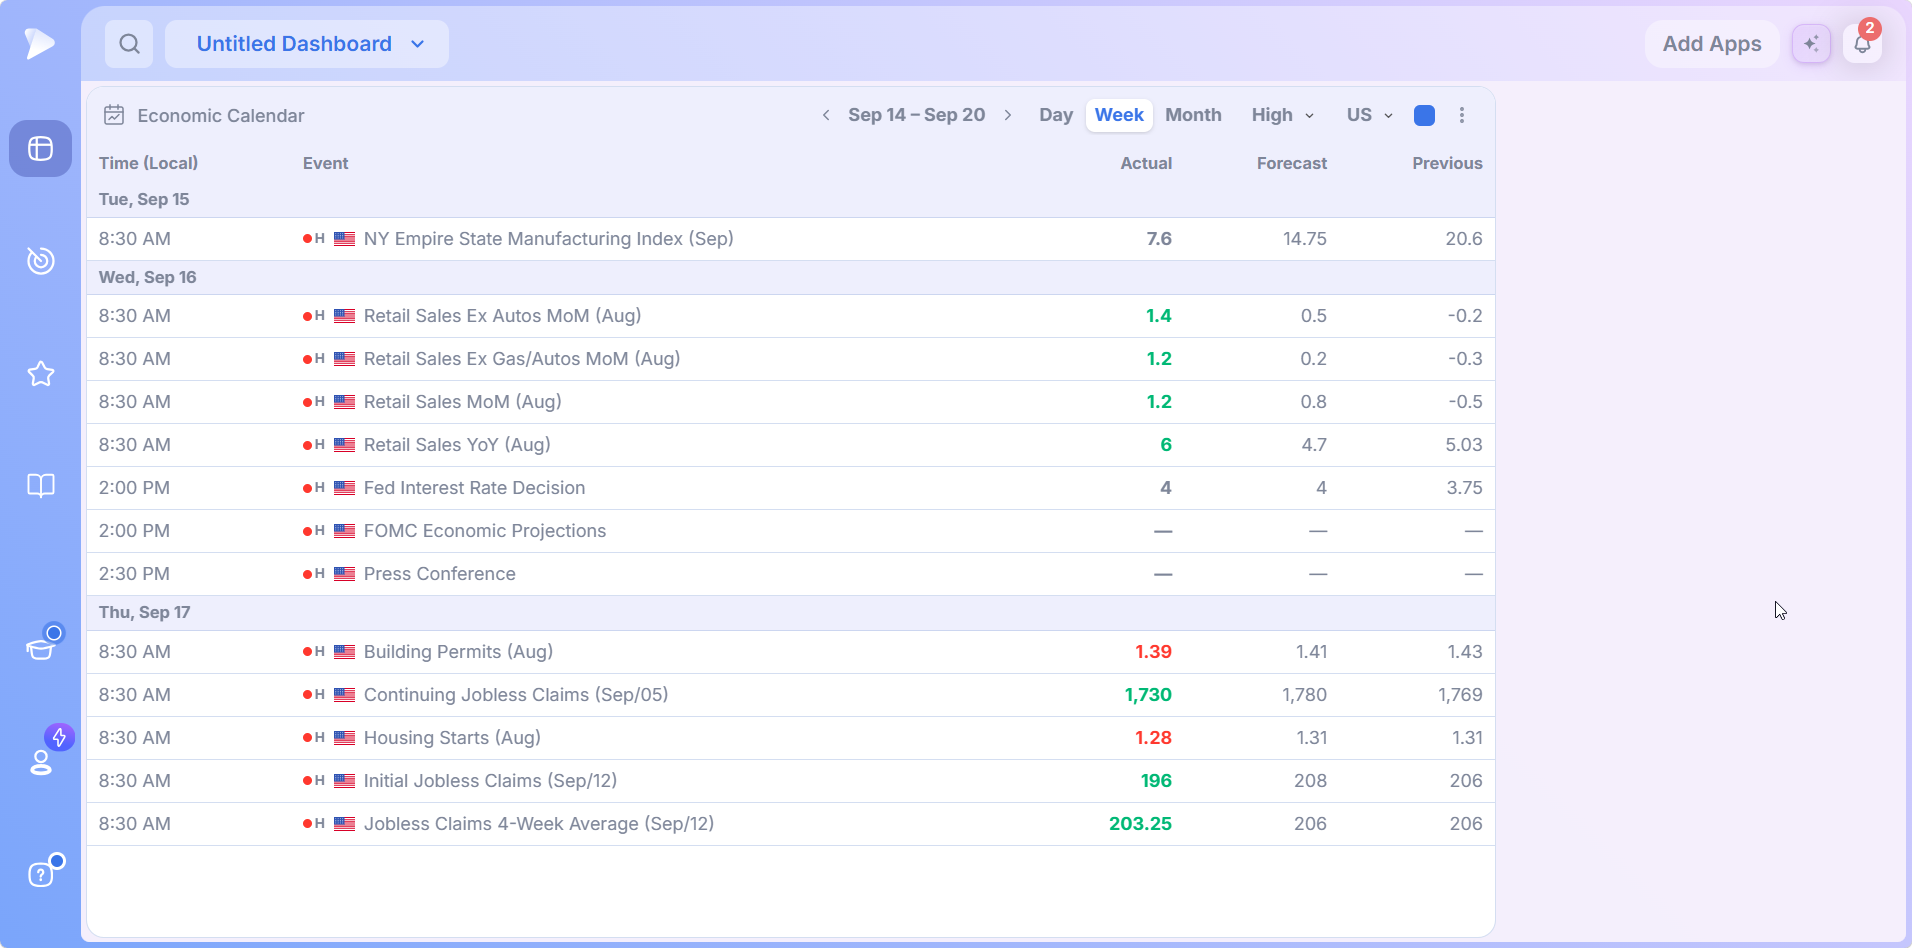
- •Time (Local): when the release is due, in your own time zone.
- •Event: the release name, with a colored impact marker and a country flag.
- •Actual, Forecast and Previous: the three numbers that decide the reaction.
- •Header: a date stepper, the Day, Week and Month toggle, the impact and country menus, plus the color group square, then the three dot menu.
Who the Economic Calendar Is For
- ✓Swing traders holding for days to weeks who need to know which sessions inside a hold carry scheduled event risk. Deepvue for swing traders covers that horizon.
- ✓Position traders holding for weeks to months, for whom a Fed week or a CPI morning is a sizing decision, not a surprise.
- ✓CANSLIM® traders reading market health daily who want macro context attached to every distribution day and follow through day. See Deepvue for CANSLIM® traders.
- ✓Premarket routine builders who want the morning’s releases in the same view as their screens, including the market timing screener category.
- ✓MarketSurge users assembling a modern dashboard, where the economic calendar is one of the apps the legacy platform never offered in this form.
How the Economic Calendar Works
The header controls decide what you see and how far ahead you are looking: a date stepper, the view toggle, an impact filter and a country filter.
Day, Week and Month Views
Day view strips the calendar to a single session, the fastest way to see the economic calendar today before deciding whether to add exposure.
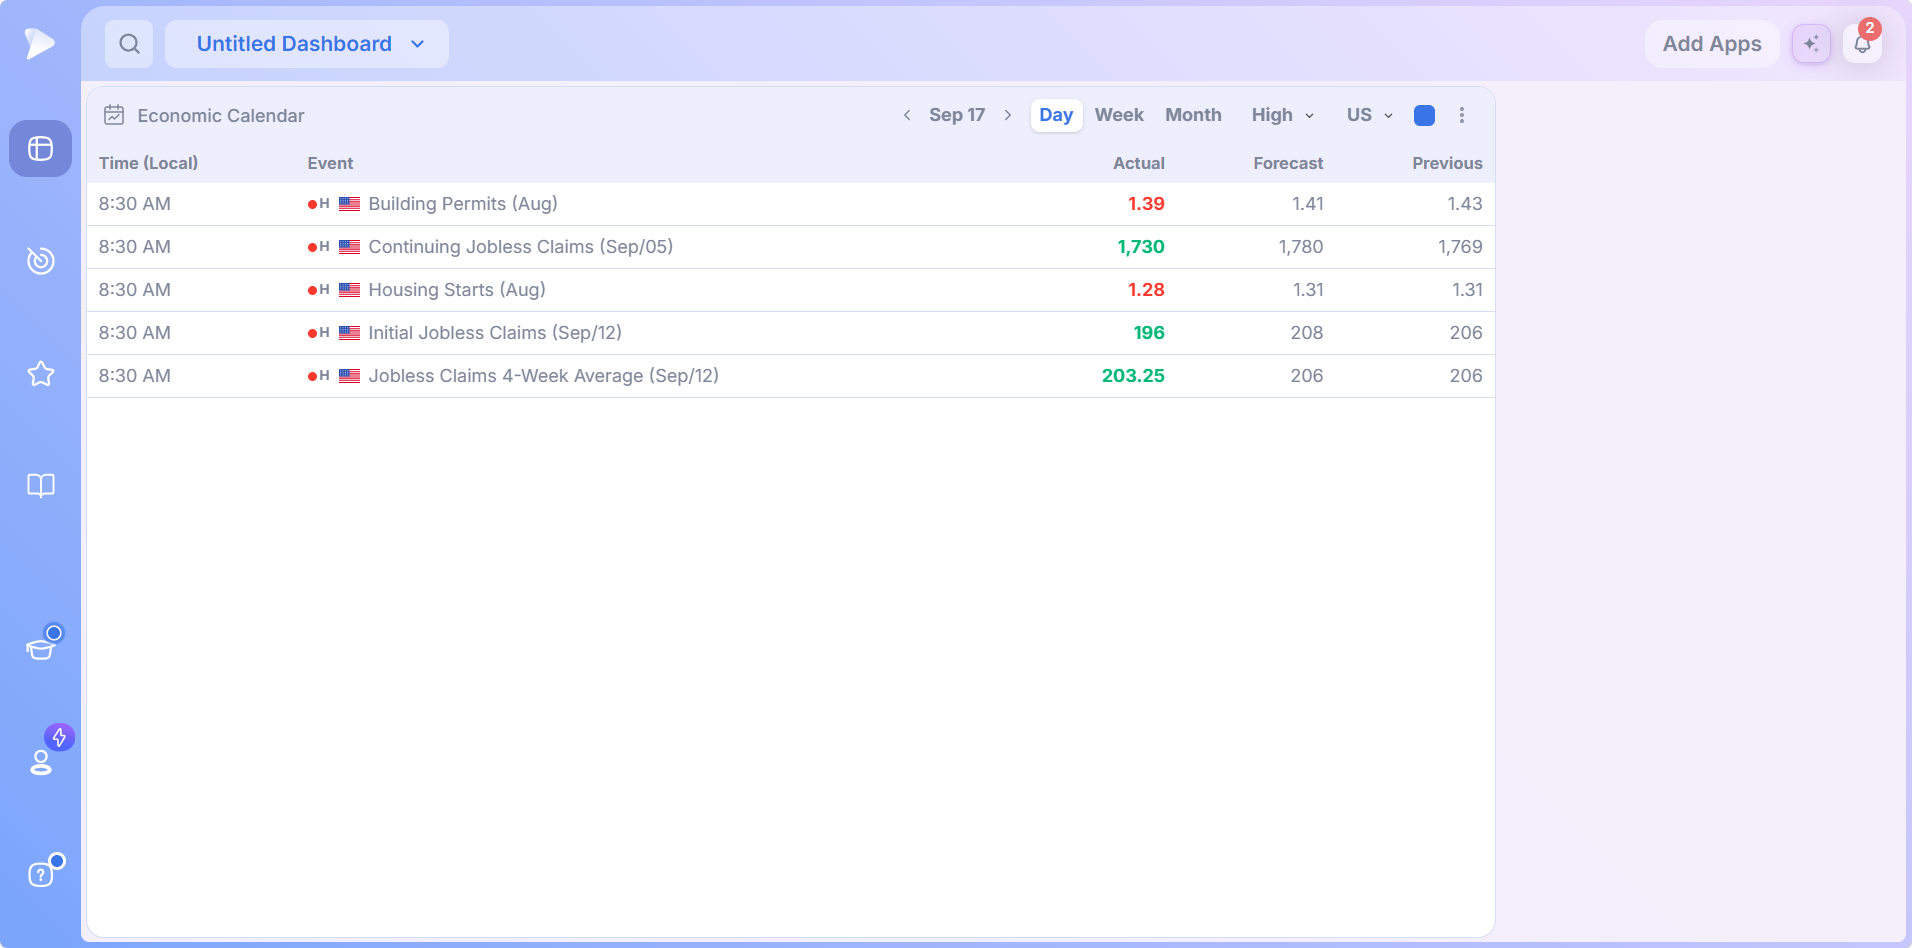
- •Day shows one session, with the date between the arrows.
- •Week groups the economic events this week under date headers, and the arrows step to the next or previous week.
- •Month lays out the full macro schedule in one scrollable list, grouped by date.
Week view is the Sunday night view: step forward and see which day carries the manufacturing survey, which the services number and which the payrolls pair. Step back and you have a record of how last week’s prints landed.
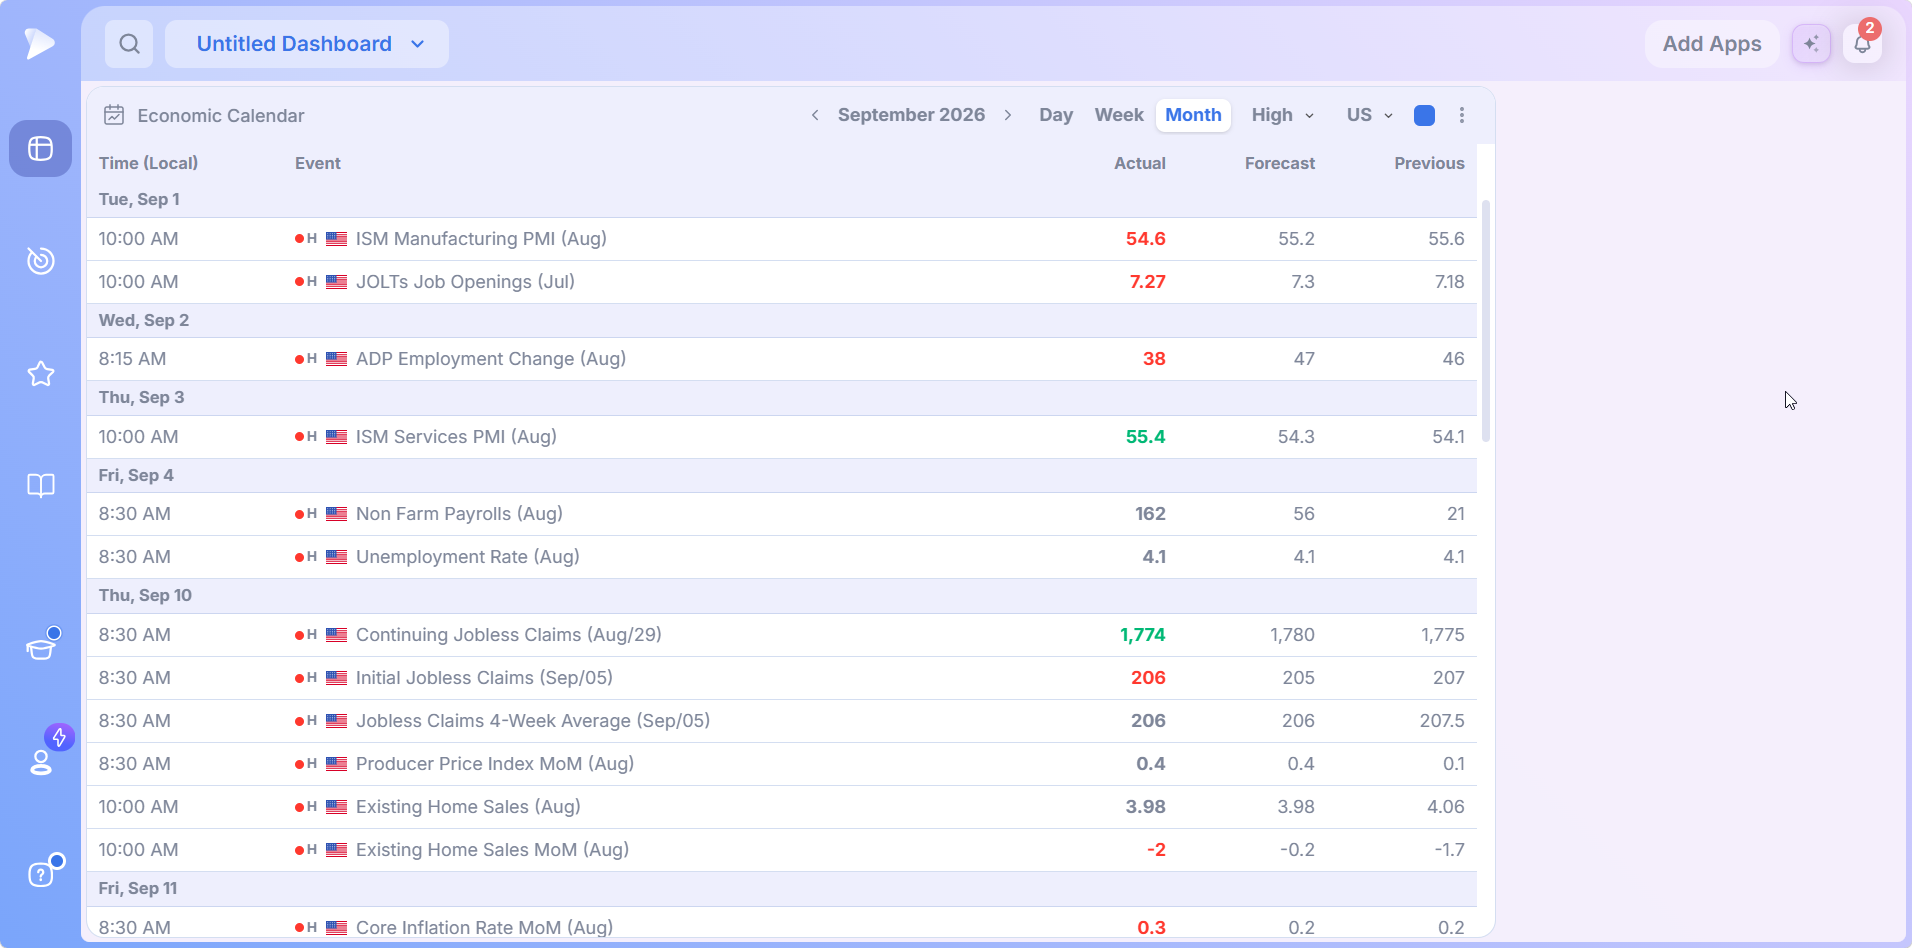
A typical month runs from opening survey data through an inflation cluster, then a Fed block where the rate decision, the projections and the press conference land within half an hour, with housing data days later. For anyone holding positions measured in weeks, this is the view that flags which sessions deserve a lighter book.
Actual, Forecast and Previous in One Row
Three columns do the analytical work:
- •Forecast: the consensus estimate published before the release.
- •Previous: the prior reading of the same series, for trend.
- •Actual: what the economy delivered, colored green when it came in better than forecast and red when it came in worse.
Markets rarely react to the number itself. They react to the gap between Actual and Forecast, and seeing all three side by side makes that gap readable in a second. Events with no numeric reading, such as Fed speeches, the Beige Book or a press conference, show a dash in each column, and some series carry no published forecast at all.
High, Medium and Low Impact Ratings
Every event carries a colored marker, and the header filter decides which tiers appear. On All Impact you see everything scheduled, and the difference between tiers is dramatic.
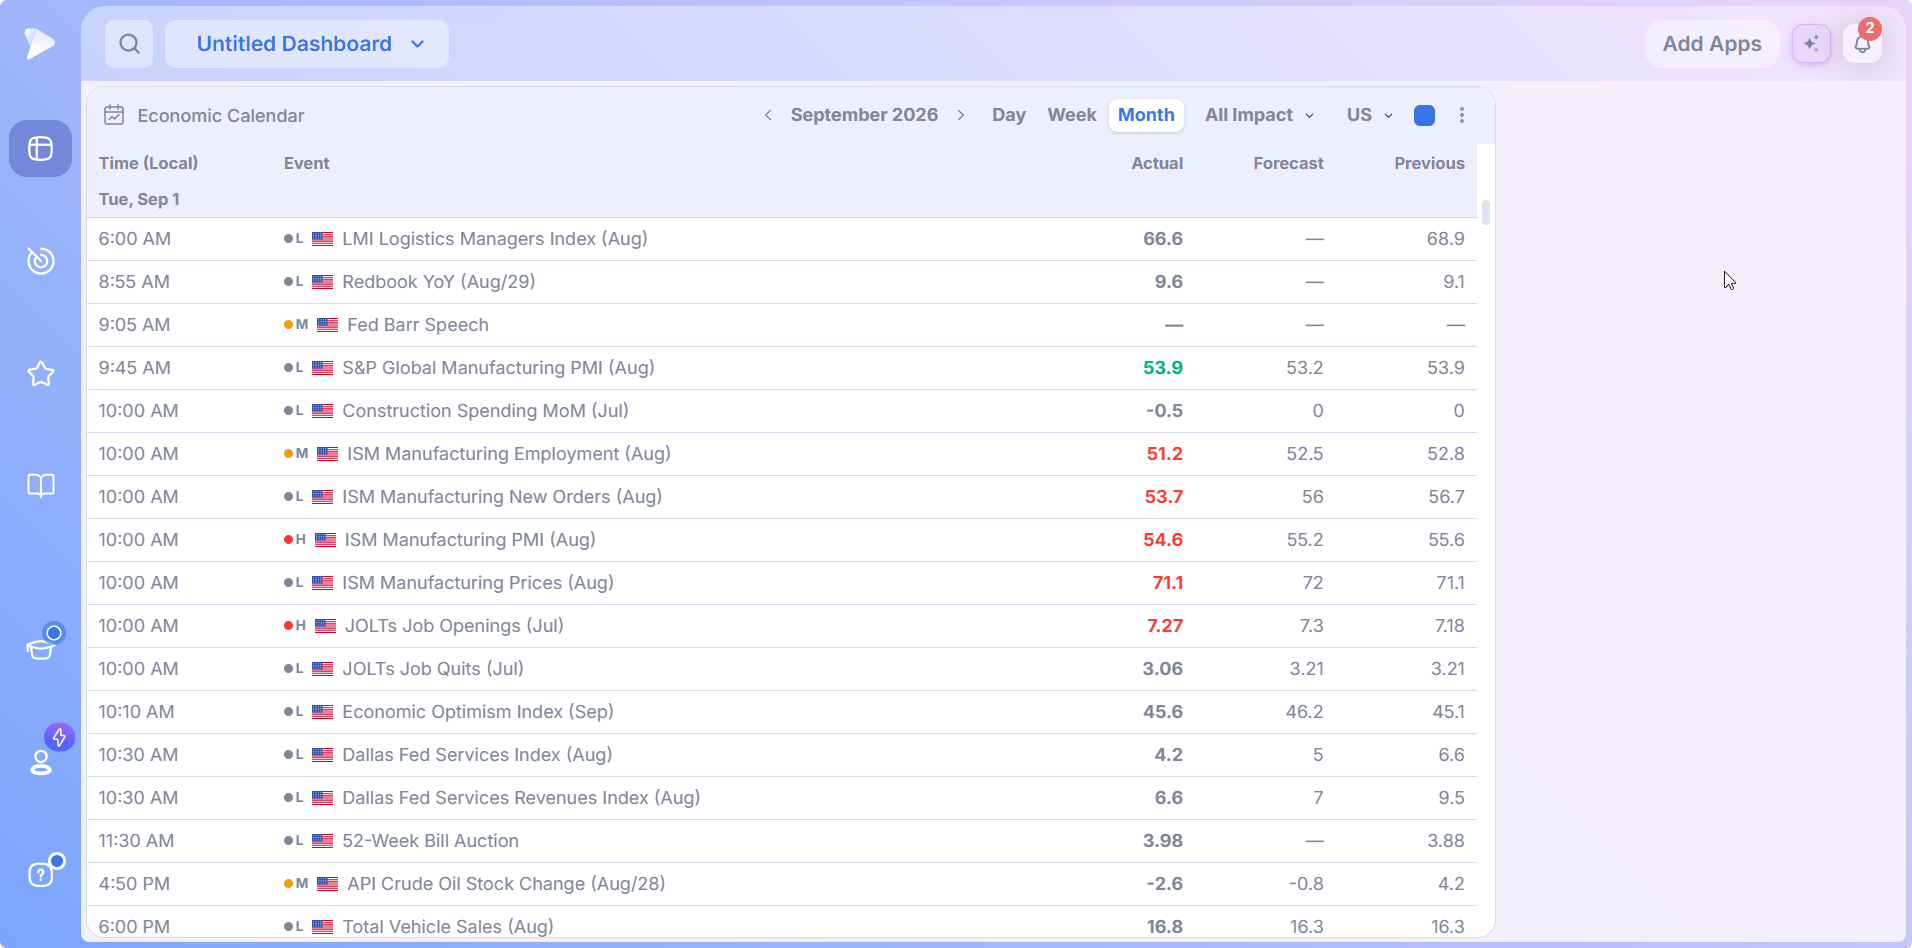
- •Red H, high impact: inflation data, the jobs report, GDP, ISM surveys and the Fed decision block.
- •Orange M, medium impact: Fed speeches, ADP, the Beige Book, factory orders and the weekly oil inventory reports.
- •Gray L, low impact: regional surveys, mortgage indexes, bill auctions and similar background data.
Open the impact menu and pick a tier. A session with more than a dozen releases on All Impact can shrink to two or three on High, which is exactly the high impact news a growth trader plans around.
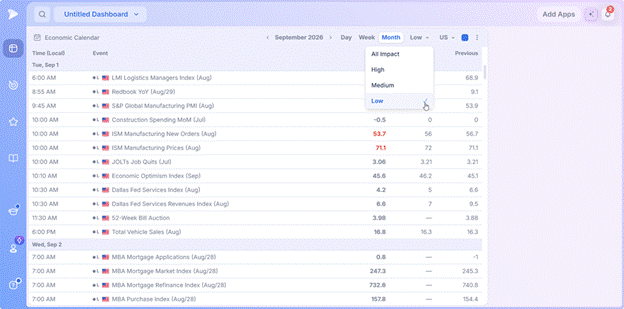
Tiers also combine. Select High and Medium together and the header reads High + Medium, bringing in the second tier without the low impact noise.
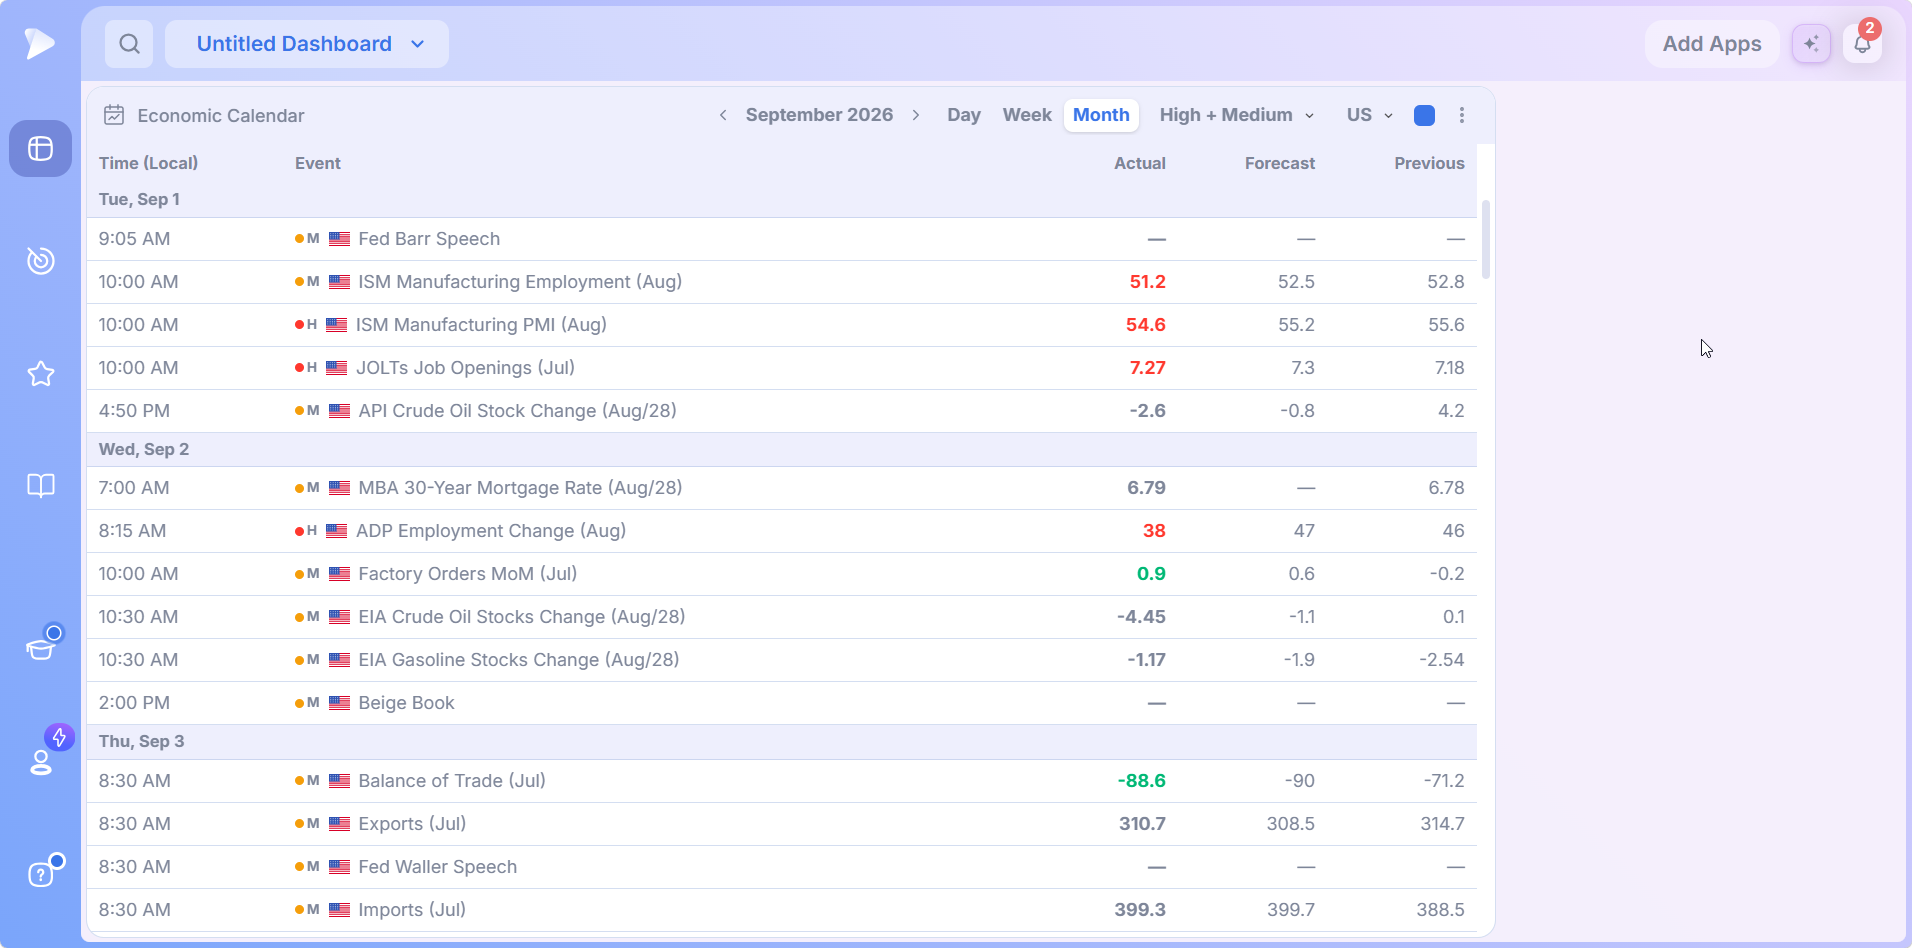
Growth traders who care only about prints that move an index can stay on High. Anyone tracking a theme with a macro driver, oil and gas or housing, widens the net deliberately. Seeing all three tiers also shows how crowded a session really is: several surveys, two Fed speakers and a bond auction before lunch trade differently from one quiet housing number, even when each day has only one High row.
Open a Deepvue account and see what the next four weeks have scheduled against your open positions.
Filtering by Country
The country menu scopes the calendar geographically. It opens with a search field, an All Countries option and an alphabetical list of economies, each with its two letter code.
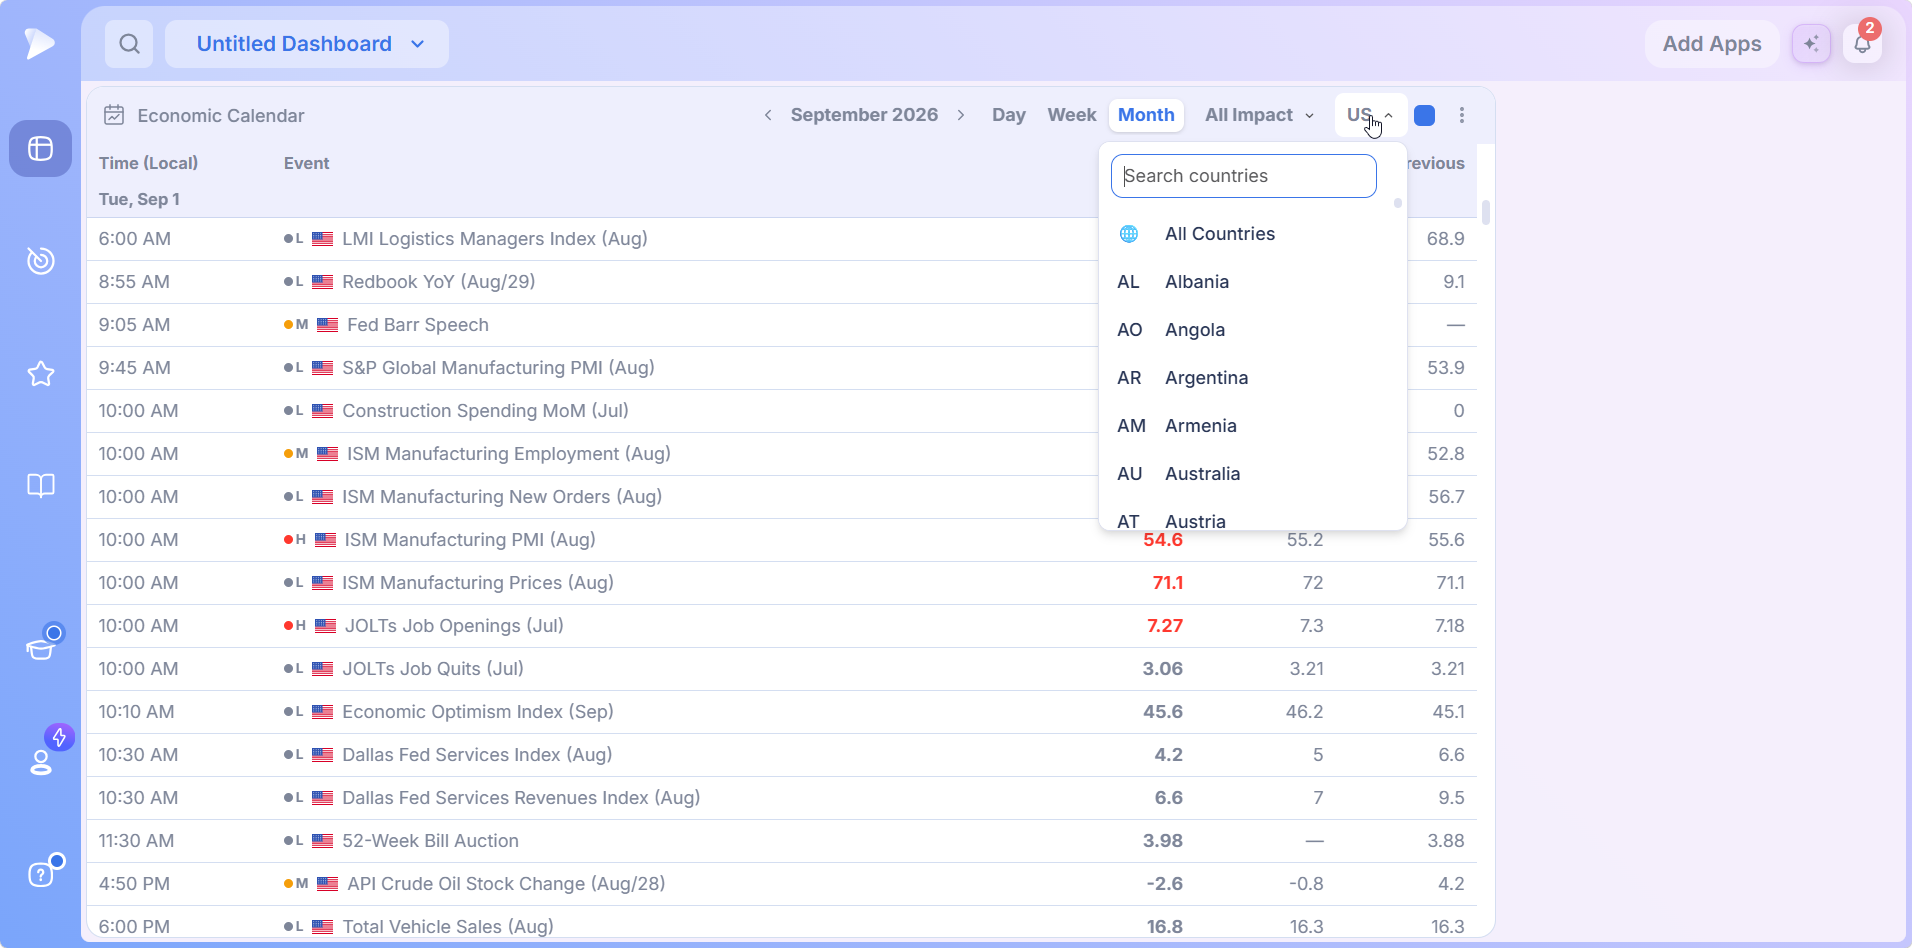
Each event row carries its country’s flag, so a multi country view stays readable. US focused traders, which is most of Deepvue’s audience, can pin the calendar to US and never see noise from abroad; the coverage is there when a theme has an international driver.
What Shows Up on a Stock Market Economic Calendar
The releases fall into a handful of families, and knowing which family a print belongs to is half of knowing how to trade around it.
| Category | Typical releases | Why traders watch |
|---|---|---|
| Inflation | Inflation Rate and Core Inflation Rate, Core PCE Price Index, Producer Price Index | Drives rate expectations, which set the multiple growth stocks trade at |
| Jobs | Non Farm Payrolls, Unemployment Rate, JOLTs Job Openings and Quits, ADP Employment Change, jobless claims | The Fed’s other mandate; hot or cold prints reprice the whole curve |
| Growth and trade | GDP Growth Rate, Durable Goods Orders, Factory Orders, Balance of Trade, Exports and Imports | Confirms or contradicts the earnings growth the market is pricing |
| Federal Reserve | Fed Interest Rate Decision, FOMC Economic Projections, Press Conference, Beige Book, Fed speeches | The single largest scheduled source of index level volatility |
| Housing | Building Permits, Housing Starts, Existing Home Sales, mortgage rates and applications | Rate sensitive leading indicators and a theme in their own right |
| Surveys and sentiment | ISM Manufacturing and Services PMI, S&P Global Manufacturing PMI, Empire State Manufacturing Index, consumer confidence and sentiment | Forward looking reads that often move markets more than hard data |
| Energy and consumer | API and EIA crude oil and gasoline inventories, Retail Sales, Total Vehicle Sales, Redbook | Direct drivers for oil and gas and consumer themes |
A useful habit: when a stock on your watchlist gaps with no company news, check which family printed that morning before assuming the move is stock specific. A semiconductor name selling off at 10:01 AM on an ISM miss is telling you about the tape, not the company.
Reading a Week on the Calendar
Work across a week of released rows and a story assembles itself. Read each family in turn and ask two questions of every print: did it beat or miss its forecast, and is it better or worse than its previous reading?
- •Manufacturing and services surveys tell you which side of the economy is expanding and which is cooling.
- •Jobs data tells you whether the labor market is tightening, steady or loosening.
- •Inflation prints tell you which way rate expectations are likely to lean.
- •Fed rows show the decision itself, with a forecast against the previous rate, so you can see what the market expects before the announcement.
Stitch those answers together and you have the macro picture without opening a news site. A different week produces a different verdict, which is the point of doing it every week.
Three Ways Traders Work the Economic Calendar
Plan the Week Before It Starts
Sunday evening, open Week view and step forward to see the economic events this week holds. Count the High rows, note which sessions carry them, and decide in advance where fresh entries make sense. A breakout that triggers at 9:45 AM on CPI morning is a different bet from the identical setup on a quiet Thursday. Pair the calendar with the Market Brief and you cover both halves of preparation: what is scheduled, and how the market has been behaving into it.
Size Positions Around Scheduled Volatility
Before the open, a look at the economic calendar today in Day view tells you whether you are holding into anything. Most high impact US releases land before the open or inside the first ninety minutes, in the 8:30 AM and 10:00 AM Eastern clusters. If you are holding into one, the honest question is whether your stop survives the range those prints produce. Some traders trim ahead of a Fed decision and rebuild after the press conference; others keep full size but plan for a wider reaction.
Either way the decision is deliberate, which is most of the benefit. The Position Size Calculator is in the same Tools group, and running the two on one dashboard is the point of having both.
Connect the Macro Tape to Market Health
CANSLIM® style traders track distribution days, follow through days and the character of leading stocks. Economic releases are frequently the trigger behind those tape events: a distribution day on a hot inflation print carries different information than one appearing out of nowhere.
Keep the calendar beside Market Breadth, New Highs / Lows and Stage Analysis, and a list of dates becomes context for every market health signal you follow. When a release moves a stock you own, the AI Terminal explains why without leaving the chart.
Start with Deepvue and build next week’s plan around what is actually on the schedule.
How to Add the Economic Calendar to a Dashboard
Head to your morning board in the Dashboard module, or create a new one.
Click Add Apps at the top right.
Click Economic Calendar in the Tools group. It lands on the board with every header control ready.
Choose a view and filters: Day, Week or Month, the impact tiers you want, and US or another country.
Choose a color group from the header square, optional, if you organize the board by groups.
What Makes the Deepvue Economic Calendar Different
Standalone calendar sites work, but they are a tab switch away from your decisions, often wrapped in ads, at the moment attention is most expensive. A realtime economic calendar inside your platform changes that.
- ✓Next to your charts and screens, so the 8:30 AM number, your premarket movers and the chart you had open all react in one window.
- ✓Beats and misses in color, green or red in the Actual column as soon as a figure lands.
- ✓Combinable impact tiers, from High alone to High + Medium to everything.
- ✓Built on live data: Deepvue streams 568 of its 1,152 data points over WebSocket, so the calendar runs inside an environment made for live markets rather than page refreshes.
- ✓Part of a trading workflow, alongside the Position Size Calculator, Market Brief and market breadth tools that turn a schedule into a plan.
Each hop between sites is small; across a trading year they add up to a habit of finding out late. To see how Deepvue compares as a whole platform with MarketSurge, TradingView, TrendSpider, TC2000 and Finviz, open the Deepvue comparisons hub and read the matchups one by one.
What Traders Say About Deepvue
Verdicts from four sources on the platform this app belongs to, each quoted verbatim.
“Deepvue consolidates all my information streams into one centralized hub.”
A customer testimonial on deepvue.com. See the testimonial
“DeepVue’s dashboards are a lot more actionable and customizable than what most trading platforms offer.”
Dave, reviewing Deepvue for Day Trade Review with a 4.7 score. Read the full review
“It’s my favorite charting platform over everything else so far.”
u/lmaobihhhh, replying in r/swingtrading. Open the Reddit thread
Praise for “the multitude of screeners and the allowable customization” on the platform.
An App Store reviewer, April 2026. Visit the App Store
The Deepvue reviews wall counts more than 220 verified reviews averaging 4.8 out of 5, and 97 percent of those reviewers would recommend Deepvue.
Where the Economic Calendar Connects
- •The Earnings Calendar for company report dates: one app answers what the market faces this week, the other what your stocks face.
- •The Market Brief for how the market has been trading into the next release.
- •New Highs / Lows and Market Breadth for how the tape took a print.
- •The Position Size Calculator for trimming or sizing ahead of a high impact session.
- •The AI Terminal to explain a move a release set off.
What the Economic Calendar Costs
The Economic Calendar is part of Deepvue’s single plan at $49 per month, with monthly and annual options. Every view, filter and country is included, which is what makes a schedule worth opening every morning.
That one plan covers:
- •The screener and its 1,152 data points.
- •Charts, watchlists, and alerts, all of them unrestricted.
- •Fully customizable dashboards, with every app in the catalog.
- •The Theme Tracker, Market Brief, and AI Terminal, the last with unbounded usage.
Deepvue has one plan, so there are no tiers to compare. For reference, MarketSurge, the legacy platform in this niche, runs $149 per month.
New subscribers also get a one on one onboarding session with a Deepvue team member, an onboarding email series covering platform features and use cases, and weekly live webinars that each go deep on one part of the platform.
Keep the Schedule in Front of You
Macro events are the one source of volatility that announces itself in advance. An economic calendar for stock trading in your daily workspace turns that notice into something you use: impact ratings that separate the two prints that matter from the fifteen that do not, three columns that make a surprise obvious, and views reaching from this morning to next month’s Fed meeting.
Get Deepvue at $49 per month, add the Economic Calendar to your dashboard, and make the schedule the second thing you read each morning, right after the market itself.
↑ Back to contentsFrequently Asked Questions
Settled before the calendar joins your morning routine.
What is an economic calendar?
An economic calendar is a schedule of upcoming data releases and policy events, such as inflation reports, jobs numbers, GDP and central bank decisions, with the time each is due. The Deepvue Economic Calendar also shows the forecast, the previous reading and the actual figure once released.
What is the most important economic data for the stock market?
The most important economic data for the stock market is inflation, the monthly jobs report, GDP, the ISM surveys and anything attached to a Fed meeting. Deepvue rates those releases High impact, since they can reprice an entire index in minutes rather than moving one sector.
What time are economic data releases?
Economic data releases in the US mostly land at 8:30 AM or 10:00 AM Eastern, with Fed decisions in the early afternoon and a press conference half an hour later. The Deepvue Economic Calendar shows every event in your local time, so the schedule reads correctly wherever you are.
How do economic events affect stock prices?
Economic events affect stock prices mainly through interest rate expectations. Hot inflation or strong jobs data pushes expected rates higher, which compresses the multiple growth stocks trade at. The reaction comes from the gap between actual and forecast, which the Deepvue calendar shows side by side.
Why does CPI move the stock market?
CPI moves the stock market because it is the headline inflation reading, and inflation sets the path of interest rates. A hotter print pushes rates up and hurts growth multiples; a cooler one does the reverse. Deepvue rates CPI High impact and shows Actual against Forecast the moment it prints.
What happens on the calendar during an FOMC meeting?
During an FOMC meeting, the calendar shows a cluster: the rate decision, the FOMC economic projections and the press conference within about half an hour, all tagged High impact in Deepvue. The decision row carries a forecast against the previous rate, so you can see what the market expects.
Should I trade around high impact news?
Whether to trade around high impact news is a risk decision, not a rule. Reactions to the gap between actual and forecast can be violent, so the Deepvue Economic Calendar exists to make holding into a release deliberate. Some traders trim before a Fed decision; others keep size but plan for a wider range.
Can I see economic events for the week ahead?
Yes, you can see economic events for the week ahead. Deepvue’s Week view groups the economic events this week under date headers with arrows to step forward, and Month view lays out the whole schedule in one scrollable list. Reviewing the week ahead on Sunday evening is the routine Week view suits best.
What is the best economic calendar for stock trading?
The best economic calendar for stock trading is the one next to where you make decisions, with the noise stripped away. Free calendars cover the same core releases, so impact filtering, country scoping and integration decide it. Deepvue puts the calendar beside your charts, screens and watchlists on one dashboard.
Does the Deepvue Economic Calendar update as data is released?
Yes, the Deepvue Economic Calendar updates as data is released, working as a realtime economic calendar. The figure appears in the Actual column once published, colored green or red against its forecast, and past sessions keep their filled rows, so the calendar doubles as a record of how recent prints landed.
Why are some Actual figures green or red?
Some Actual figures are green or red because the Deepvue Economic Calendar compares each release with its forecast. Green marks a better than expected reading and red a worse one, so beats and misses stand out without mental arithmetic; other figures print in dark text.
Why do some events show a dash instead of numbers?
Some events show a dash instead of numbers because they have no numeric reading, such as Fed speeches, the Beige Book or a press conference. In the Deepvue Economic Calendar a dash also appears under Forecast for series with no published consensus estimate.
Which economic releases move the stock market most?
The economic releases that move the stock market most are the ones Deepvue rates High: inflation data, Non Farm Payrolls and unemployment, GDP, ISM surveys and the Fed decision block. Medium impact events like ADP, Fed speeches and the Beige Book matter when they shift expectations for a High release.
How do I add the Economic Calendar to my dashboard?
You add the Economic Calendar to your dashboard by opening Add Apps and clicking Economic Calendar in the Tools group. It shows up immediately, with the Deepvue date stepper, view toggle and impact and country filters ready to use.
Can I filter the economic calendar by impact?
Yes, you can filter the economic calendar by impact. The Deepvue header menu offers All Impact, High, Medium and Low, and each row carries its own H, M or L marker. On a busy session, a list of more than a dozen releases can shrink to two or three on High.
Can I combine impact levels, like High and Medium?
Yes, you can combine impact levels, like High and Medium. Select both in the Deepvue impact menu and the header reads High + Medium, adding Fed speeches, oil inventories and similar second tier releases without the low impact background data.
Can I see economic events for countries outside the US?
Yes, you can see economic events for countries outside the US. The Deepvue country menu has a search field, an All Countries option and an alphabetical list of economies, and each row shows its flag. Most Deepvue users keep the filter on US, but global coverage is one click away.
What do the Actual, Forecast, and Previous columns mean?
The Actual, Forecast, and Previous columns mean the released figure, the consensus estimate and the last reading of the same series. Market reactions come from Actual against Forecast, while Previous shows the trend. The Deepvue calendar keeps all three in one row.
What is the difference between the Economic Calendar and the Earnings Calendar?
The difference between the Economic Calendar and the Earnings Calendar is scope. The Economic Calendar tracks macro releases and policy events affecting the whole market; the Earnings Calendar, also in the Deepvue Tools group, tracks company report dates. Growth traders typically run both.
How do growth stock traders use an economic calendar?
Growth stock traders use an economic calendar in three main ways: counting high impact sessions before committing to new entries, sizing positions so a scheduled release cannot do outsized damage, and attaching macro context to market health signals. Deepvue keeps all three on one dashboard.
Is the Economic Calendar included in the standard Deepvue plan?
Yes, the Economic Calendar is included in the standard Deepvue plan. Deepvue has a single plan at $49 per month that covers the Economic Calendar along with the screener, charts, watchlists, alerts, dashboards, the Theme Tracker, the Market Brief, and the AI Terminal.
CAN SLIM® is a registered trademark of O’Neil Capital Management, Inc. (U.S. Reg. No. 3,081,940). Deepvue is not affiliated with, sponsored by, endorsed by, or licensed by O’Neil Capital Management, Inc., Investor’s Business Daily, MarketSurge, or their affiliates. Any reference to CAN SLIM® is for descriptive purposes only. Deepvue’s scores, ratings, and screeners are independently calculated by Deepvue and are not the proprietary ratings of MarketSurge or IBD.