Deepvue Earnings Calendar: Every Report and Every Surprise, One Week at a Glance
The Earnings Calendar is a Deepvue app that lays out a full week of company reports in day columns. Upcoming reports show a Confirmed or Estimated status with expected EPS and sales growth; finished ones carry a Beat, Miss, Big beat, Big miss or In line label with the surprise.
Day headers average each session’s results, a hover card names every ticker with its numbers, and a Table view plus five range filters keep even the busiest week of earnings readable.
and know which of your stocks report before the week starts.
The Deepvue earnings calendar, in numbers:
Key Takeaways
Earnings season is when growth stocks earn their label, and it is also when the schedule becomes a risk document. One morning in a busy week can carry two dozen reports before the bell, and any of them could be a name you hold. Getting surprised by that is expensive and entirely avoidable.
The Deepvue earnings calendar handles both halves of the job. Before a report, the card gives the date, a Confirmed or Estimated status and the growth consensus expects. After it, the same card shows the verdict, with earnings beats and misses graded beside the ticker.
- ✓Two views of one week: Calendar draws report cards in day columns; Table turns them into sortable rows.
- ✓Eight card labels cover the full lifecycle: Confirmed, Estimated, Beat, Miss, Big beat, Big miss, In line and Reported.
- ✓Day headers read the tape, averaging EPS growth, sales growth and surprise for reported days, and counting reports per sector for days ahead.
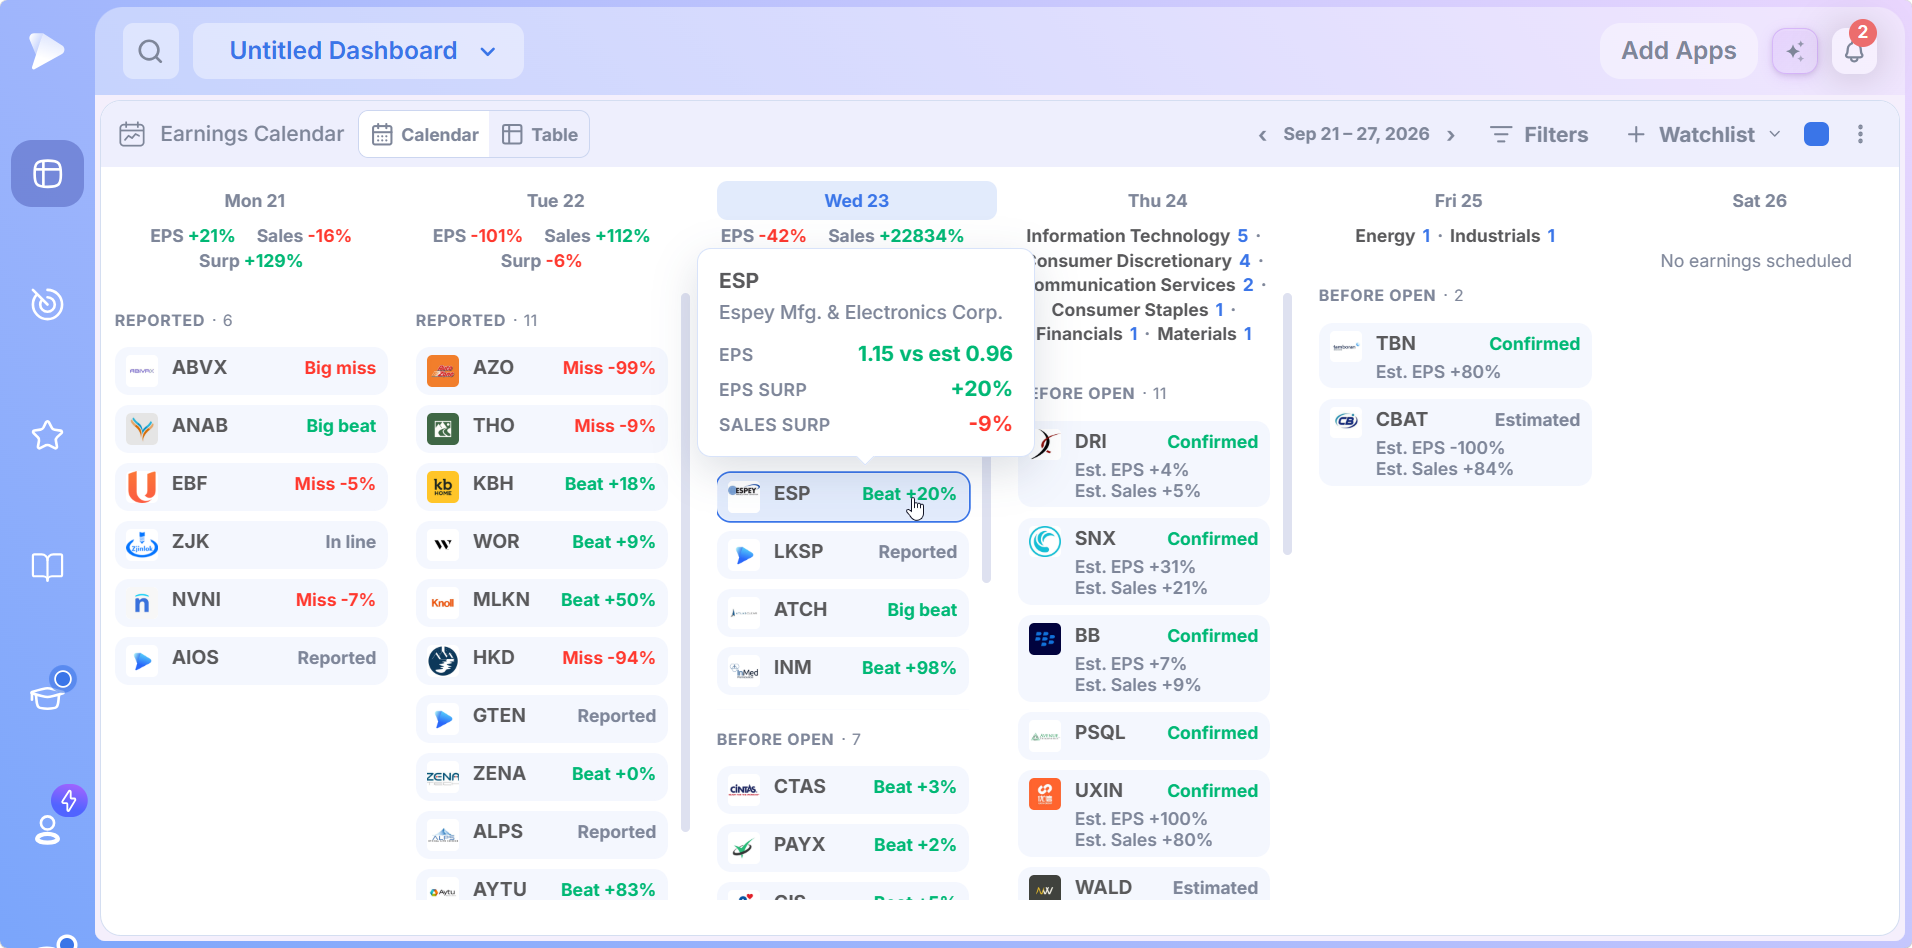
- ✓Hover any ticker for the company name, EPS against its estimate, and both surprise percentages.
- ✓Five range filters on market cap, growth and surprise cut a crowded day to the handful of names you could trade.
- ✓Included, not an add on. Open the Earnings Calendar in Deepvue.
Earnings Calendar at a Glance
- Views
- Calendar cards or a Table, switched in the header
- Day columns
- Monday through Sunday, today highlighted, weekends marked No earnings scheduled
- Sections
- Reported and Before Open or After Close groups, each with a count
- Card labels
- Confirmed, Estimated, Beat, Miss, Big beat, Big miss, In line, Reported
- Day headers
- Average EPS growth, sales growth and surprise for reported days; sector counts for upcoming days
- Hover card
- Company name, EPS vs estimate, EPS surprise, sales surprise
- Filters
- Five min and max ranges plus checkboxes for which metrics and stats display, with a Reset button
- Other header controls
- Week stepper, + Watchlist menu (Regular or With Sections), three dot menu and color group square
- Where to find it
- Add Apps, Tools section
- Cost
- $49 per month, the only Deepvue plan
What Is the Deepvue Earnings Calendar?
Think of it as a dashboard app dedicated to company report dates and results, found in the Tools group of Add Apps. Most of what passes for a stocks earnings calendar elsewhere is a static list of dates, refreshed when you remember to visit. This one works inside the dashboard you already use, and the difference shows the first morning a card flips from Confirmed to Beat while your chart is open next to it.
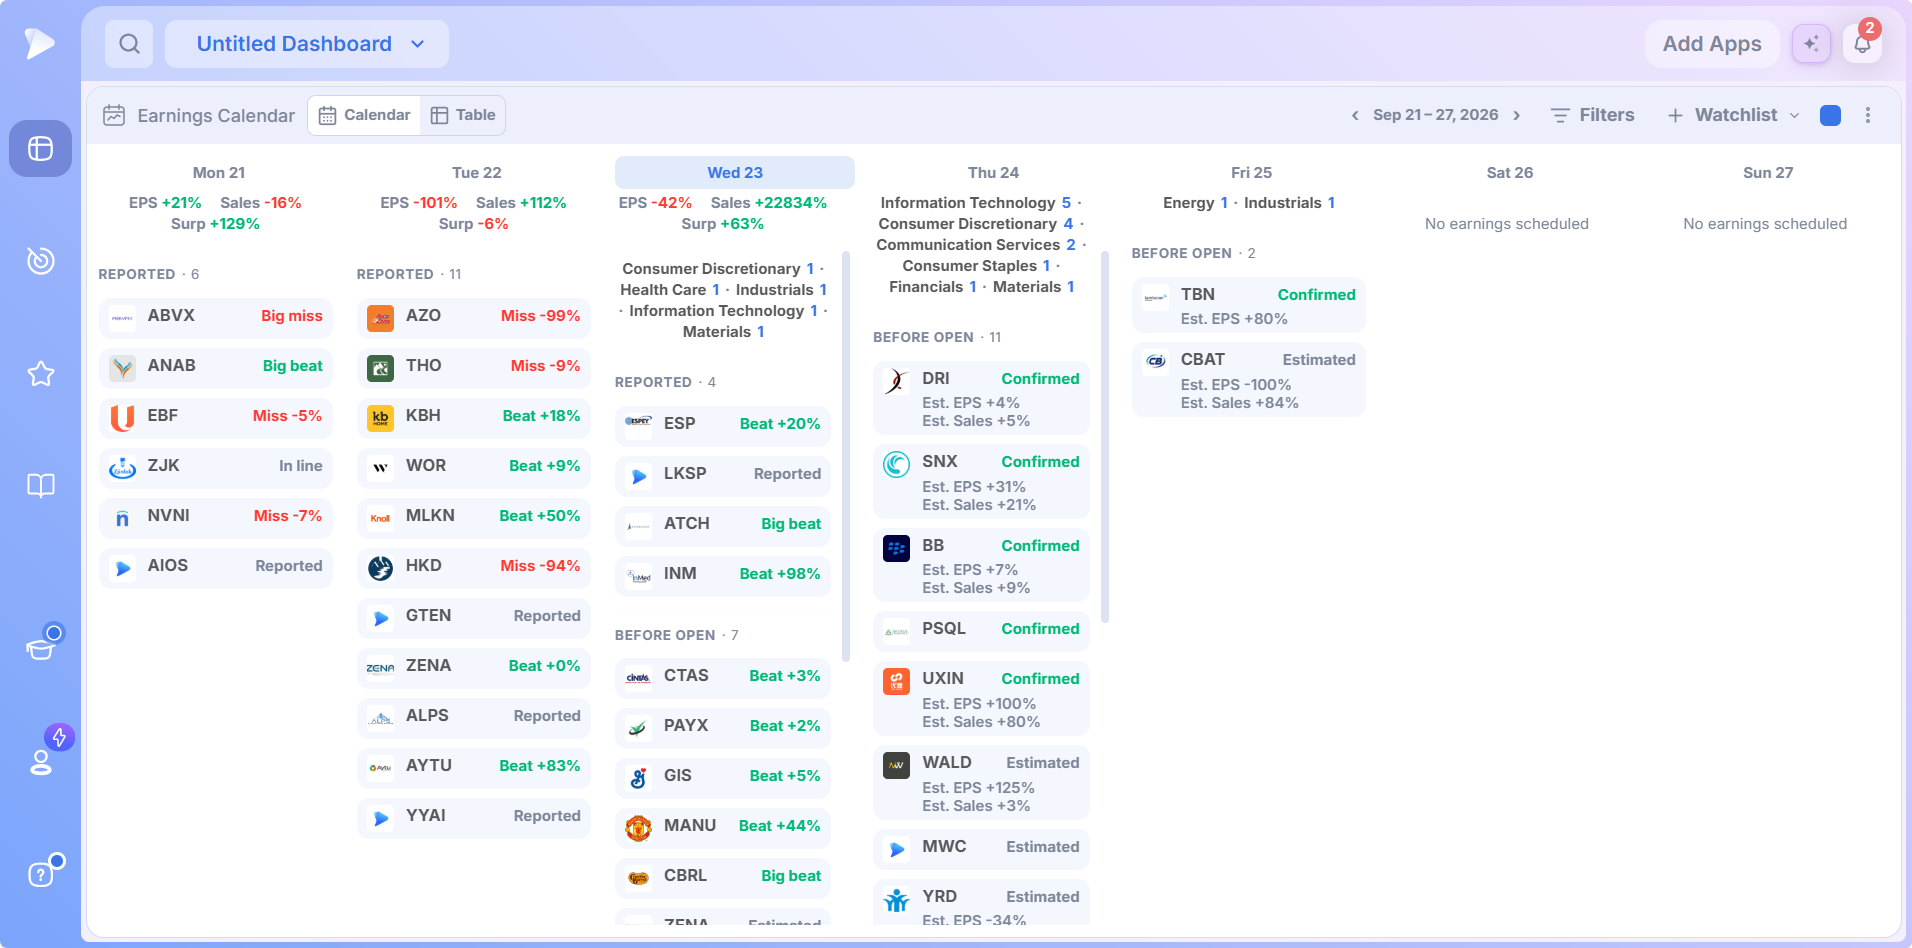
- •Header: the Calendar and Table toggle, the week with stepper arrows, Filters, + Watchlist, then the color group square and the three dot menu.
- •Day columns: Monday through Sunday, with today highlighted.
- •Report cards: company logo, ticker and one label on the right edge, plus expected growth on upcoming earnings.
Earnings Calendar and Economic Calendar: Two Halves of One Schedule
Deepvue ships two calendars because they answer different questions. The Economic Calendar covers releases that move the whole market at once: inflation, jobs, GDP, the Fed. The Earnings Calendar covers dates owned by individual companies, where the blast radius is one stock and its neighbors. The weeks where the two stack up, a Fed decision inside a heavy reporting stretch, are the weeks that deserve the lightest book.
Who the Earnings Calendar Is For
- ✓CANSLIM® traders, whose method is built on accelerating earnings, tracked here from estimate to surprise on every name. Deepvue for CANSLIM® traders folds it into that routine.
- ✓Swing traders deciding name by name whether a position rides through its report or gets trimmed ahead of it, which Deepvue for swing traders covers in detail.
- ✓Position traders holding for months, who need report dates mapped across the whole horizon. See Deepvue for position traders.
- ✓Earnings gap hunters who scan each morning’s beats for the next episodic pivot.
- ✓Anyone who has learned about a report from the gap it caused, the experience this app exists to end.
How the Earnings Calendar Works
Calendar View and the Card Labels
Calendar view is the default. Day columns run across the app, each grouped into sections such as Reported and Before Open with a count beside the heading. Every report is a card, and the label on its right edge tells you where it stands.
| Card label | What it means | What the card shows |
|---|---|---|
| Confirmed | The company has locked the date | Expected EPS and sales growth beneath the ticker |
| Estimated | The date is projected and can still move | Estimates where available; the slot may shift |
| Beat / Miss | The report landed above or below consensus | The surprise percentage beside the label |
| Big beat / Big miss | The surprise was outsized in either direction | The label alone is the signal |
| In line | The result matched the estimate | A surprise of zero, or close enough to round to it |
| Reported | The result is in but there is no estimate to grade it against | The label by itself |
That vocabulary is the whole grammar of the app. A glance down a mid session column reads like a story: large Beat percentages, one Big beat, a couple of Miss labels, and the rest still on Confirmed cards waiting their turn.
Day Headers: Three Averages and a Sector Count
Each day opens with a compressed summary, and what it shows depends on whether the day has happened:
- •Days with results show average EPS growth, average sales growth and average surprise for the names that reported.
- •Days ahead list each sector with the number of companies due, a fast read on earnings this week.
- •Today can show both: averages for the reports already in, and sector counts for the rest.
Read the surprise average for direction, not magnitude. Averages of surprises are dominated by outliers, so the figure can run into the hundreds or thousands of percent. The sector counts are the more actionable half: a day weighted toward one sector is event risk for everything you hold in it, whether or not your own name reports.
Hover Any Ticker for the Numbers
Cards stay compact on purpose, so the detail is one hover away.
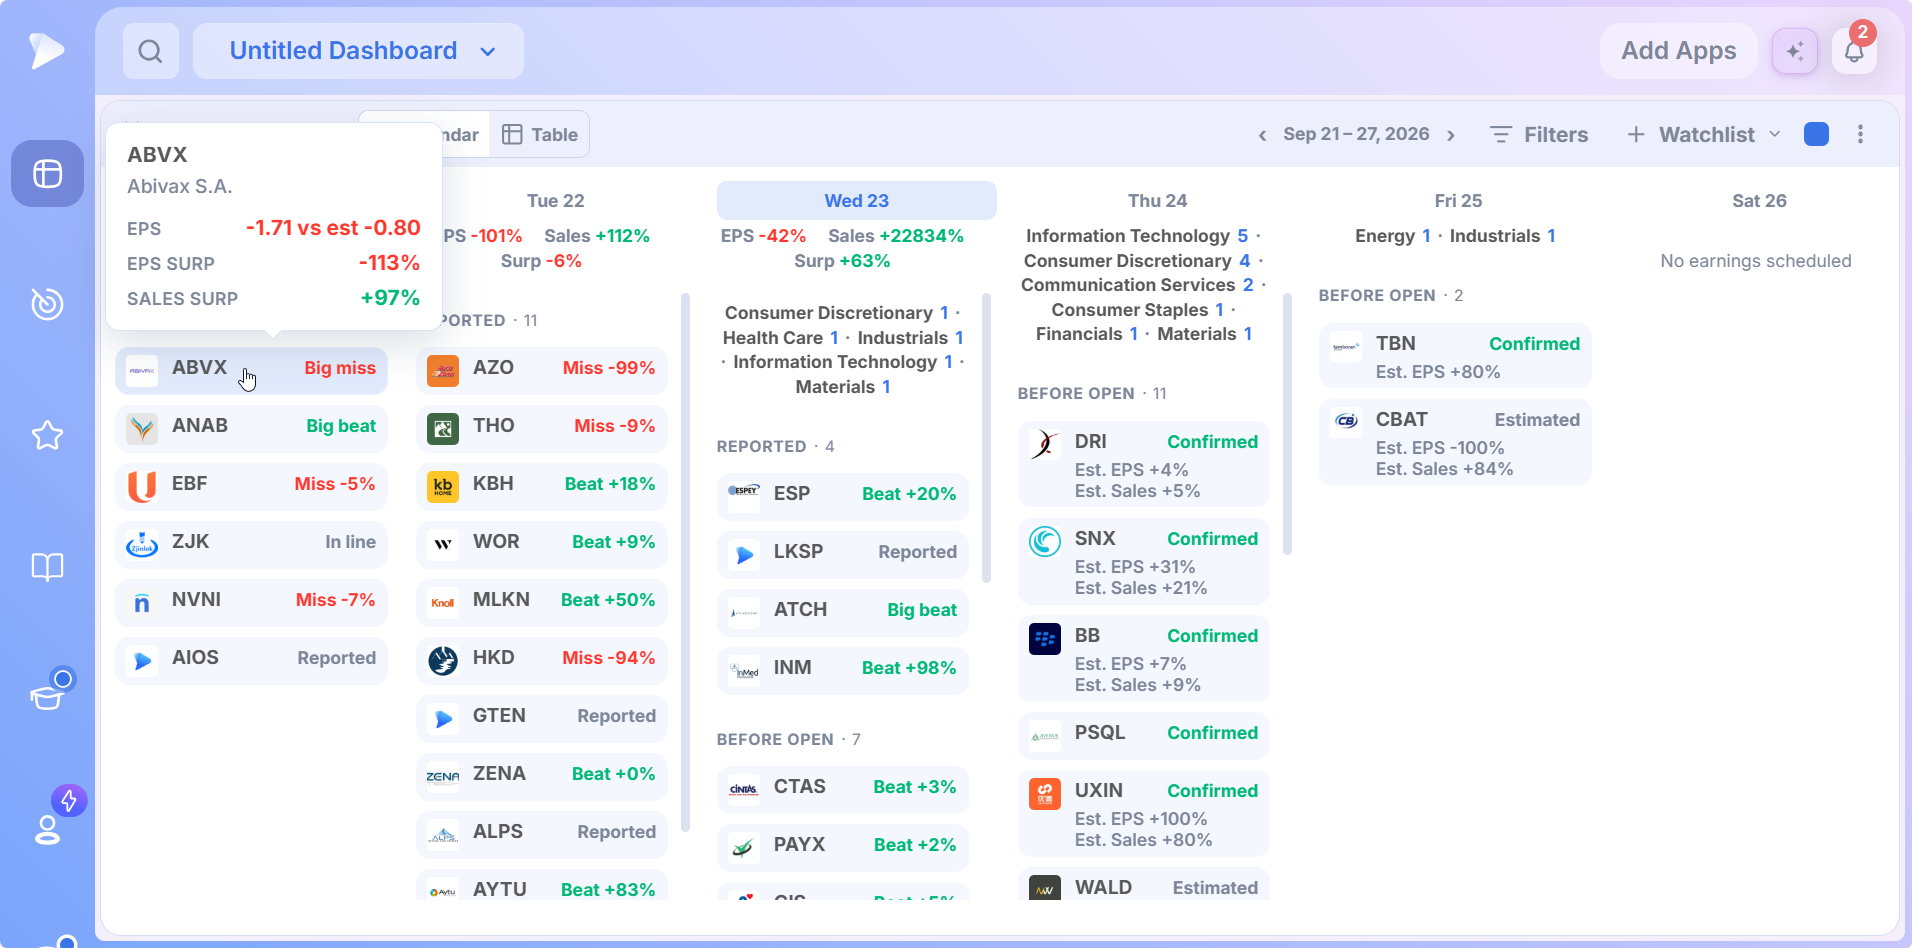
- •Company name, so an unfamiliar symbol identifies itself.
- •EPS vs estimate, the reported figure next to what consensus expected.
- •EPS surprise and sales surprise, colored green or red, so a beat on one line and a miss on the other is obvious.
The hover matters most on crowded mornings. Working down a column of two dozen reports, each pause turns a four letter symbol into a named business with a measured result in about a second.
Open a Deepvue account and find out which of your holdings report before Friday.
Table View: The Same Week as Sortable Rows
Flip the toggle to Table and cards become rows, with each day’s header averages printed above its table.
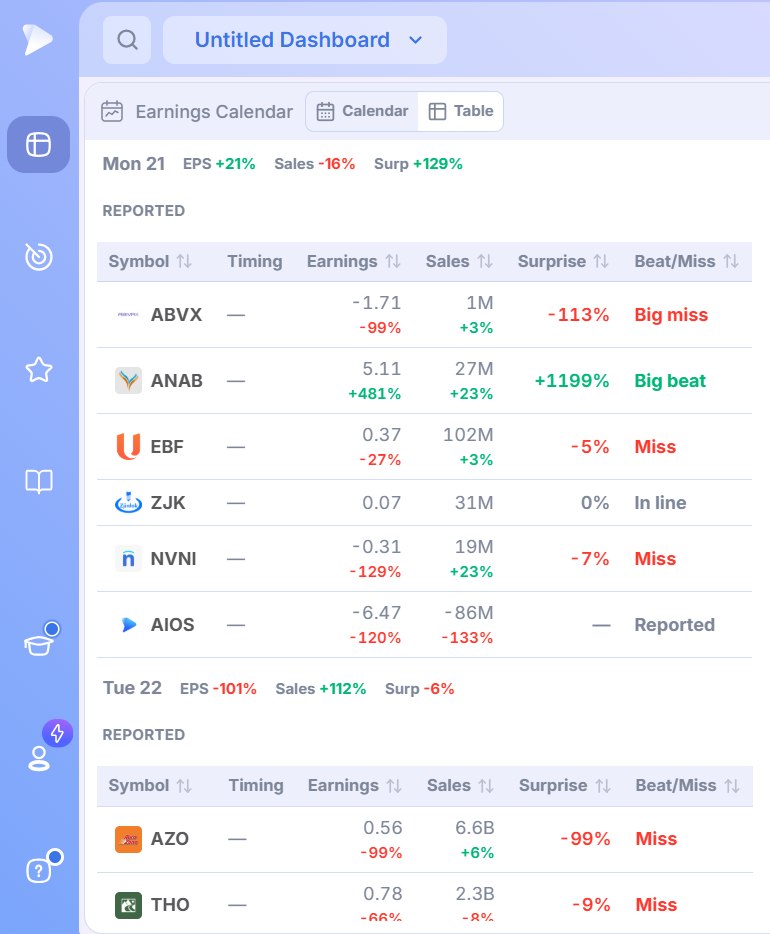
- •Symbol, Earnings, Sales, Surprise and Beat/Miss each sort with a click on the header.
- •Timing shows the report slot, before the open or after the close, where the calendar has it.
- •Earnings and Sales print the reported figure with its growth rate beneath.
The table brings back detail the cards compress. Solid growth on both lines for a modest beat is the healthy version. Earnings growing while revenue shrinks, landing in line, is cost cutting rather than demand. Enormous growth off a depressed base with a small beat flatters the headline. Sort a day by Surprise and the extremes jump to the ends; sort by Sales and the revenue heavyweights separate from the microcaps. Calendar view answers who and when; Table view answers how much.
Filters: Cut the Week to Your Universe
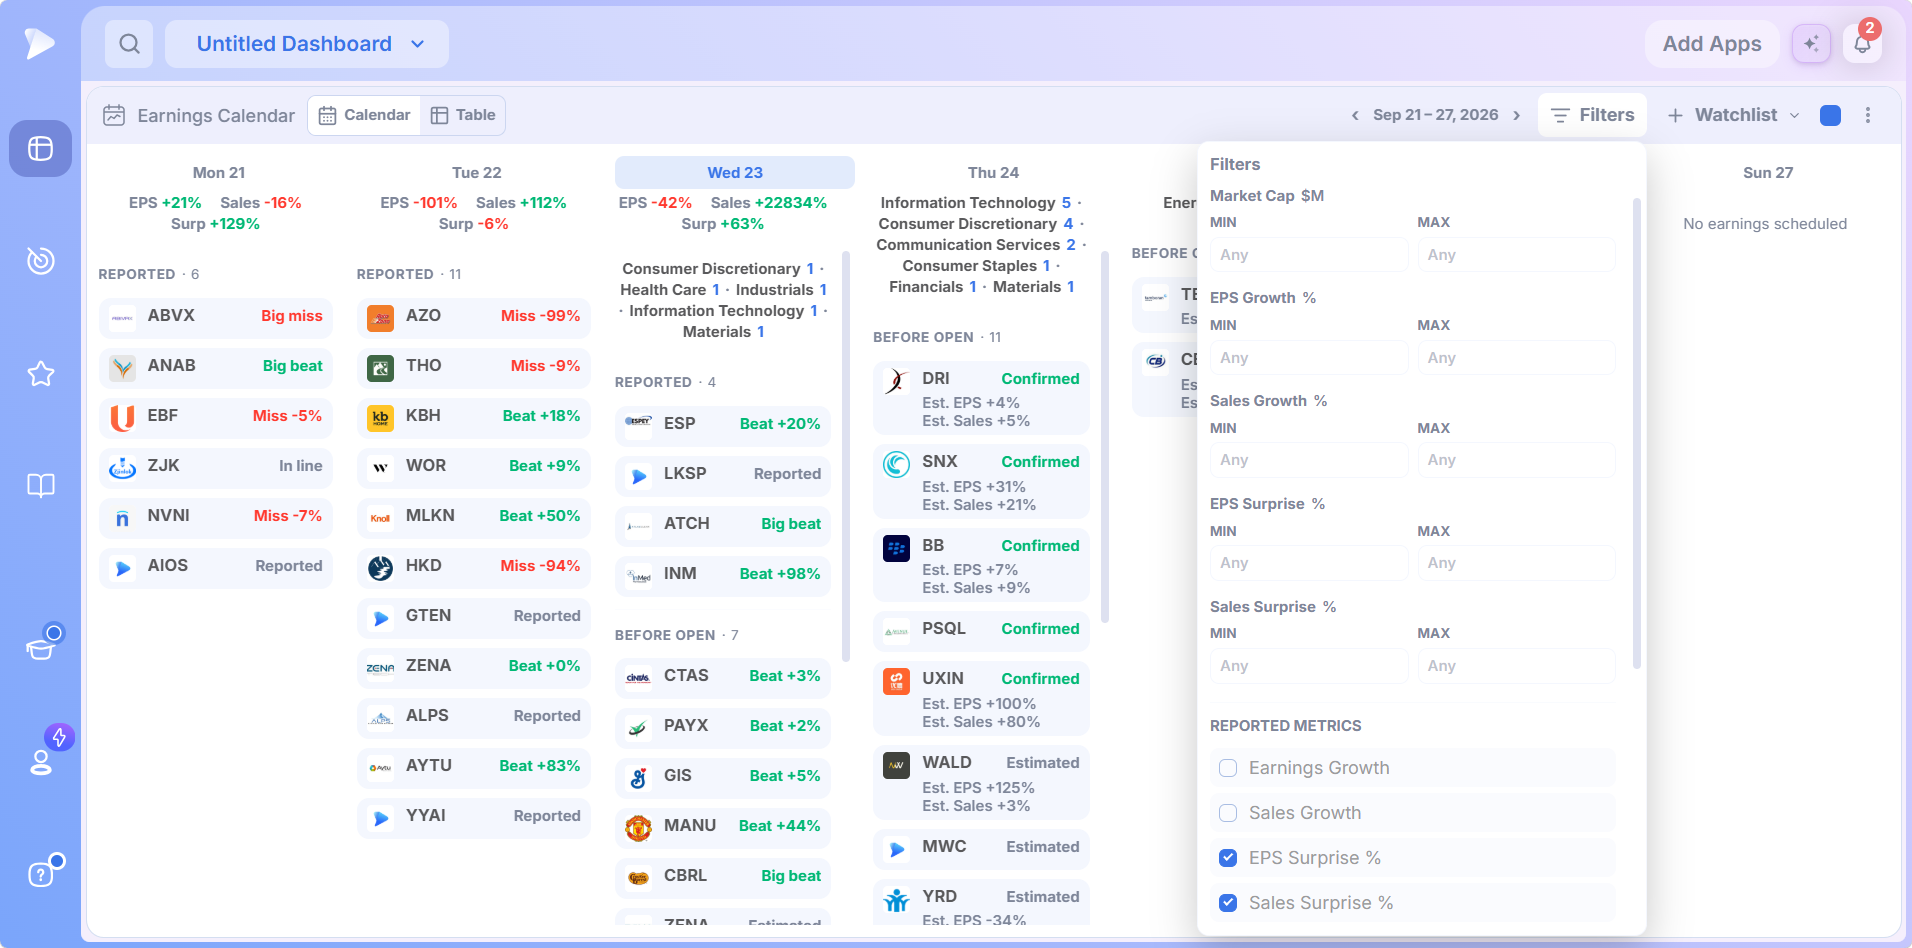
The Filters control opens a panel with two kinds of switch. The ranges decide which reports appear; the checkboxes decide which numbers print.
| Range filter | What it narrows |
|---|---|
| Market Cap $M | Company size in millions of dollars, to keep or exclude large caps |
| EPS Growth % | Reports by earnings growth rate |
| Sales Growth % | Reports by revenue growth rate |
| EPS Surprise % | How far EPS landed from consensus |
| Sales Surprise % | How far sales landed from consensus |
Scroll the panel and the display checkboxes follow, in four groups.
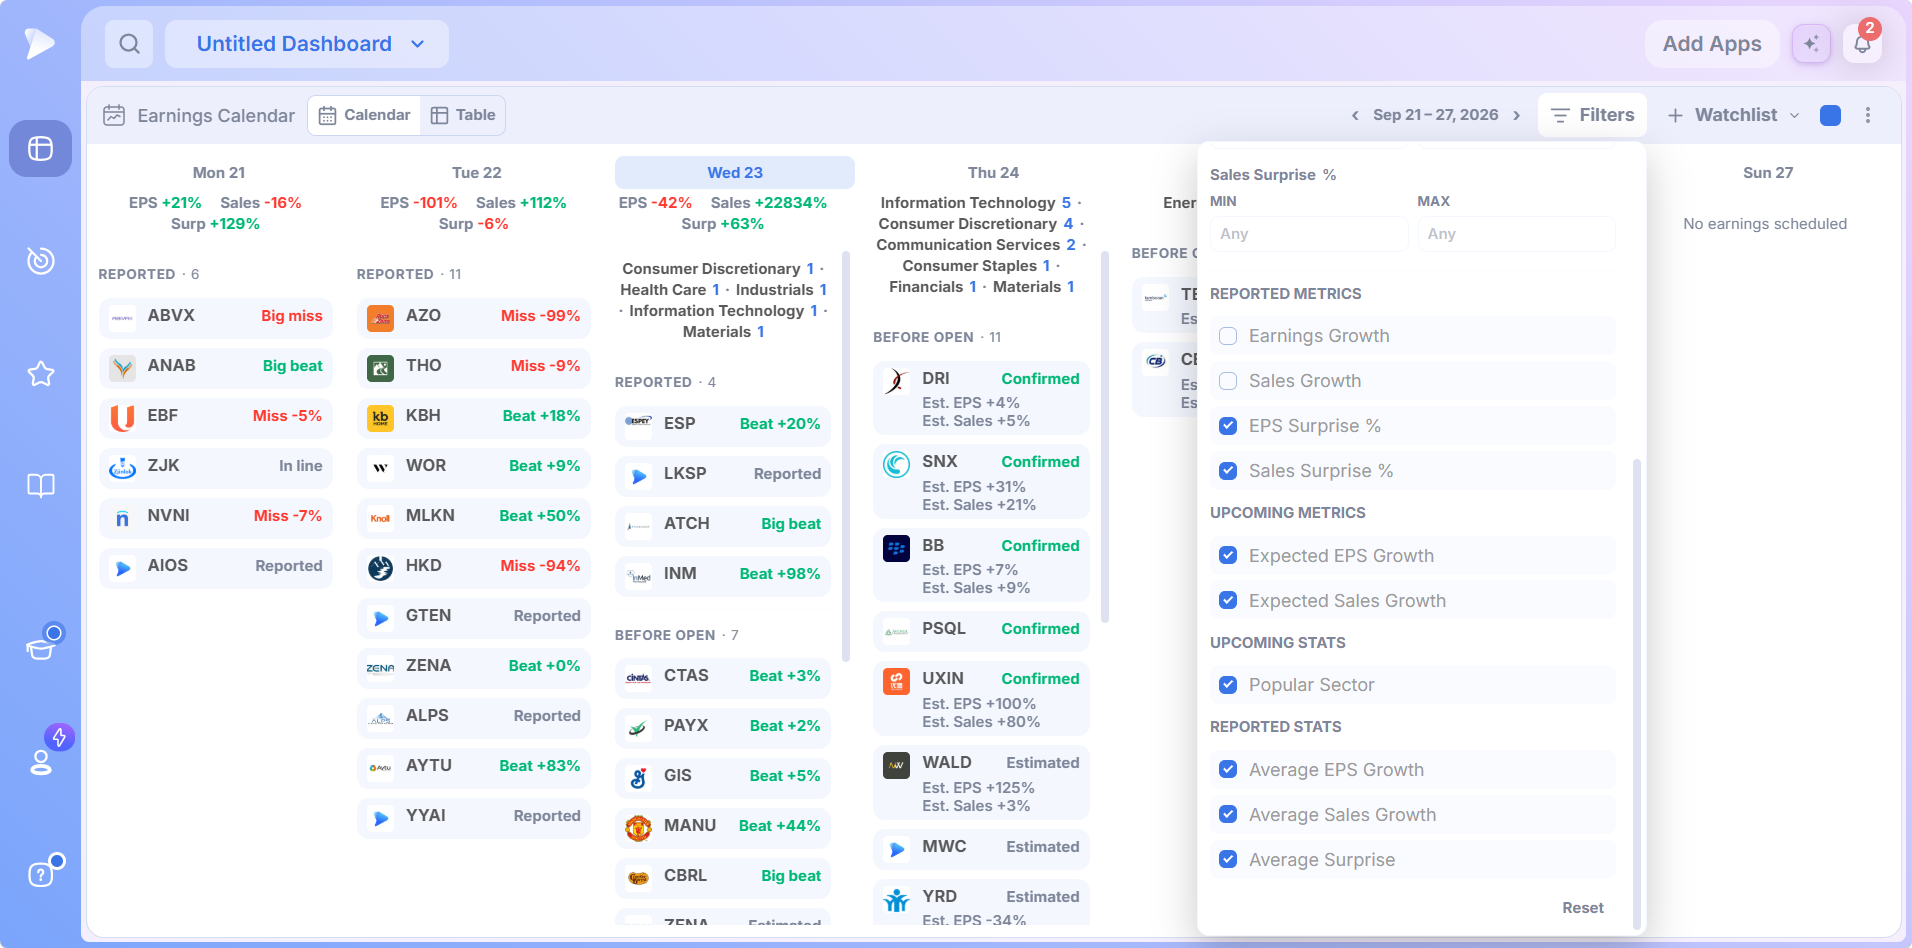
- •Reported Metrics: Earnings Growth, Sales Growth, EPS Surprise % and Sales Surprise % on finished reports.
- •Upcoming Metrics: Expected EPS Growth and Expected Sales Growth on reports still ahead.
- •Upcoming Stats: Popular Sector, the sector counts in upcoming day headers.
- •Reported Stats: Average EPS Growth, Average Sales Growth and Average Surprise in reported day headers.
The ranges are surgical. A market cap ceiling alone strips out every large cap, exactly the pass a small cap trader wants; growth and surprise floors keep only the reports capable of producing the earnings gaps this audience trades. Active filters show as a badge on the Filters button, and Reset clears everything in one click.
Stepping Through Weeks
The arrows around the date range move the calendar a week at a time, back for graded results and forward for upcoming earnings.
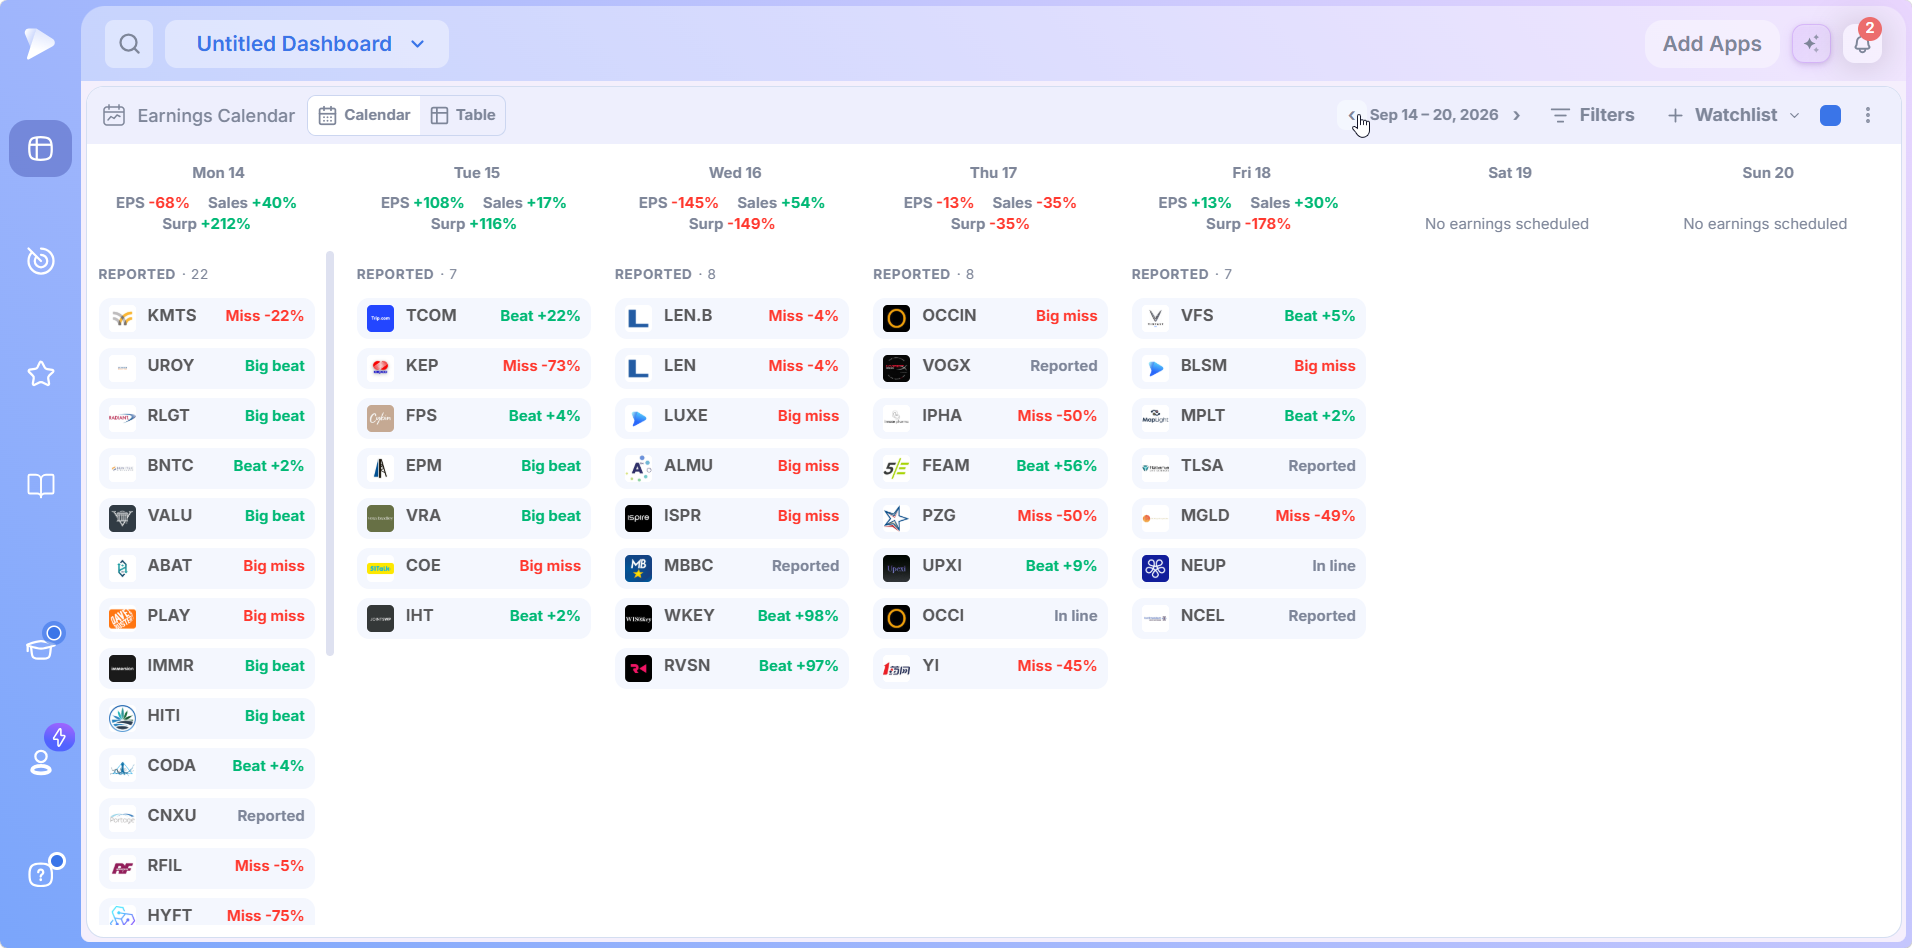
Step back and the market earnings calendar becomes a record: which days carried the big beats, and which sectors disappointed. Step forward and it becomes a planning tool, with Confirmed and Estimated cards showing who reports and what growth is expected.
The + Watchlist Menu
Next to Filters, a + Watchlist control opens two options, Regular and With Sections.
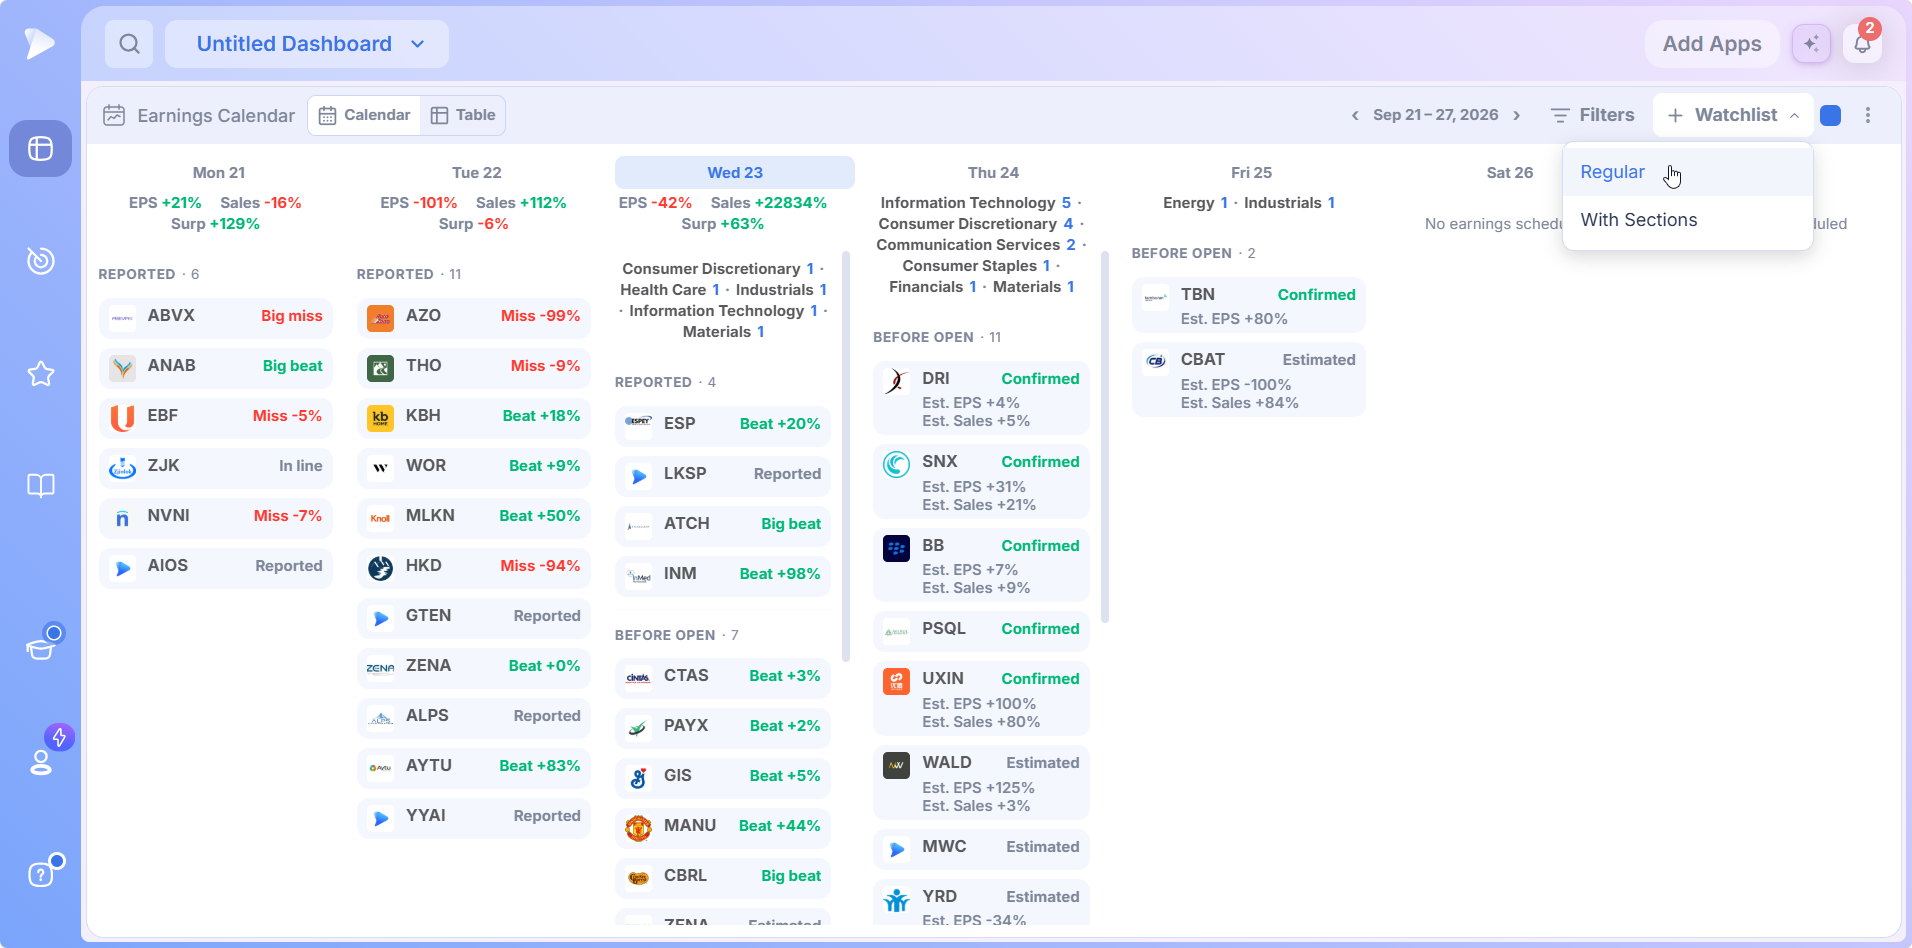
It connects the calendar with Deepvue’s watchlists, so the names on a busy earnings week can move into the lists you trade from, as one list or grouped into sections.
Reading an Earnings Week
Any week can be read the same way in under a minute once the habit is there.
Start with the headers. Days where the average surprise runs positive and Beat labels dominate are a tape rewarding execution; shrinking beats and multiplying misses are a warning.
Scan the labels. Big beats and large Beat percentages are your candidates; Big misses in a sector you hold are your risk.
Hover the standouts for the company name and whether sales confirmed the earnings beat.
Step forward a week and note which of your names carry Confirmed dates, which are only Estimated, and which days read No earnings scheduled, a session with no single stock event risk at all.
A tip on estimates: an expected EPS change in the hundreds of percent usually means a tiny estimate base, not a dramatic quarter on the way.
Three Ways Traders Work the Earnings Calendar
Know Every Report Date You Are Holding Into
The first job is defensive. Holding into a report is a decision some traders make deliberately and others make by accident, and the difference is whether the date was on their screen. A weekly pass against your open positions turns every accidental hold into a chosen one. Pair it with the Position Size Calculator when you carry a name through its number and want the size to reflect the gap risk.
Hunt the Reactions, Not the Predictions
For CANSLIM® traders, earnings gaps and episodic pivots are the setup, and the reaction matters more than the guess. The morning pass is simple: scan the Beat and Big beat labels, hover for the size of the surprise, and send anything with a real number and real volume to a chart. The Screener runs the same hunt from the other side with its Earnings preset category, covering names reporting today, tomorrow and next week, plus recent earnings winners.
Read the Season, Not Just the Stock
The day header averages turn the app into a sentiment gauge. A week of solid positive surprises is one to press; a week of fading beats is one to press less hard in, whatever your charts say. When a reaction makes no sense, a beat that sells off or a miss that gaps up, the AI Terminal explains the print without a tab switch.
Start with Deepvue and run next week’s schedule against your positions before the bell.
How to Add the Earnings Calendar to a Dashboard
Pick the board you plan from in the Dashboard module, or start a new one.
Open Add Apps from the top of the board.
Click Earnings Calendar in the Tools group and the current week appears, with today highlighted.
Pick Calendar or Table in the header, and set Filters to your universe.
Link it to a color group with the square in its header, if you group apps on the board.
What Makes the Deepvue Earnings Calendar Different
Free earnings date lookups are everywhere, and they share a failure mode: they are somewhere else. A stocks earnings calendar earns a permanent spot on your dashboard by doing what a lookup site cannot.
- ✓It grades earnings beats and misses in place, so a Confirmed card becomes a Beat or Miss on the app you were already watching.
- ✓It filters to your universe, so a morning of two dozen reports reads as the handful you could actually trade.
- ✓It shows the surprise, not just the date, with EPS against its estimate and both surprise figures one hover away.
- ✓It reads the whole session through day header averages and sector counts.
- ✓It shares a dashboard with your charts and watchlists, so the distance from noticing a report to judging the reaction is a glance.
Platform choice deserves the same scrutiny. Head to head breakdowns against MarketSurge, TradingView, TC2000, Finviz and TrendSpider are collected in the Deepvue comparisons hub, and the compare category lists every comparison article.
What Traders Say About Deepvue
Earnings work runs through all four of these reviews, each quoted verbatim.
“Deepvue feels extremely well tailored to momentum trading and CANSLIM investing.”
Verified G2 review from a financial services professional. Read it on G2
“I believe DeepVue is purpose built for swing or position trading.”
Posted by u/DLightman1983 to r/swingtrading. See the post
“I was very impressed by the flexibility of DeepVue’s screen creator.”
Dave at Day Trade Review, rating Deepvue 4.7 overall. Open the review
“One of the best trading tools out there and I can’t trade without it.”
Joshua Fong, reviewing Deepvue on Google Play in November 2025. Google Play reviews
On the Deepvue reviews wall, verified reviews number more than 220 and average 4.8, and 97 percent of reviewers say they recommend Deepvue.
Where the Earnings Calendar Connects
- •The Stats Table for a company’s quarterly earnings and sales history, estimates and surprise record before its next report.
- •The Economic Calendar for the macro releases that land in the same week.
- •The Screener’s Earnings presets for scanning reporters by technical and fundamental criteria.
- •Charts and watchlists for judging the reaction and keeping the names worth following.
- •The AI Terminal to explain a reaction that does not match the numbers.
What the Earnings Calendar Costs
The Earnings Calendar comes with Deepvue’s single plan at $49 per month, with monthly and annual options. The Economic Calendar is in the same price, which matters when the company and macro schedules count equally.
That one plan covers:
- •The screener and its 1,152 data points.
- •Charts, watchlists, and alerts, all of them unrestricted.
- •Fully customizable dashboards, with every app in the catalog.
- •The Theme Tracker, Market Brief, and AI Terminal, the last with unbounded usage.
Deepvue has one plan, so there are no tiers to compare. For reference, MarketSurge, the legacy platform in this niche, runs $149 per month.
New subscribers also get a one on one onboarding session with a Deepvue team member, an onboarding email series covering platform features and use cases, and weekly live webinars that each go deep on one part of the platform.
Put a Stock Market Earnings Calendar on Your Dashboard
Earnings are the one company event that arrives on schedule and still manages to ambush people. A stock market earnings calendar that carries the estimates in, grades the results out, averages the tape in every header and filters to names you can trade removes the ambush and leaves the opportunity.
Get Deepvue today, add the Earnings Calendar to your dashboard, and open next week’s schedule before next week opens on you.
↑ Back to contentsFrequently Asked Questions
What traders ask before wiring report dates into a routine.
What is an earnings calendar?
An earnings calendar is a schedule of when public companies report quarterly results, usually with consensus estimates attached and, once a report is out, the actual figures and the surprise. The Deepvue Earnings Calendar adds session sections, result labels, sector counts and filters, right beside your charts.
Which companies report earnings this week?
The companies that report earnings this week appear in the Deepvue Earnings Calendar as Confirmed or Estimated cards in each day column, with expected EPS and sales growth beneath the ticker. Upcoming day headers also count reports per sector, so you can see where the week’s event risk is concentrated.
When is earnings season?
Earnings season runs for roughly six weeks after each quarter ends, clustering in January, April, July and October, with the heaviest weeks usually the second and third. The Deepvue Earnings Calendar shows the exact week you are looking at, which matters more than the general rule.
Should I hold a stock through earnings?
Whether to hold a stock through earnings depends on your conviction and position size, and traders genuinely split on it. What is not optional is knowing the date. The Deepvue Earnings Calendar makes sure holding into a report is a choice, not an accident.
What time of day do earnings come out?
Earnings come out either before the market opens or after it closes. A before open report gaps the stock at 9:30; an after close report moves it in extended hours and carries into the next session. The Deepvue Earnings Calendar groups reports by slot and shows it in the Table view’s Timing column.
What does a positive earnings surprise mean?
A positive earnings surprise means the company reported better than analysts expected. Deepvue grades it on the card as a Beat, or a Big beat when the gap is outsized, with the surprise percentage beside the label. Large positive surprises often drive earnings gaps as expectations reset.
Why do stocks fall after beating earnings?
Stocks fall after beating earnings because the market prices the future, not the quarter. Weak guidance, a run up into the report, or a beat from one time items can all sink a stock. Send that reaction to a Deepvue chart, and to the AI Terminal when the move makes no sense.
What is the difference between an EPS surprise and a sales surprise?
The difference between an EPS surprise and a sales surprise is bottom line versus top line: EPS surprise compares earnings per share with consensus, sales surprise compares revenue. The Deepvue hover card and Table view show both, since a beat on one and a miss on the other tells a different story.
How do I find out when a stock reports earnings?
You find out when a stock reports earnings by opening the Deepvue Earnings Calendar, stepping to the week you need and finding the ticker in the day columns, or switching to Table view and sorting by Symbol. Confirmed cards mean the date is locked; Estimated ones can still move.
What is the best earnings calendar for stock traders?
The best earnings calendar for stock traders covers both directions, upcoming dates with estimates and finished reports with graded results, on the screen where you make decisions. Free sites handle the dates; the Deepvue Earnings Calendar adds beat and miss labels, surprises, sector counts and five range filters.
What is the difference between Confirmed and Estimated?
The difference between Confirmed and Estimated is certainty. Confirmed means the company has announced the date; Estimated means the date is projected from its usual pattern and can still shift. Both Deepvue card types show expected EPS and sales growth where estimates exist.
What do the Beat, Miss, and In line labels mean?
The Beat, Miss, and In line labels grade reported EPS against consensus in the Deepvue Earnings Calendar. Beat and Miss carry the surprise percentage, Big beat and Big miss flag outsized surprises, In line marks a result that matched, and Reported appears when no estimate exists.
What do the percentages in each day’s header mean?
The percentages in each day’s header mean averages across the names that reported: EPS growth, sales growth and surprise. For upcoming days, the Deepvue header switches to a count of reports per sector, and today can show both. The Filters panel controls which of them display.
Can I filter the earnings calendar?
Yes, you can filter the earnings calendar on five ranges in Deepvue: market cap in millions of dollars, EPS growth, sales growth, EPS surprise and sales surprise, each with a minimum and maximum. A tight set of ranges can reduce a crowded day to a handful of names, and Reset clears them.
Can I choose which numbers appear on the cards?
Yes, you can choose which numbers appear on the cards. The Deepvue Filters panel has checkboxes for reported metrics such as EPS Surprise %, upcoming metrics such as Expected EPS Growth, and the stats shown in each day header, such as Popular Sector and Average Surprise.
Is there a table version of the calendar?
Yes, there is a table version of the calendar. The Deepvue Table toggle redraws each day as rows with Symbol, Timing, Earnings, Sales, Surprise and Beat/Miss columns, growth printed beneath earnings and sales, and every column except Timing sortable.
What does hovering a ticker show?
Hovering a ticker shows the full company name, EPS against its estimate, the EPS surprise and the sales surprise. In the Deepvue Earnings Calendar the card works the same whether a column holds one report or two dozen, so an unfamiliar symbol identifies itself without a click.
Can I see past weeks of earnings results?
Yes, you can see past weeks of earnings results. The arrows next to the week label in the Deepvue Earnings Calendar step back a week at a time, and each past day keeps its graded labels, surprises and header averages, a scored record of how every session went.
How is this different from the Economic Calendar?
The Earnings Calendar differs from the Economic Calendar in scope: it tracks company report dates and results, while the Economic Calendar tracks macro data and central bank events like CPI and Fed decisions. Both are Deepvue apps in the Tools group, and running both covers the full schedule.
Is the Earnings Calendar included in the standard Deepvue plan?
Yes, the Earnings Calendar is included in the standard Deepvue plan. Deepvue has a single plan at $49 per month that covers the Earnings Calendar along with the screener, charts, watchlists, alerts, dashboards, the Theme Tracker, the Market Brief, and the AI Terminal.
CAN SLIM® is a registered trademark of O’Neil Capital Management, Inc. (U.S. Reg. No. 3,081,940). Deepvue is not affiliated with, sponsored by, endorsed by, or licensed by O’Neil Capital Management, Inc., Investor’s Business Daily, MarketSurge, or their affiliates. Any reference to CAN SLIM® is for descriptive purposes only. Deepvue’s scores, ratings, and screeners are independently calculated by Deepvue and are not the proprietary ratings of MarketSurge or IBD.