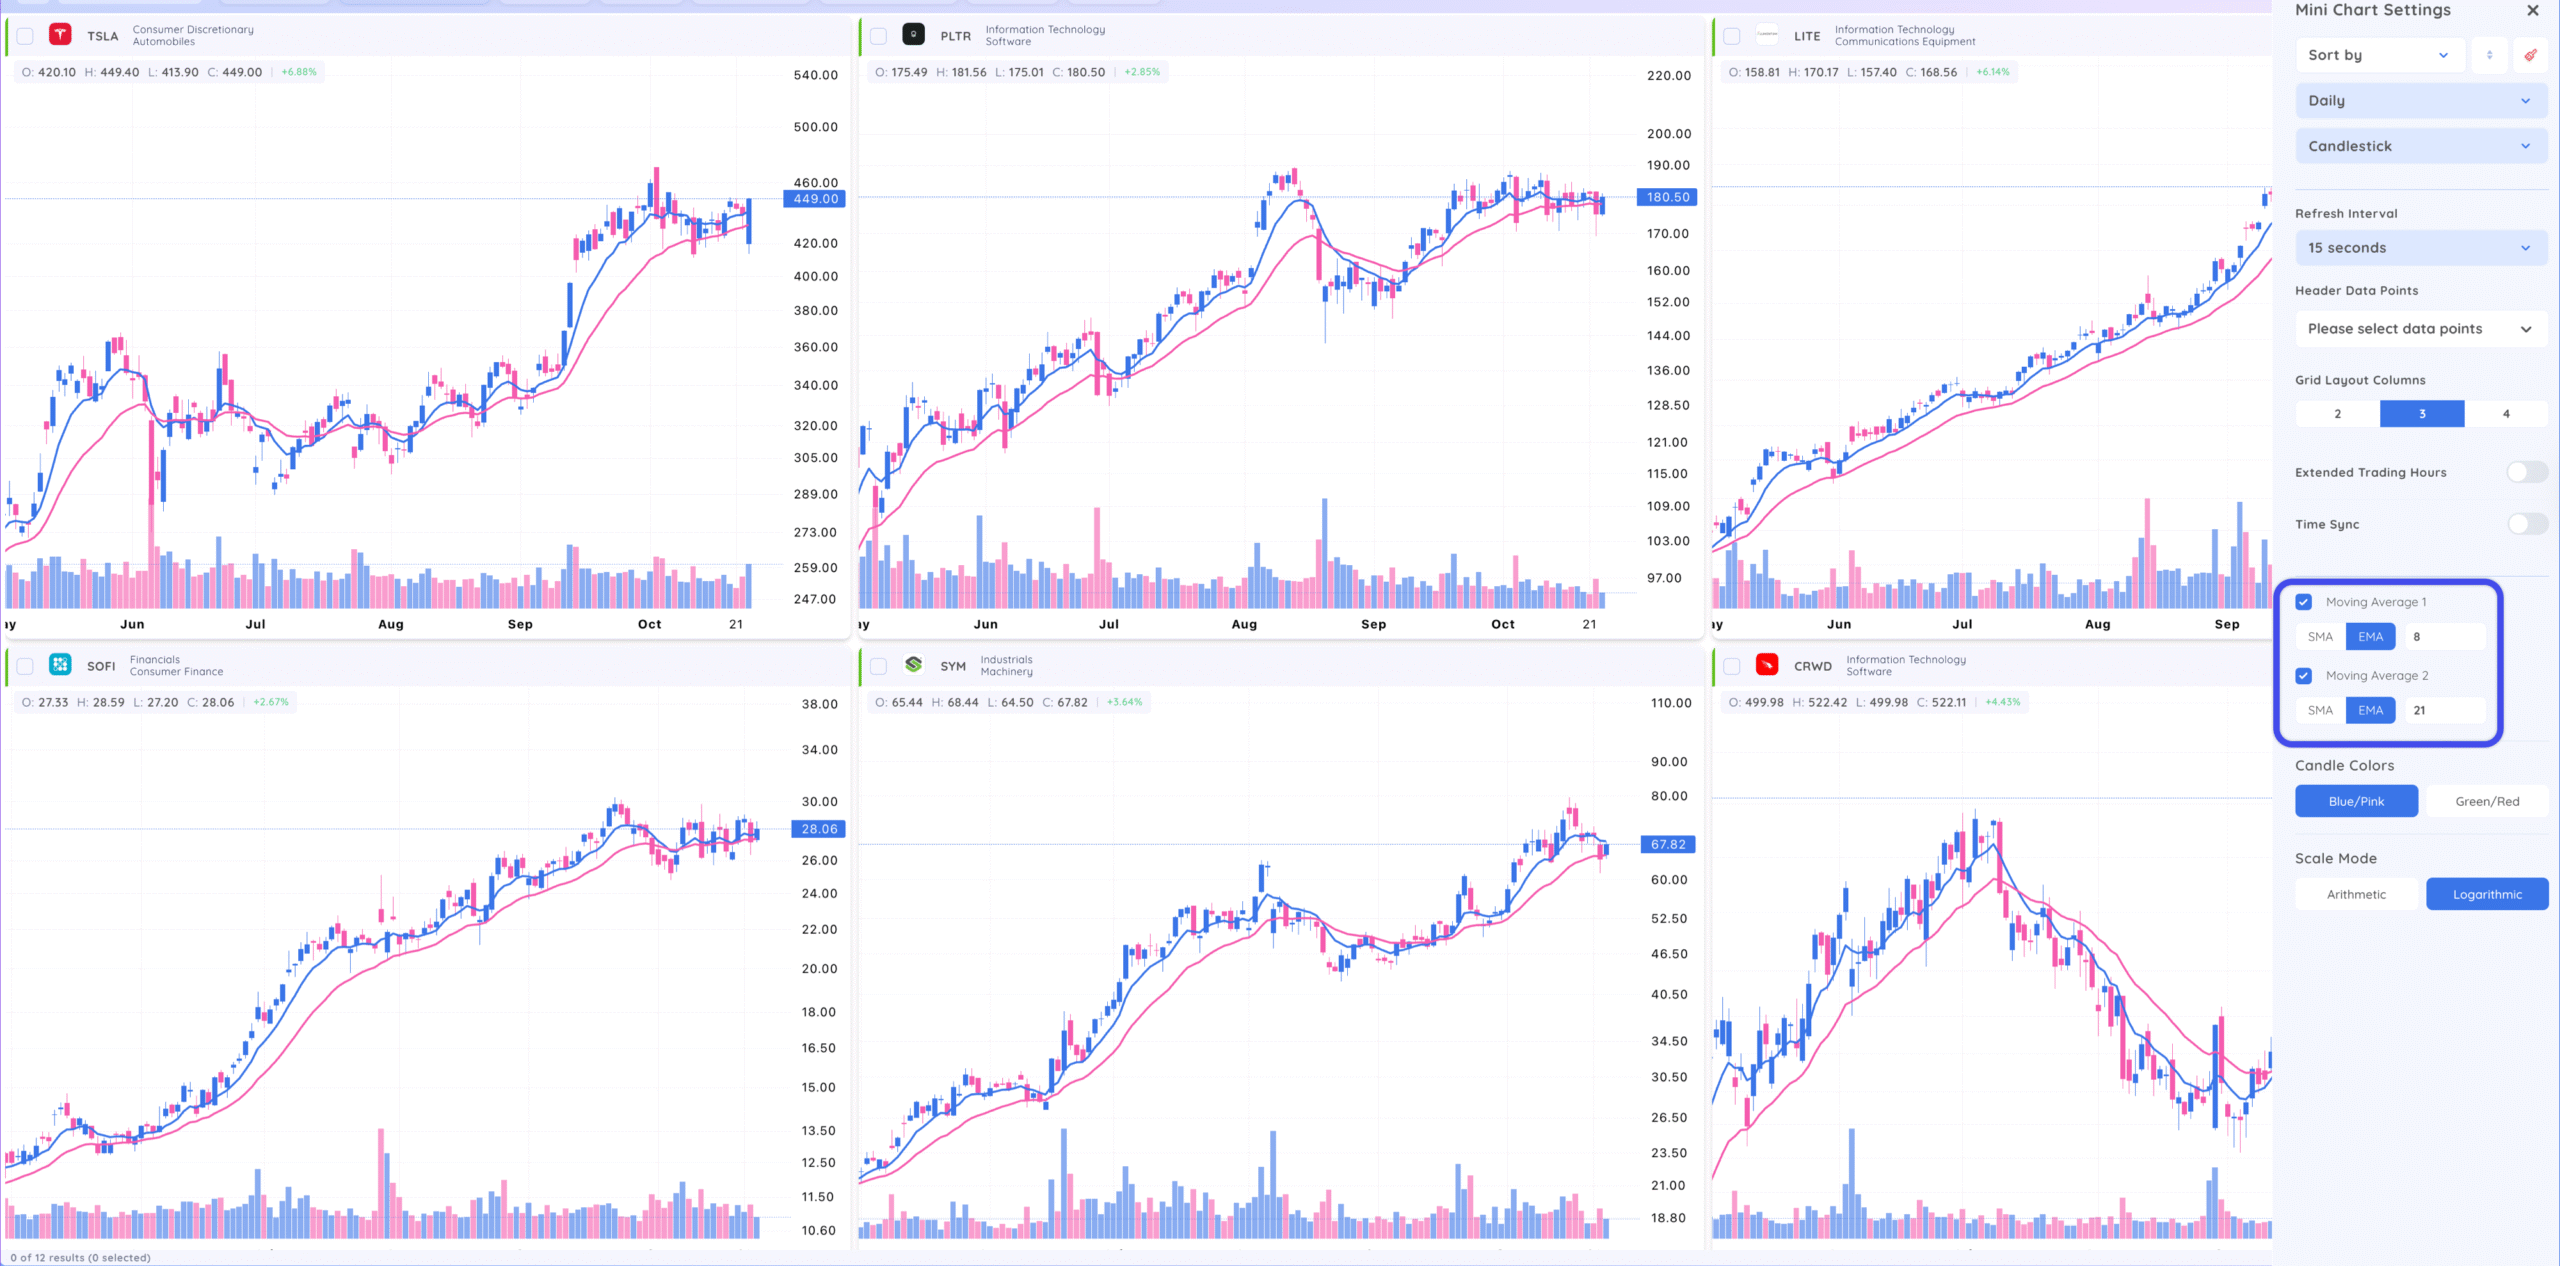
Mini charts let you view several charts all at once, so you can compare data without switching screens. Here’s what you can do with them:
- View multiple symbols on one screen – Track different stocks and ETFs from your watchlist all in one place.
- Use various time frames – View intraday, daily, and weekly charts to get the view you need.
- Mix symbols and time frames – Compare how different assets perform across multiple time periods.
- Add moving averages – Spot trends faster by layering moving averages on each mini chart.
- Change time frames easily – Adjust your time frames with just a click to see short- or long-term trends.
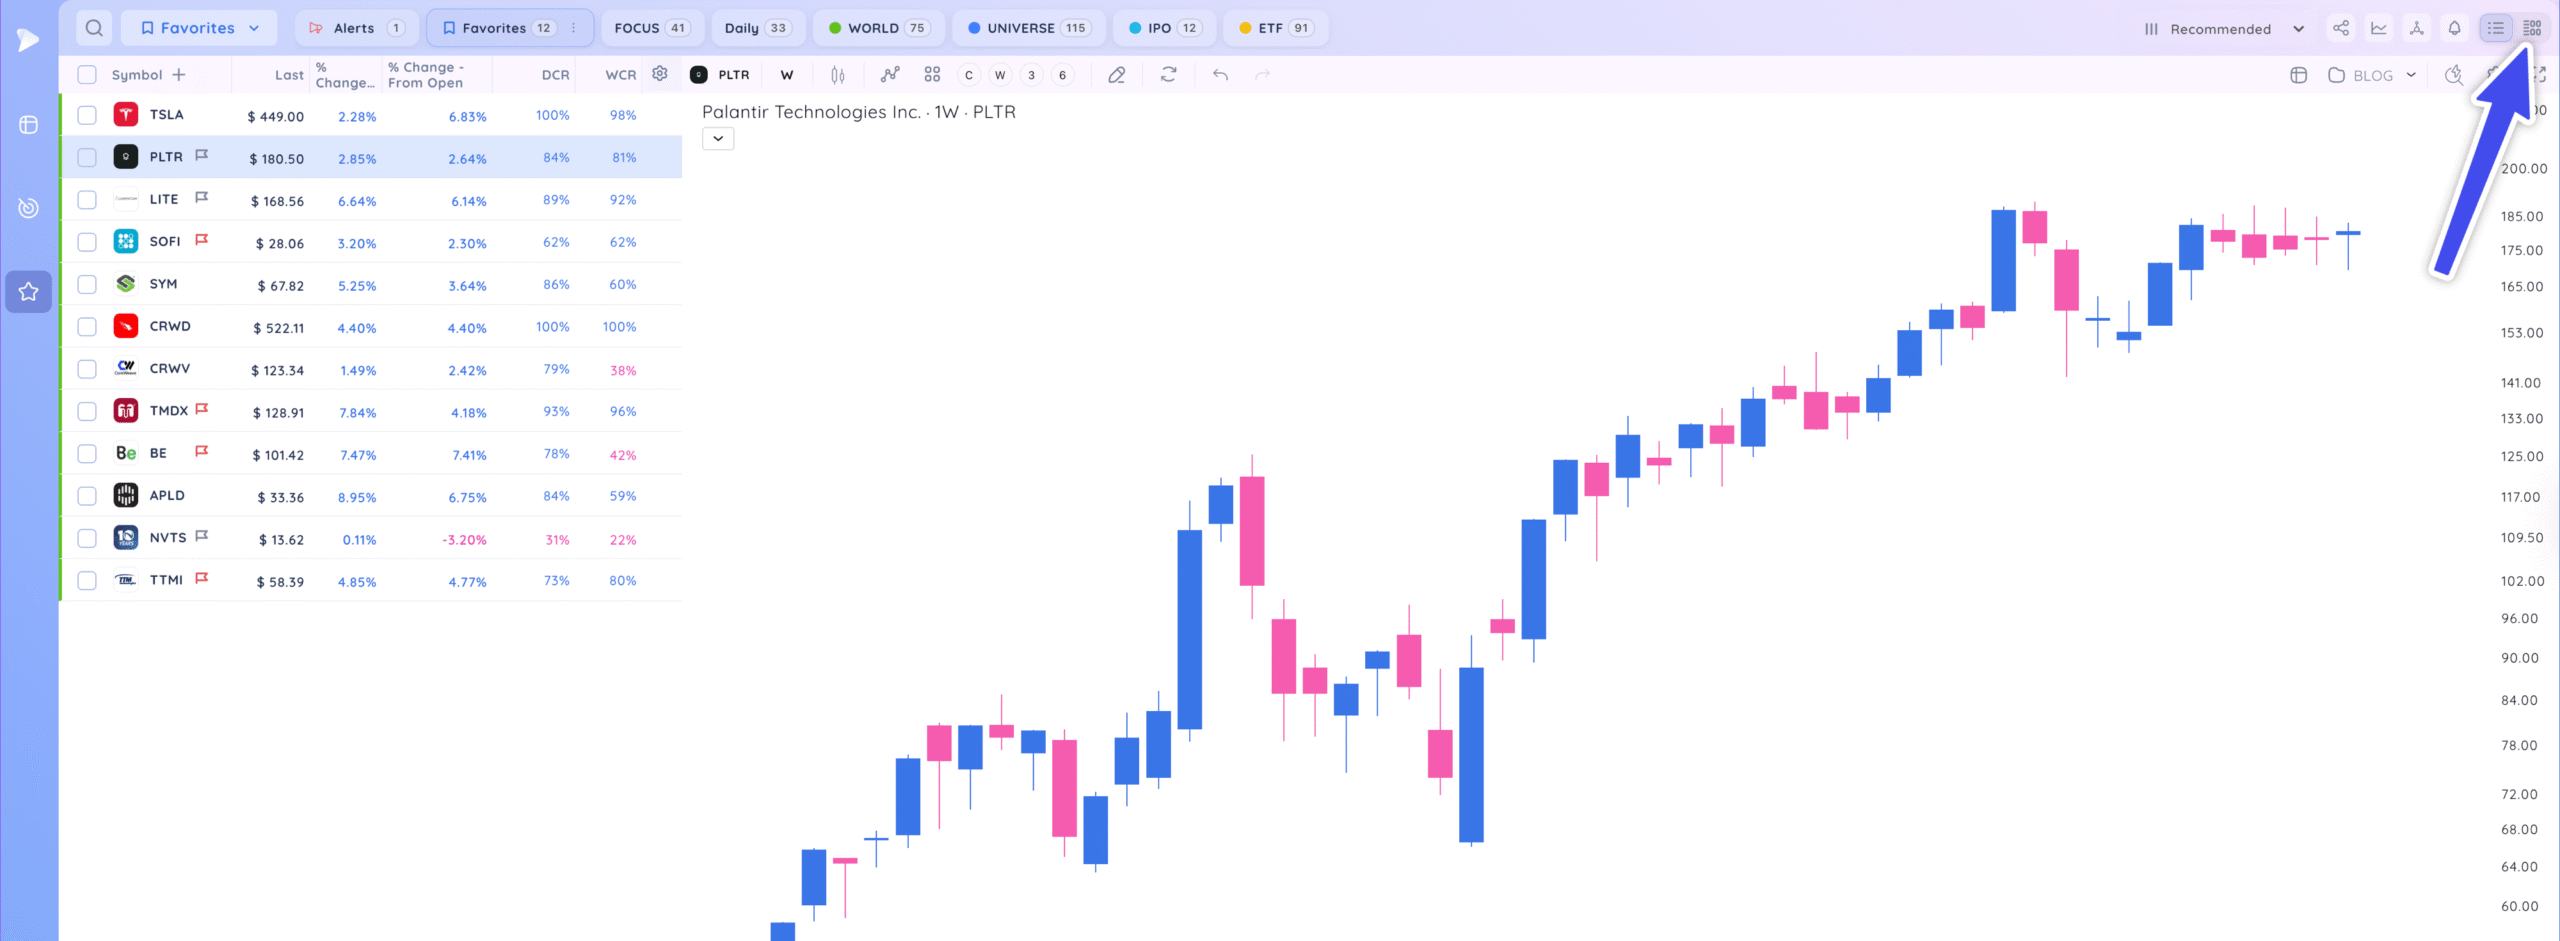
To access Mini Charts, click the icon in the top right of the screen.
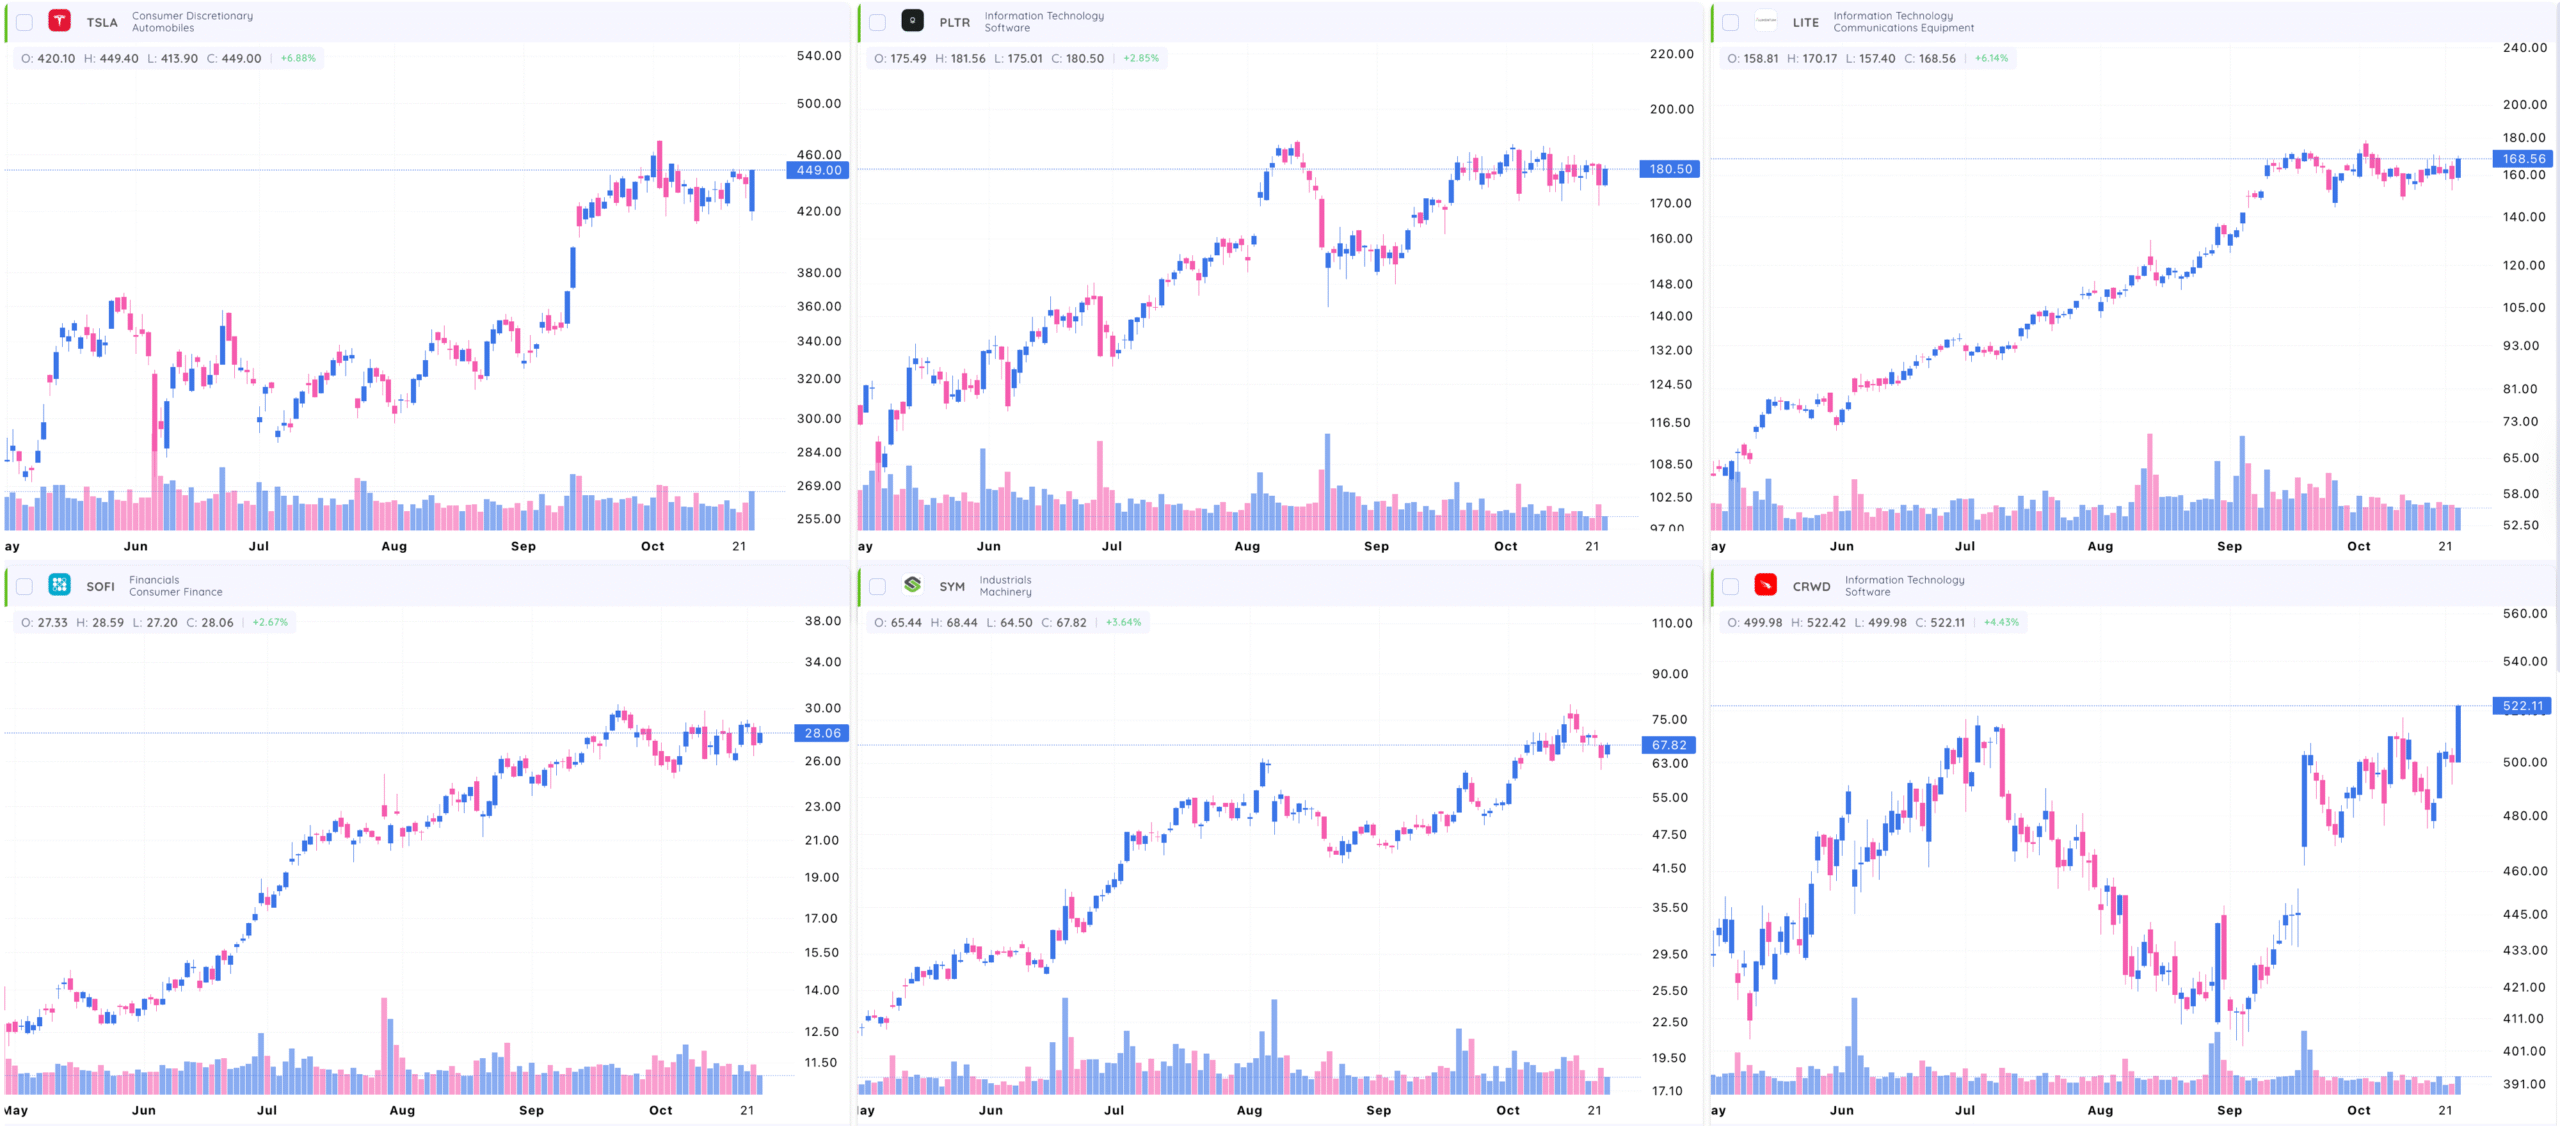
Charts will now be in mini-chart view. You can view any screener or watchlist in this view to quickly view multiple charts at once.
Mini Chart Settings #
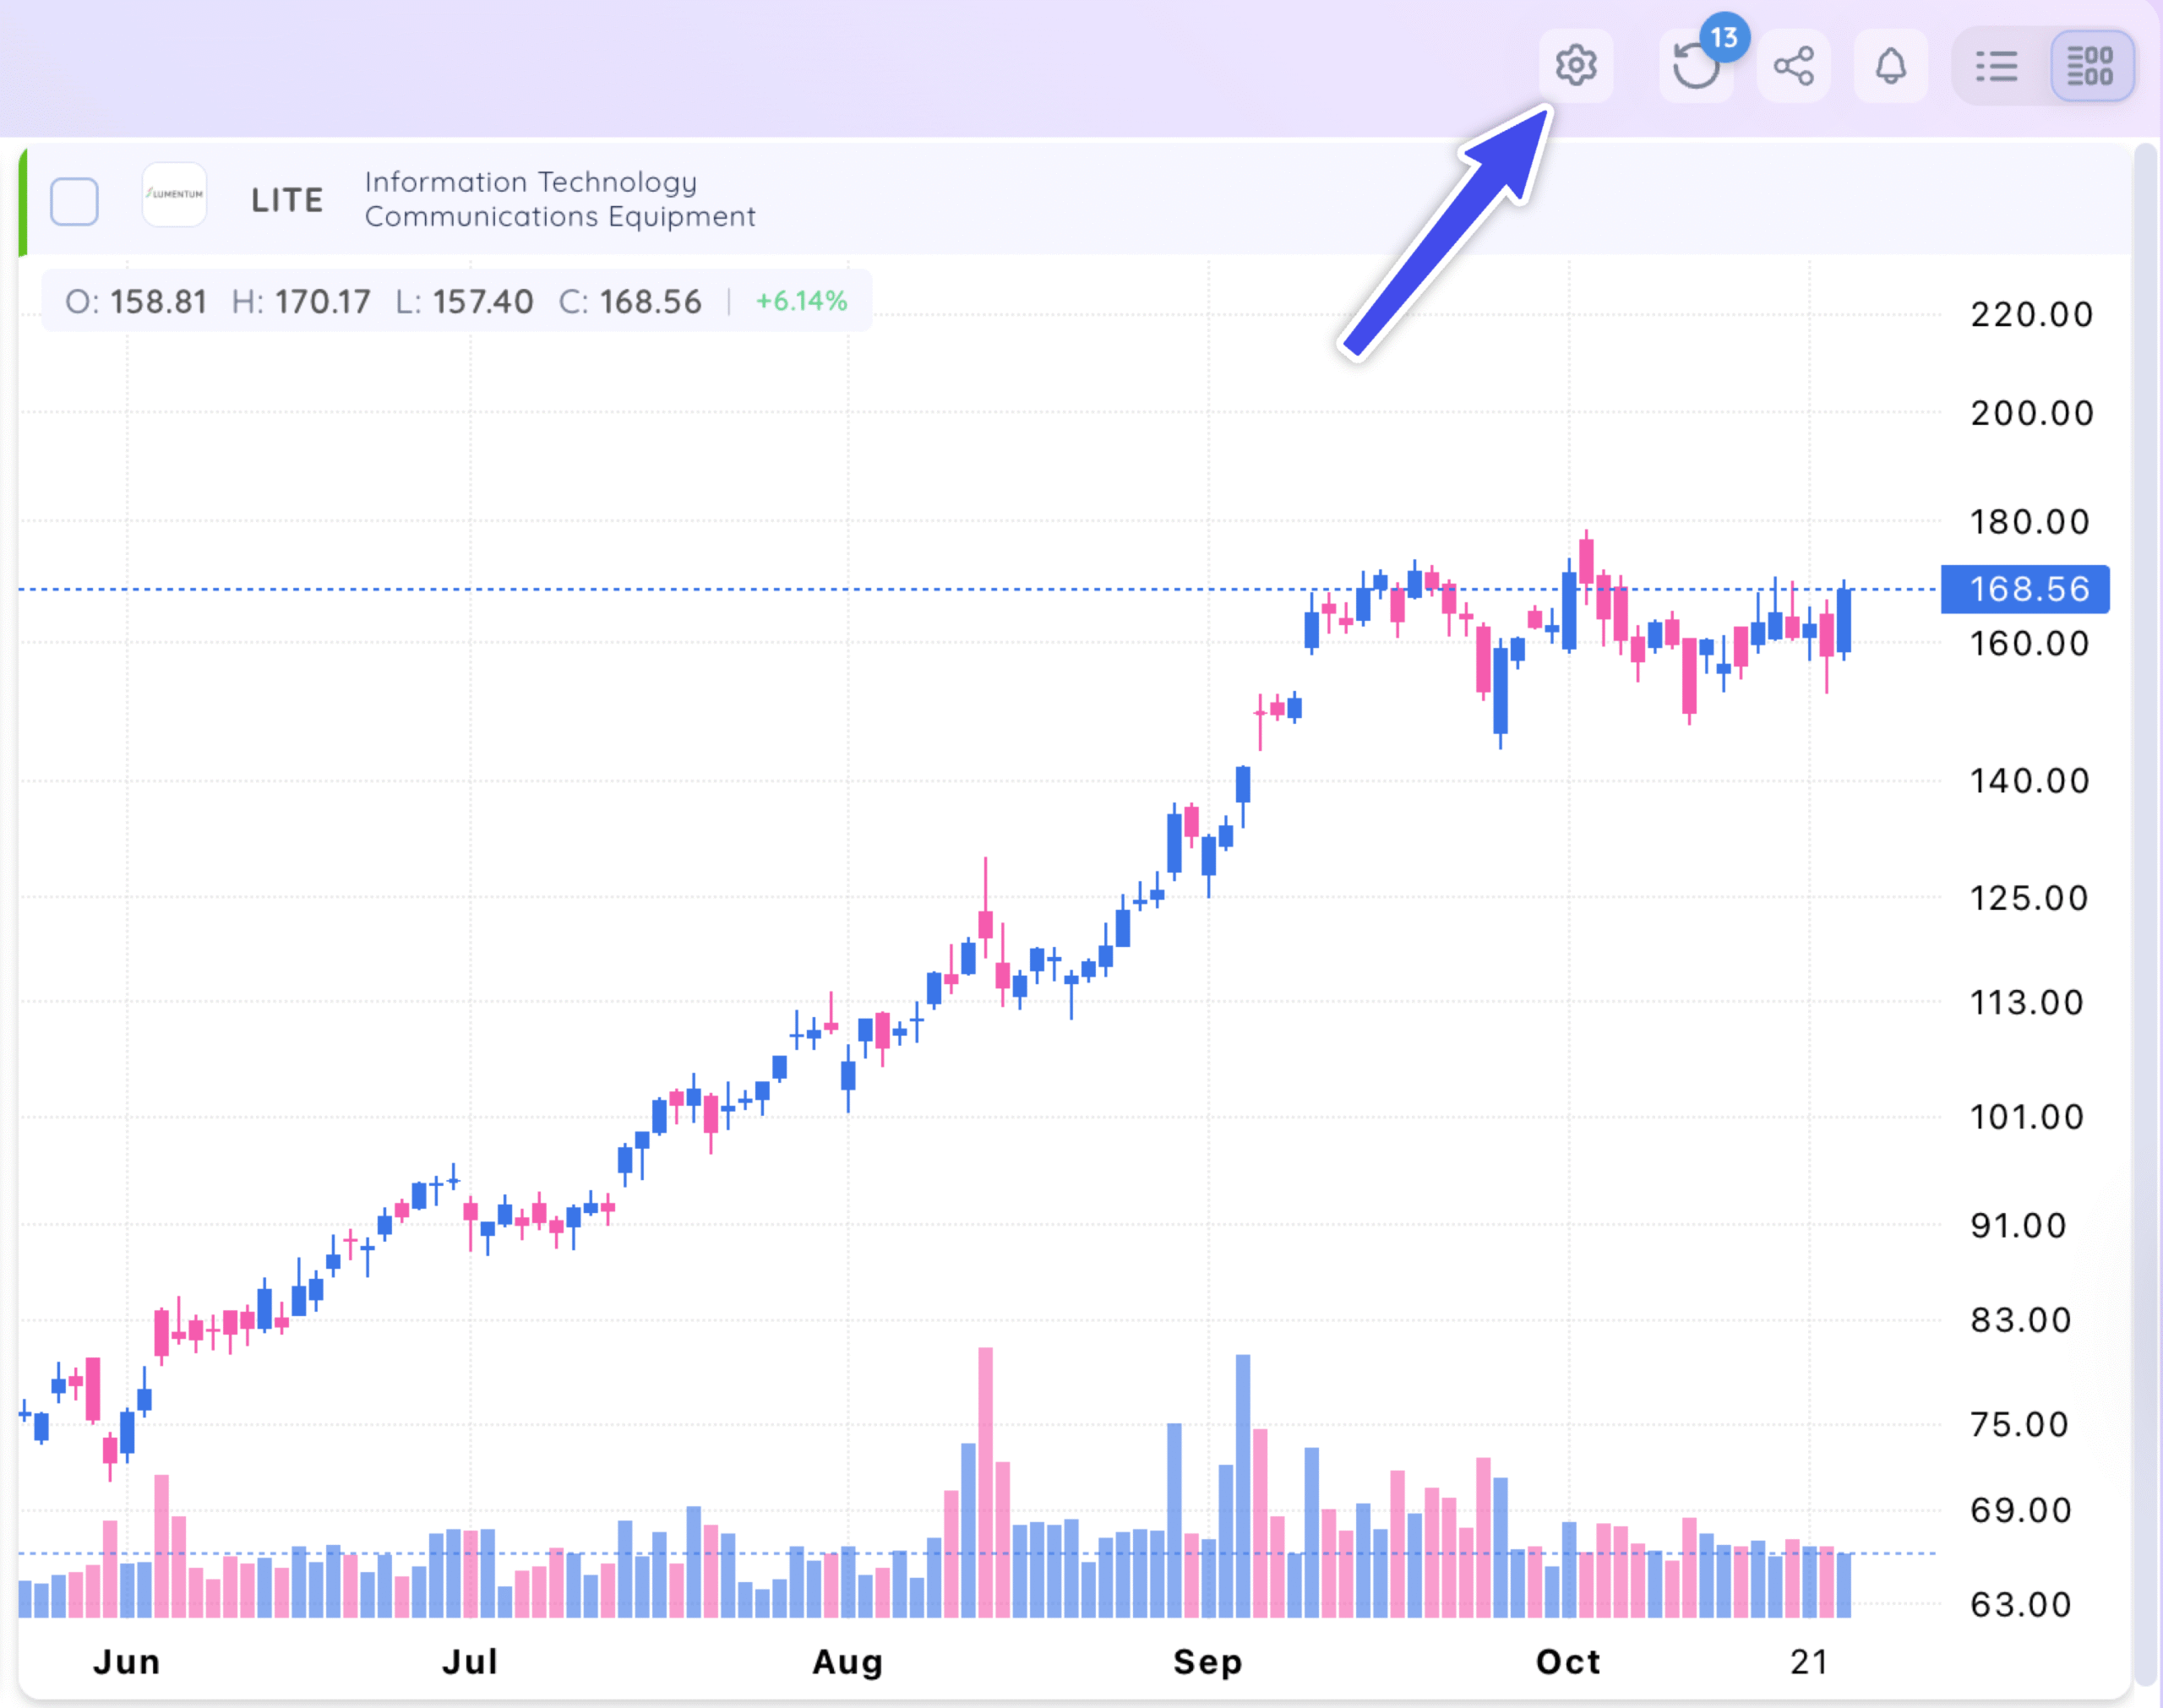
Click on the settings icon on the top navigation bar.
Click the drop-down arrows to change to your desired settings:
- Change what you sort by: Pick how you want to sort your data — by symbol, price action, fundamentals, or any other metrics already built into the system.
- Choose your timeframe: Select the timeframe that fits your trading style – intraday, daily, weekly, or monthly.
- Pick your chart type: Choose how you want your charts to look. You can go with candlestick, bar, or line charts depending on what you’re most comfortable with.
- Adjust the grid layout: Decide how many charts you want to see side by side. Set your layout to 2, 3, or 4 charts wide to match your workflow.
- Select your color scheme: Pick the colors that are easiest on your eyes. Choose between a blue/pink or green/red theme for your charts.
- Set the scale type: Choose how your price scale is displayed. Go with arithmetic for a standard view, or logarithmic if you’re comparing large price changes over time.
- Extended Trading Hours: Select this to see pre- and post-market hours on your intraday charts.
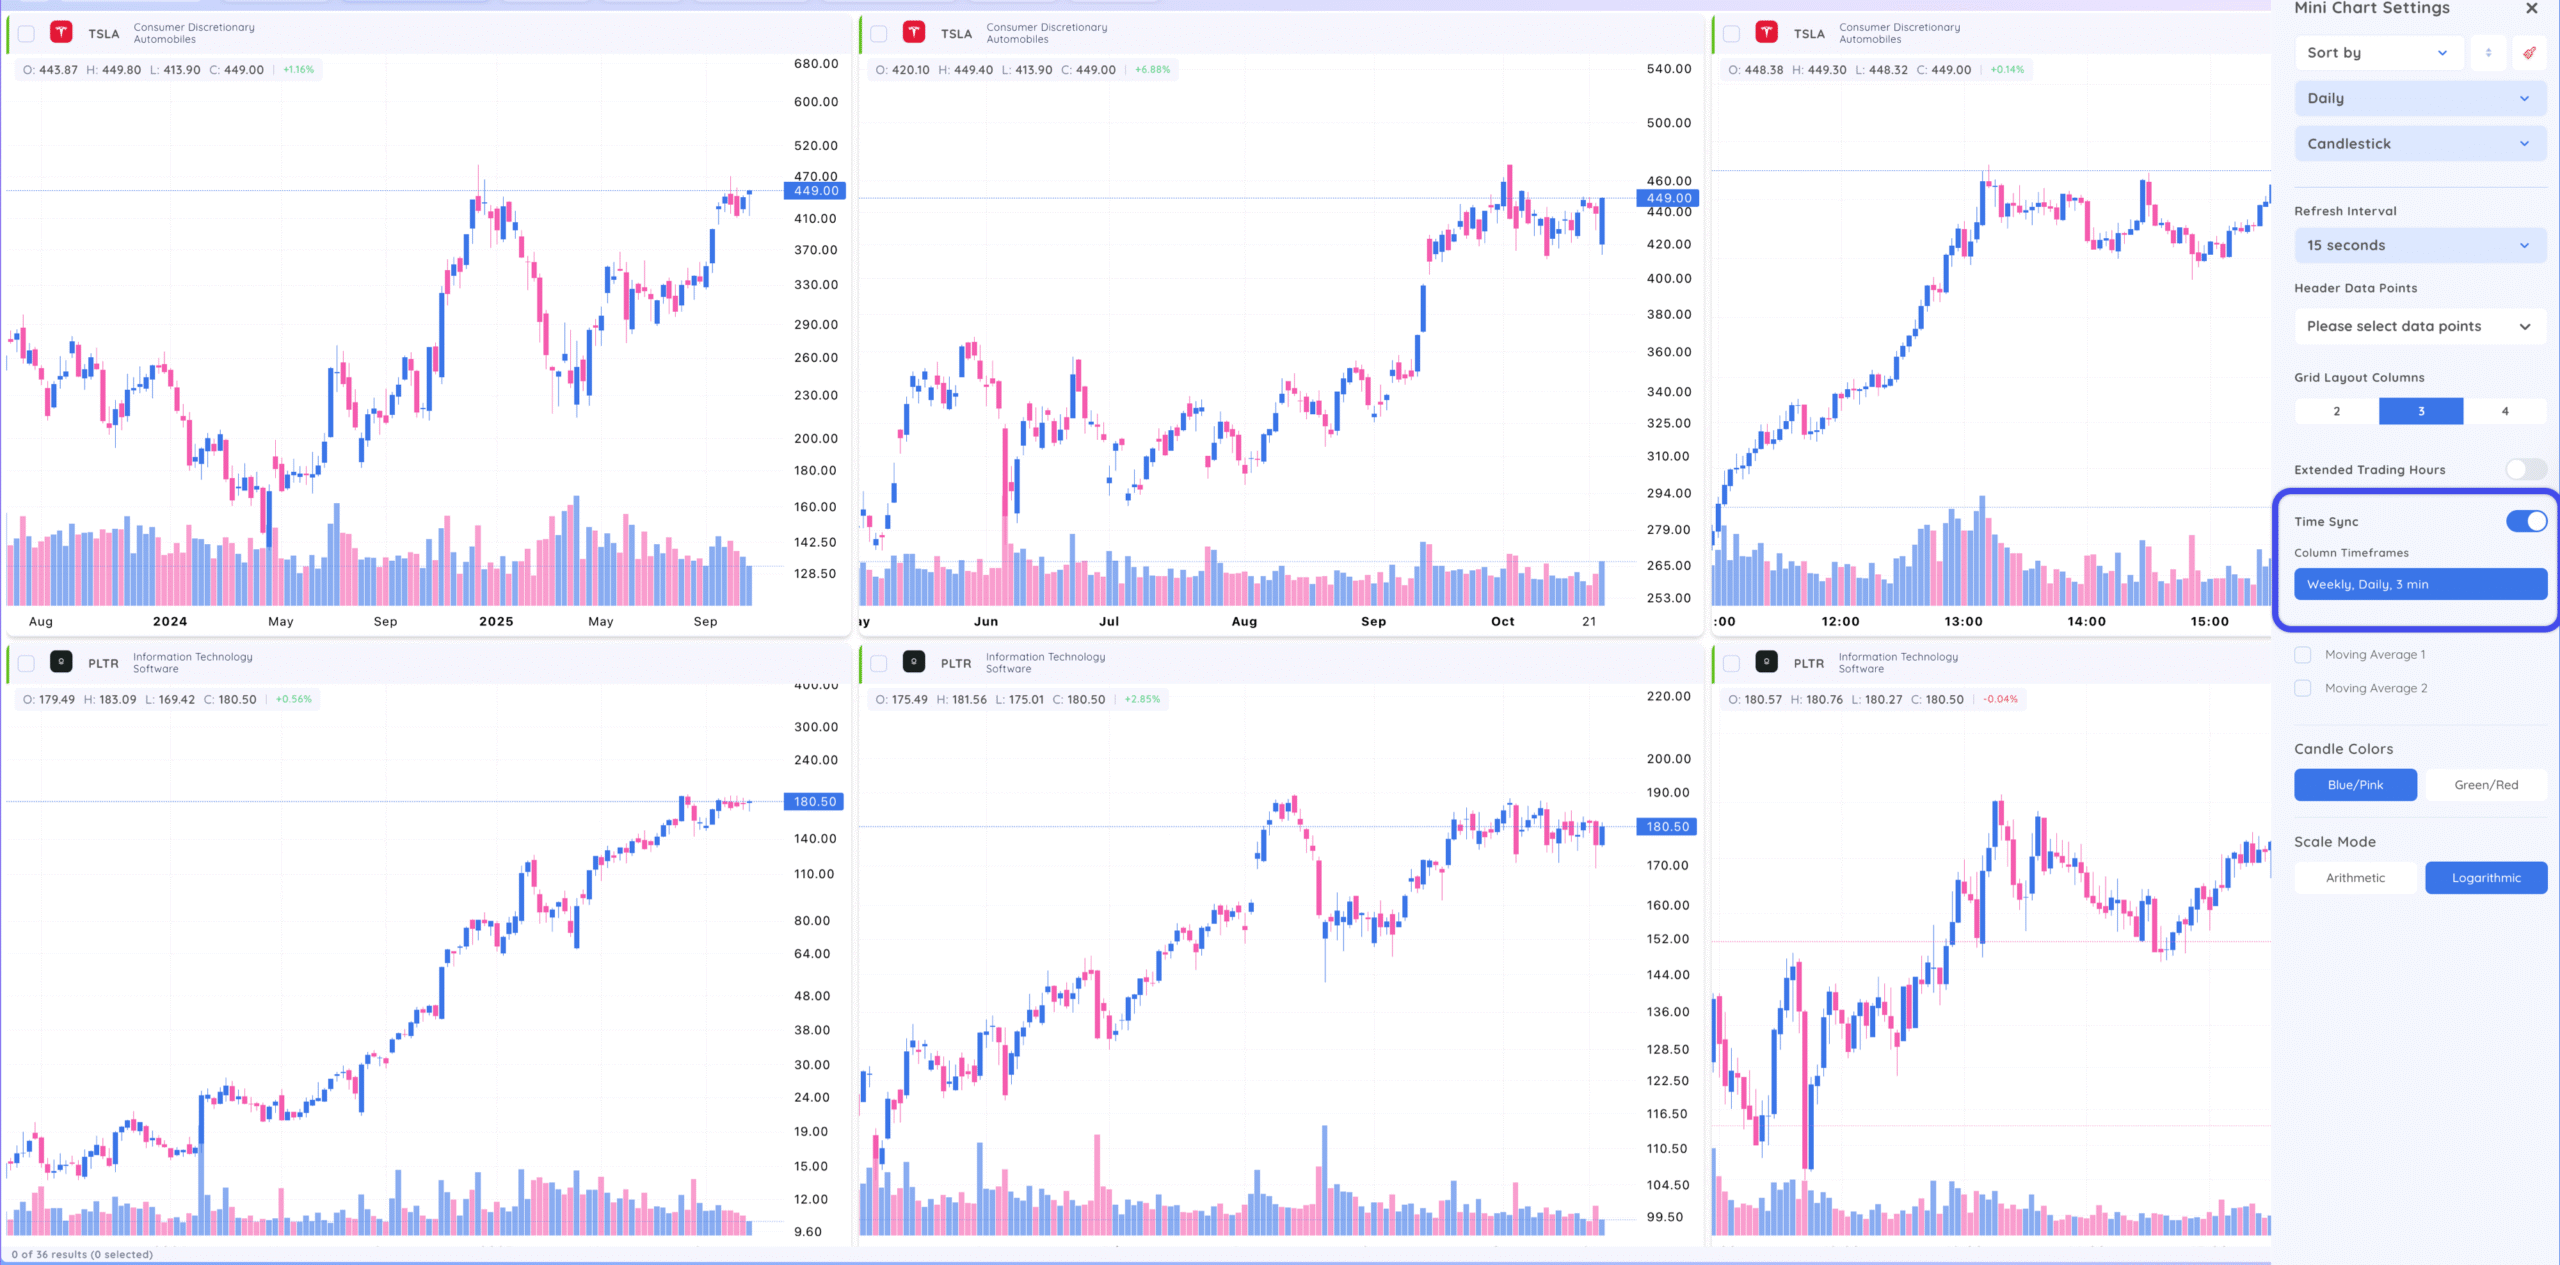
- Time Sync: Select this setting to see multiple timeframes at the same time. Change the various columns to your desired timeframes – You will now see one symbol per column in multiple timeframes.
- Moving Averages: Toggle up to two moving averages. Select the value and simple or exponential.
To return to single chart view, click the single chart icon.

