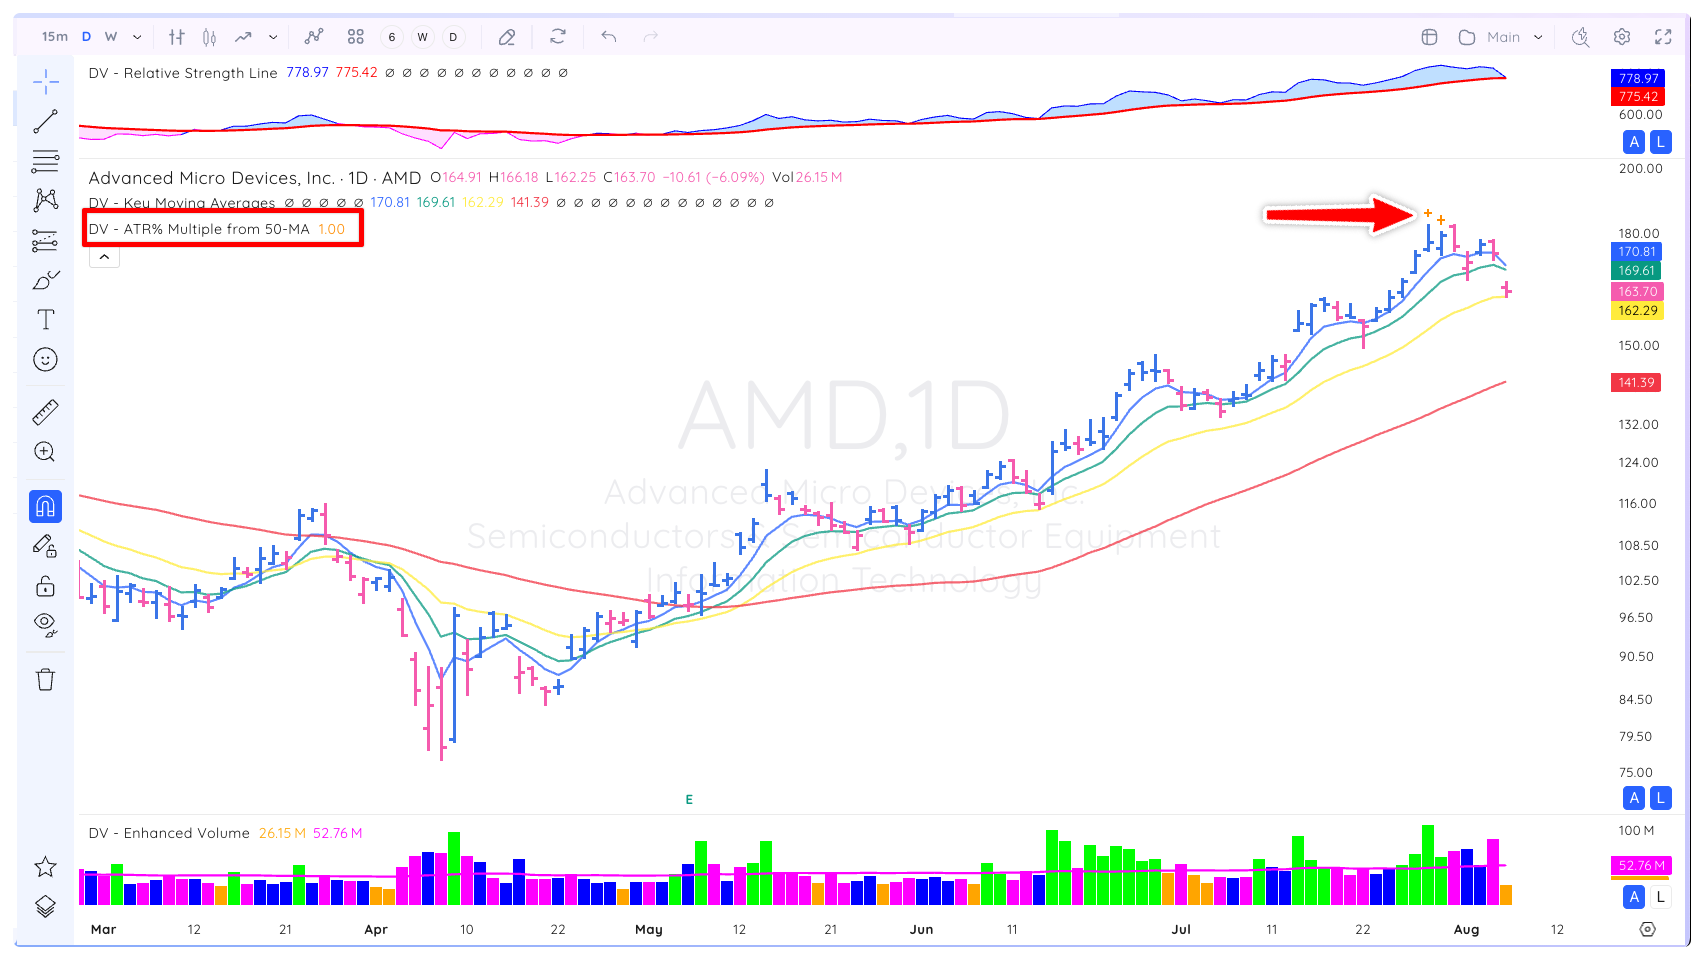
The ATR % Multiple from the 50 day Moving Average indicator, developed by Jeff Sun, plots a visual marker on the chart when a stock gets extended a certain % of it’s ATR from the 50 day MA. This indicator is useful for scaling out of positions, taking partial profits and determining when a stock is extended and likely to rest or create a new base.
In this example we can see the visual markers plotted on AMD when it reached 10 times it’s 14-day ATR from the 50 day MA.

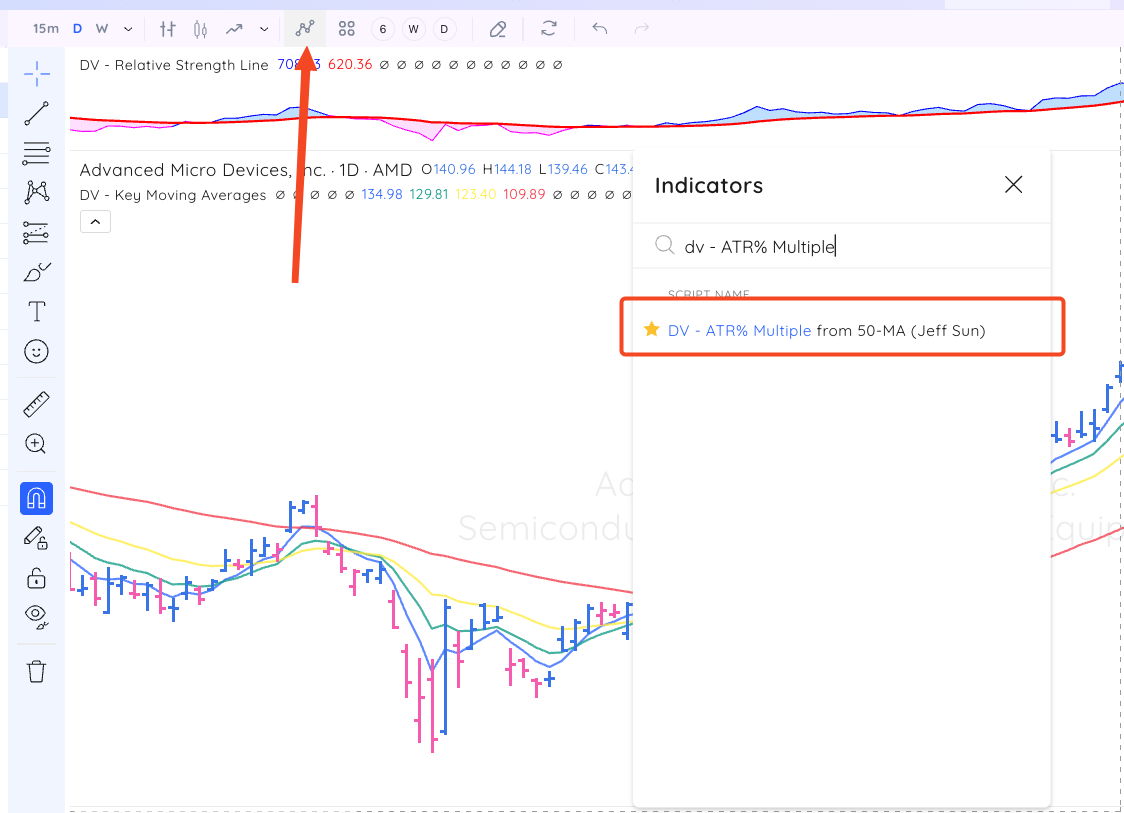
To add this indicator to your chart, open the indicator menu and search DV – ATR% Multiple then click to add it to your chart.

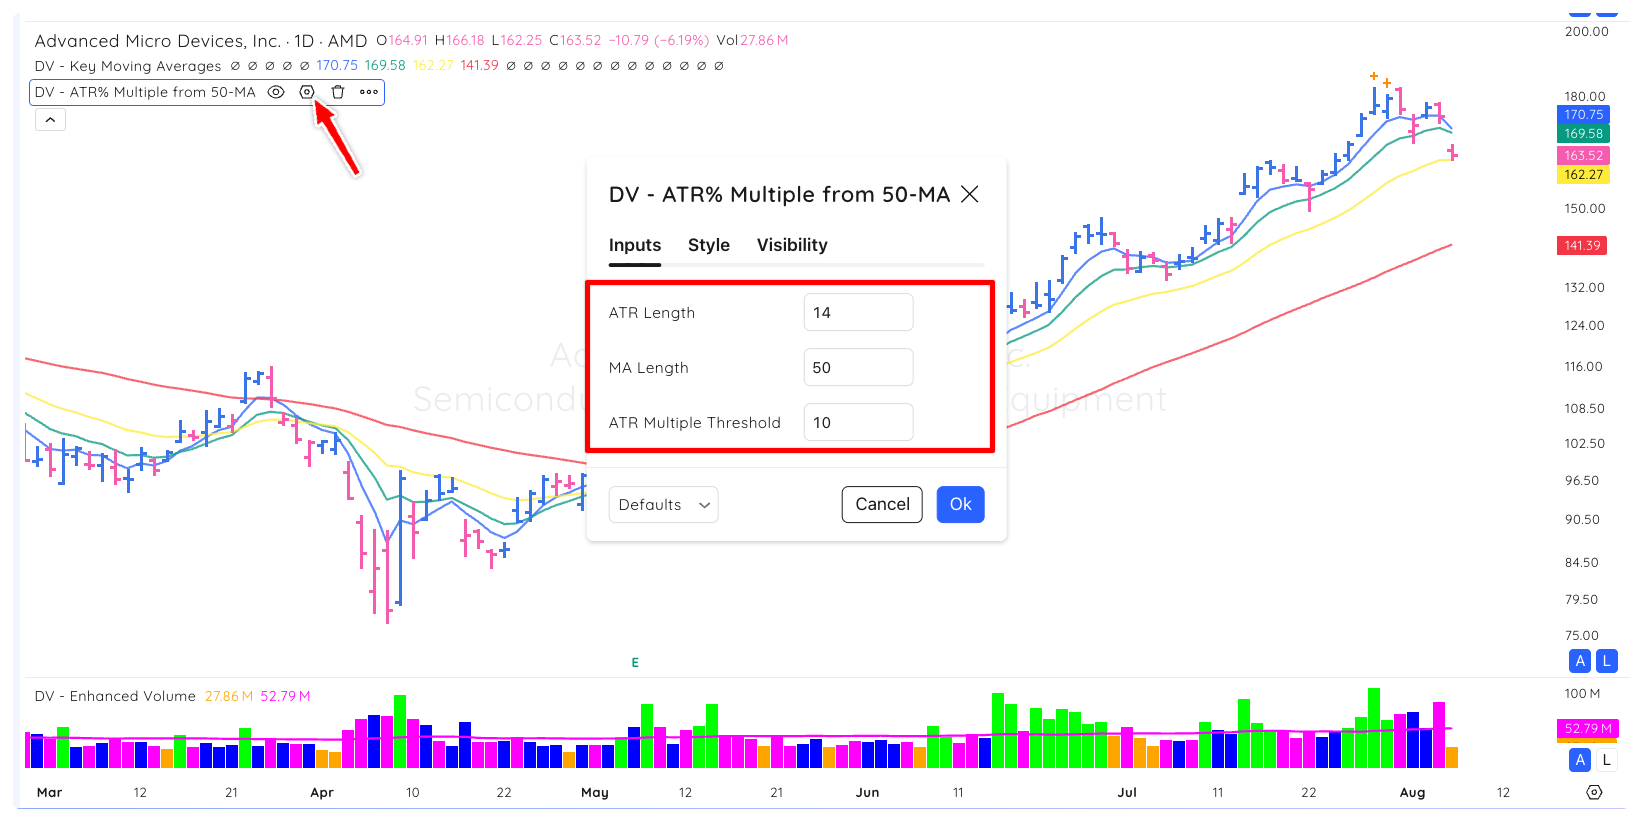
You can customize the ATR length, MA length and ATR Multiple threshold to suit your preferences in the indicator settings.

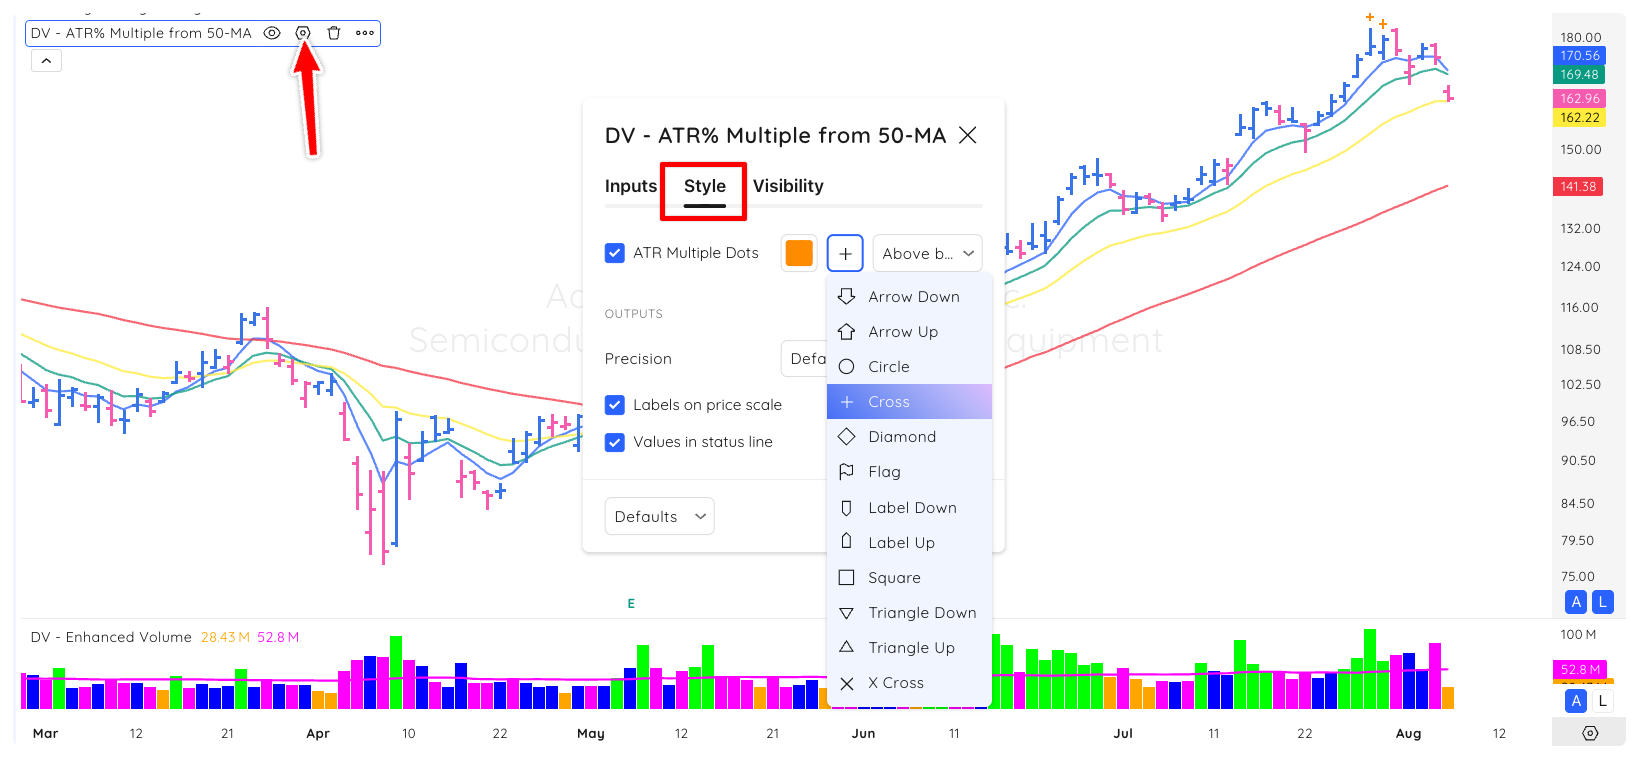
Similarly, under the Style tab, you can change the styling, position and colour of the the marker.

