Post-Trade Analysis
Last Updated:
November 4, 2026


Post-Trade Analysis: How to Review Your Trades and Find Your Edge
A step by step review process, the trading metrics worth your attention, a template you can copy and a routine that turns closed trades into better rules.
Post-trade analysis is the review you do after a trade closes. You compare the trade with your plan, score the result in R, tag the setup and how you felt, then study many trades together to learn which setups and habits pay. The Deepvue Trading Journal syncs your fills and does the math.
In a study of soldiers on navigation exercises, the group that reviewed its successes as well as its failures after each training day improved significantly more than the group that only picked apart what went wrong. Many traders review the other way, if they review at all.
Never miss a Deepvue blog post.
They replay the worst loss of the week, feel bad about it and move on, while the trades that worked never get a second look. A real post-trade analysis treats both as data, so you learn what to repeat as clearly as what to avoid.
It’s the routine we built the Deepvue Trading Journal around, with fills that sync from your broker and a review queue that shows which trades still need a look. The process works with any journal, and the screenshots come from ours.
Key Takeaways
- •Post-trade analysis reviews the decision behind each trade, then looks for patterns across many trades. P&L on its own can’t separate skill from luck.
- •Score every trade in R. Expectancy, profit factor and your breakeven win rate tell you whether an edge exists at all.
- •Review your winners along with your losers, since a study of soldiers in training found that reviewing both beats picking apart failures alone.
- •Twenty trades of one setup is a hint. With 95% confidence, a 50% win rate over 20 trades only tells you the true rate sits between about 28% and 72%.
- •The Deepvue Trading Journal syncs your fills, flags trades missing a stop or a tag, queues them for review and breaks results out by playbook, emotion, day and symbol, on desktop and mobile.
What Is Post-Trade Analysis?
Post-trade analysis is a structured look back at a trade once it’s closed. You check whether it fit your setup, whether you executed it the way you planned and what the result was in units of risk. Then you file it with the rest of your trades so patterns can show up.
A single trade review tells you how one decision went. Trade analysis across fifty or a hundred trades tells you which setups carry your account and whether your edge holds up when the market changes. Good trading analysis needs both views.
Post-Trade Analysis vs Post-Trade Processing
Search for the term and many of the results describe something else entirely. Banks and brokers use post-trade to mean the back office chain that confirms, clears and settles each transaction. For traders, it means reviewing performance.
| Post-trade analysis (traders) | Post-trade processing (institutions) | |
|---|---|---|
| Who does it | You, after a trade closes | Brokers, clearinghouses and custodians |
| Question it answers | Did I follow my plan, and is my edge real? | Did the trade confirm, clear and settle correctly? |
| Main inputs | Fills, stops, tags, notes and charts | Trade confirmations, clearing records and settlement instructions |
| Typical measures | R multiple, expectancy, win rate, profit factor, MAE and MFE | Settlement status, failed trades and transaction cost analysis |
| Timing | Each session, then weekly and monthly | US stocks settle one business day after the trade under the T+1 cycle |
Institutions also run post-trade analytics on execution quality, measuring slippage against benchmarks such as the arrival price. You can do a simple version yourself by comparing each fill with the price you planned to pay and adding commissions and fees to the cost of the trade.
Where Post-Trade Analysis Fits in Your Trading Day
Your pre market analysis and trade plan decide what you’ll buy, where and with how much risk. Post-trade analysis closes the loop by grading how that plan held up once real money was on the line, and its lessons feed straight into tomorrow’s plan.
Why Reviewing Your Trades Works
Performance researchers have studied reviews, debriefs and written reflection for decades, and five of their findings map closely onto trading:
- •Reviewing wins teaches as much as reviewing losses. In After-Event Reviews, published in the Journal of Applied Psychology, soldiers who reviewed their successes and failures after each day of navigation training improved significantly more than those who reviewed failures only.
- •Learning from errors makes skills travel. In Error Management Training, a Journal of Applied Psychology meta analysis of 24 studies, training that treated errors as learning material beat training that steered people away from them, with the biggest gap on unfamiliar tasks.
- •People who log a behavior tend to change it. A systematic review of 22 studies, Self-Monitoring in Weight Loss, in the Journal of the American Dietetic Association, consistently found a significant link between self monitoring and weight loss.
Together, the three point to one routine: write down what happened, look at the wins as closely as the losses and come back to it on a schedule. A trading journal gives that routine a home, with the numbers attached.
BLACK FRIDAY
Let Your Own Trades Name Your Best Setup
Sync your broker, tag a few weeks of trades and the Deepvue Trading Journal ranks every playbook, emotion and trading day by what it earns you. A full year of Deepvue Core + Journal is $490 on the Black Friday offer.
The Trading Metrics That Matter in Post-Trade Analysis
Dollar P&L is the least useful number in a review, because it mixes up position size with skill. These trading performance metrics measure the quality of your trades instead, and each one has a home in the Deepvue Trading Journal.
| Metric | How it’s calculated | What it tells you | Where in Deepvue |
|---|---|---|---|
| Win rate (batting average) | Winning trades divided by all closed trades | How often your setups work | Performance Overview |
| R multiple | Profit or loss divided by the risk you planned at entry | Each result in units of risk, so trades of any size compare fairly | Trades tab and R-Multiple Distribution |
| Trading expectancy | (Win rate × average win) minus (loss rate × average loss) | What an average trade earns, in dollars or R | Trading Edge |
| Profit factor | Gross profit divided by gross loss | Whether total wins outweigh total losses | Performance Overview and every Performance by app |
| Maximum drawdown | Largest drop from an account peak | The worst stretch you’d have to sit through | Risk & Consistency |
| Maximum adverse excursion | How far price went against you after entry | Whether your stops sit too tight or too loose | Advanced Metrics |
| Maximum favorable excursion | How far price ran your way after entry | How much profit your exits leave behind | Advanced Metrics |
| Heat | Your total loss if every stop got hit | Your real risk, before and after stop changes | Open Risk and the Trades tab |
A Worked Example: Ten Trades Scored in R
Take a hypothetical record of ten trades, each scored in R, with the note a review would add:
| Trade | Setup | Result | What the review found |
|---|---|---|---|
| 1 | Base breakout | +2.5R | Bought at the pivot with volume, sold into strength by plan |
| 2 | Pullback | −1.0R | Valid setup, stopped out cleanly |
| 3 | Base breakout | +1.8R | Followed the plan |
| 4 | Opening gap | −1.0R | Entered late, after the opening range broke |
| 5 | Pullback | −0.6R | Sold before the stop on nerves |
| 6 | Base breakout | +3.2R | Held through a shakeout, as the plan allowed |
| 7 | Opening gap | −1.0R | Valid setup, stopped out |
| 8 | Pullback | +0.4R | Sold early out of fear; the stock ran another 2R after the exit |
| 9 | Opening gap | −1.2R | Gapped through the stop, so the loss ran past the planned 1R |
| 10 | Base breakout | +1.1R | Followed the plan |
Five wins and five losses give a 50% win rate. The winners average 1.8R and the losers about 0.96R, so expectancy works out to roughly +0.42R a trade, and profit factor is about 1.9. Risk $500 a trade and that edge is worth around $210 per trade on average.
The bigger lessons come from the review notes. Base breakouts made all the money, opening gaps lost every time and two trades were cut short by fear. One record can’t prove that pattern yet, but it tells you exactly what to watch over the next twenty trades.
The Breakeven Win Rate for Your Reward to Risk
Your win rate only means something next to the size of your wins. The breakeven win rate is 1 divided by (1 + your average win in R over your average loss in R), and the risk reward calculator works it out for any ratio:
| Average win vs average loss | Breakeven win rate | In plain terms |
|---|---|---|
| 1 to 1 | 50% | You need to win half your trades |
| 1.5 to 1 | 40% | Four winners in ten break even |
| 2 to 1 | 33% | One winner in three breaks even |
| 3 to 1 | 25% | One winner in four breaks even |
Across those ten trades, winners run about 1.9 times the size of losers, so the breakeven win rate is around 35%. A 50% win rate clears it comfortably, which is why the record makes money despite five losses.
How Many Trades You Need Before a Stat Means Anything
Small samples lie, and trading statistics built on a handful of trades are mostly noise. Using a standard 95% confidence range, the true win rate behind a 50% record can land far from 50%, depending on how many trades it rests on:
| Trades in the sample | Likely range of the true win rate | How much weight to give it |
|---|---|---|
| 20 | About 28% to 72% | A hint worth watching |
| 50 | About 36% to 64% | A pattern starting to form |
| 100 | About 40% to 60% | Enough to adjust a rule |
| 200 | About 43% to 57% | Solid ground for sizing decisions |
The practical rule is to judge a setup on dozens of trades and to change one thing at a time so you know what caused the result. Separate playbooks matter here, because a blended win rate can hide one strong setup behind a weak one.
BLACK FRIDAY
See Your Own Expectancy in R
Connect a broker, add your stops and the Deepvue Trading Journal scores every trade for you. Deepvue Core + Journal costs $490 for the year with Black Friday pricing.
How to Do Post-Trade Analysis in 7 Steps
The routine works in a spreadsheet or any journal. We know the Deepvue Trading Journal best, so each step also points to the place it happens there.
1. Get Every Fill Into One Record
A review built on missing or retyped trades will mislead you. Connect your broker so fills, fees and ledger items such as deposits arrive on their own, and use a CSV import or Add Trade for anything that doesn’t sync. Your own time is better spent on what no broker records:
“Decision points and emotion tracking are much more important.”
A trader on r/Daytrading
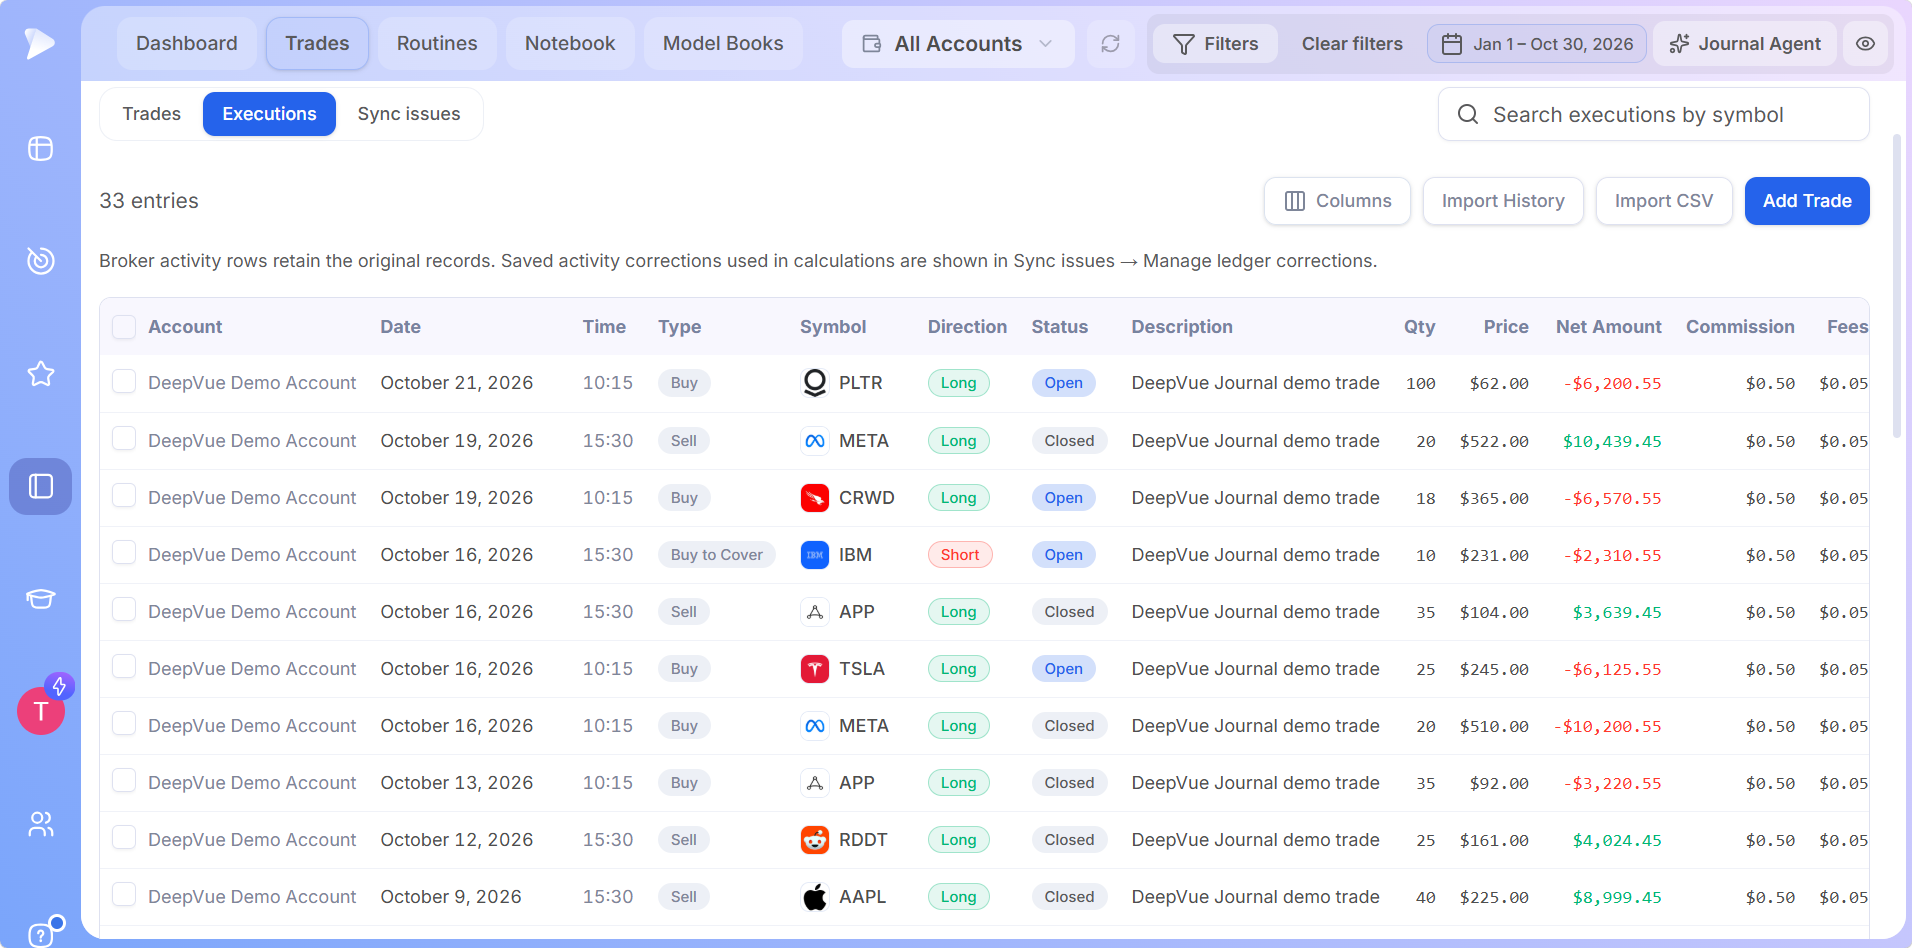
Deepvue syncs with 20+ supported brokers, and most deliver your full trade history in under 24 hours. The Executions tab keeps the full ledger behind every stat, with commission and fee columns, and the Sync issues tab is where you fix an import while the original broker rows stay intact.
2. Give Every Trade a Stop
R, heat and expectancy all depend on knowing what you risked. Without a stop, a review can only talk about dollars, and dollars mix size with skill.
In the Trades tab, the Needs Stop filter shows every position missing one, and each one gets an Add stop field in its row. Enter the price and R updates on the spot, along with original heat, the risk you planned, and current heat, the risk you hold now.
3. Tag the Setup, the Reason and the Emotion
Tags are what turn a list of trades into trading analytics. Give each trade a playbook for the setup, tags for the conditions you care about, such as relative strength or a volume signal, and the emotion you felt when you clicked buy.
Keep the labels consistent. Five clear playbooks applied to every trade beat twenty vague ones applied now and then, and the Untagged filter in Deepvue catches the trades you skipped.
One tip from Reddit is worth borrowing: give every trade outside your playbook a No setup label, then count them at the end of the month. Make it a tag in Deepvue and Performance by Tag shows exactly what those impulse trades cost.
4. Replay the Trade on the Chart
Numbers tell you what happened, and the chart tells you why. Look at where you bought relative to the setup, how the stock acted after entry and whether your exit followed a rule or a feeling.
Pick a trade in the To Review filter of the Trades tab and its review opens on a Deepvue chart, with each buy and sell marked. Write a pre trade note with the plan and a post-trade note with the lesson, then Save and next marks it reviewed and opens the following trade.
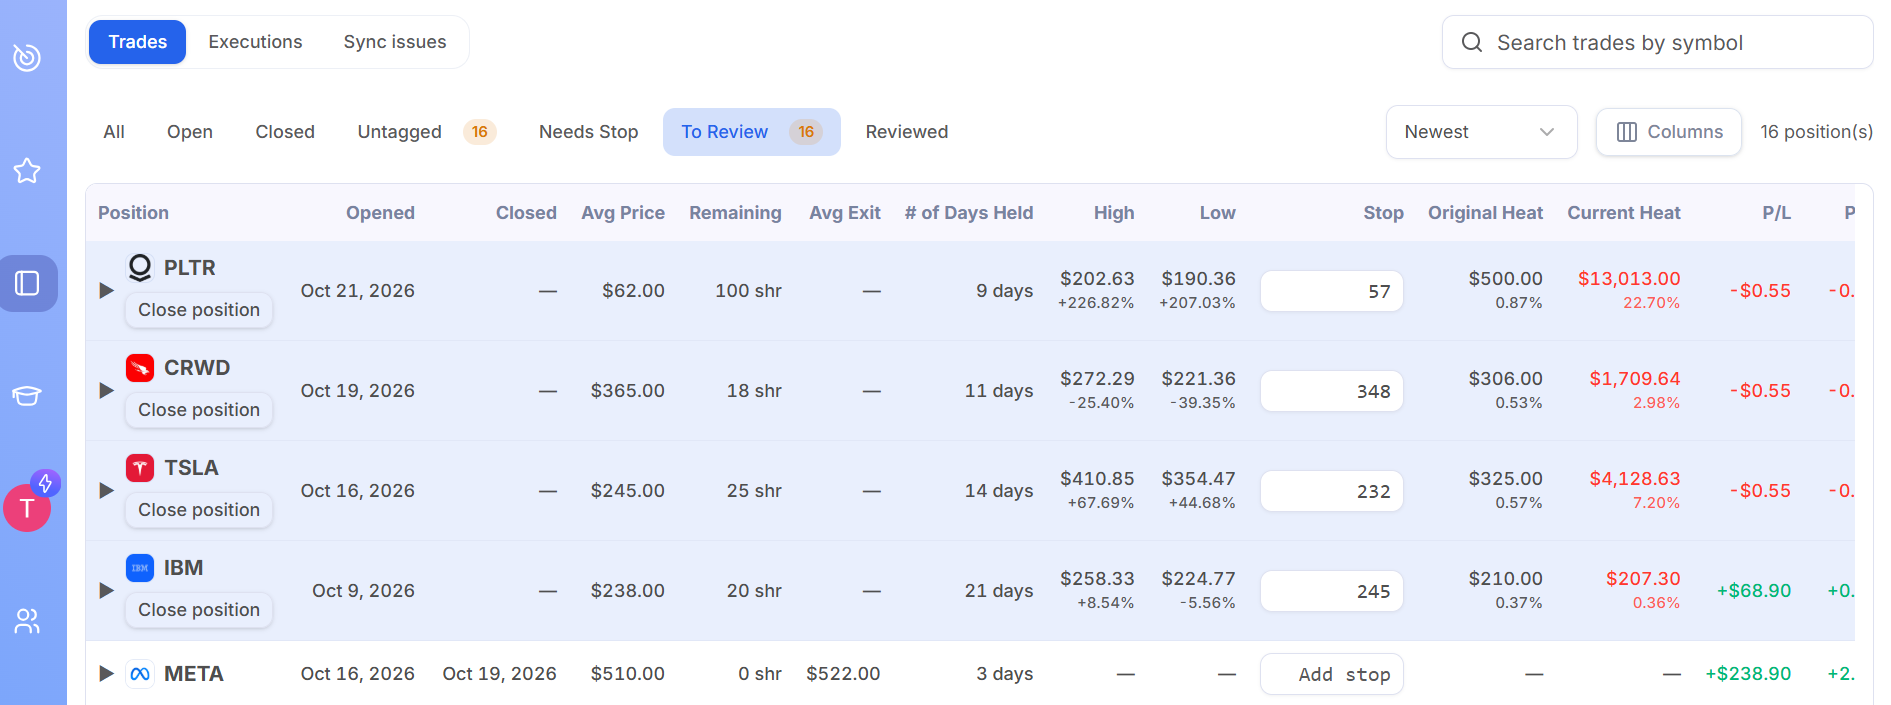
The high and low columns show each open position’s high and low price, with the percentage measured against your average price, a quick read on how far the stock has moved for you or against you. Advanced Metrics tracks the same idea across your trades as MFE, MAE and exit efficiency.
Seeing a review in motion makes those columns and notes easier to follow. In the launch webinar, Deepvue’s team shows the new journal in action, trade reviews included.
Watch how to review trades and read your stats in the Deepvue Trading Journal here.
5. Grade the Decision Separately From the Result
A good trade can lose and a bad trade can win, yet results color how we judge the choice. In Outcome Bias in Decision Evaluation, people rated the same decision as better reasoned, and its maker as more competent, when it happened to turn out well.
Grading process apart from outcome stops a lucky win from teaching you the wrong lesson:
| Trade made money | Trade lost money | |
|---|---|---|
| Followed the plan | Earned win. Repeat it, and save it as an example. | Good loss. The cost of doing business. Change nothing. |
| Broke the plan | Lucky win. The most dangerous trade to learn from. Fix the habit anyway. | Earned loss. Find the rule you broke and why. |
A simple A to D grade for process, written in the post-trade note, makes this quick. Over time, the share of A and B trades becomes a trading performance number of its own.
6. Study Your Trades in Batches
One trade rarely changes a rule. A batch does. Once a week, filter by date range and tag and look at the numbers together, which is where Performance by Playbook and the other Dashboard apps do the heavy lifting.
7. Change One Rule at a Time
Finish every review with a single action: trade a setup more, trade one less, tighten an entry rule or size down in a weak market. Write it in your Notebook, test it for the next batch of trades and measure again before changing anything else.
BLACK FRIDAY
Get a Second Read on Your Trades
Ask the Journal Agent to review your recent trades and it answers with what it noticed, your biggest opportunity and one thing to test next. Lock in a full year of Deepvue Core + Journal for $490 by December 4.
Trading Journal Analysis: Reading Your Results in Deepvue
A journal for trading analysis earns its keep in the Dashboard. Each app turns your trade analytics into an answer to one question, and the numbers update as you add stops and tags. Our journal features guide covers every app; these are the ones that do the most work in a review.
Performance Overview: Is the Account Healthy?
Performance Overview puts your account value against your starting balance, along with equity P&L, open profit, batting average, profit factor, trade count and your net, long and short exposure. Hover over any figure for its definition.
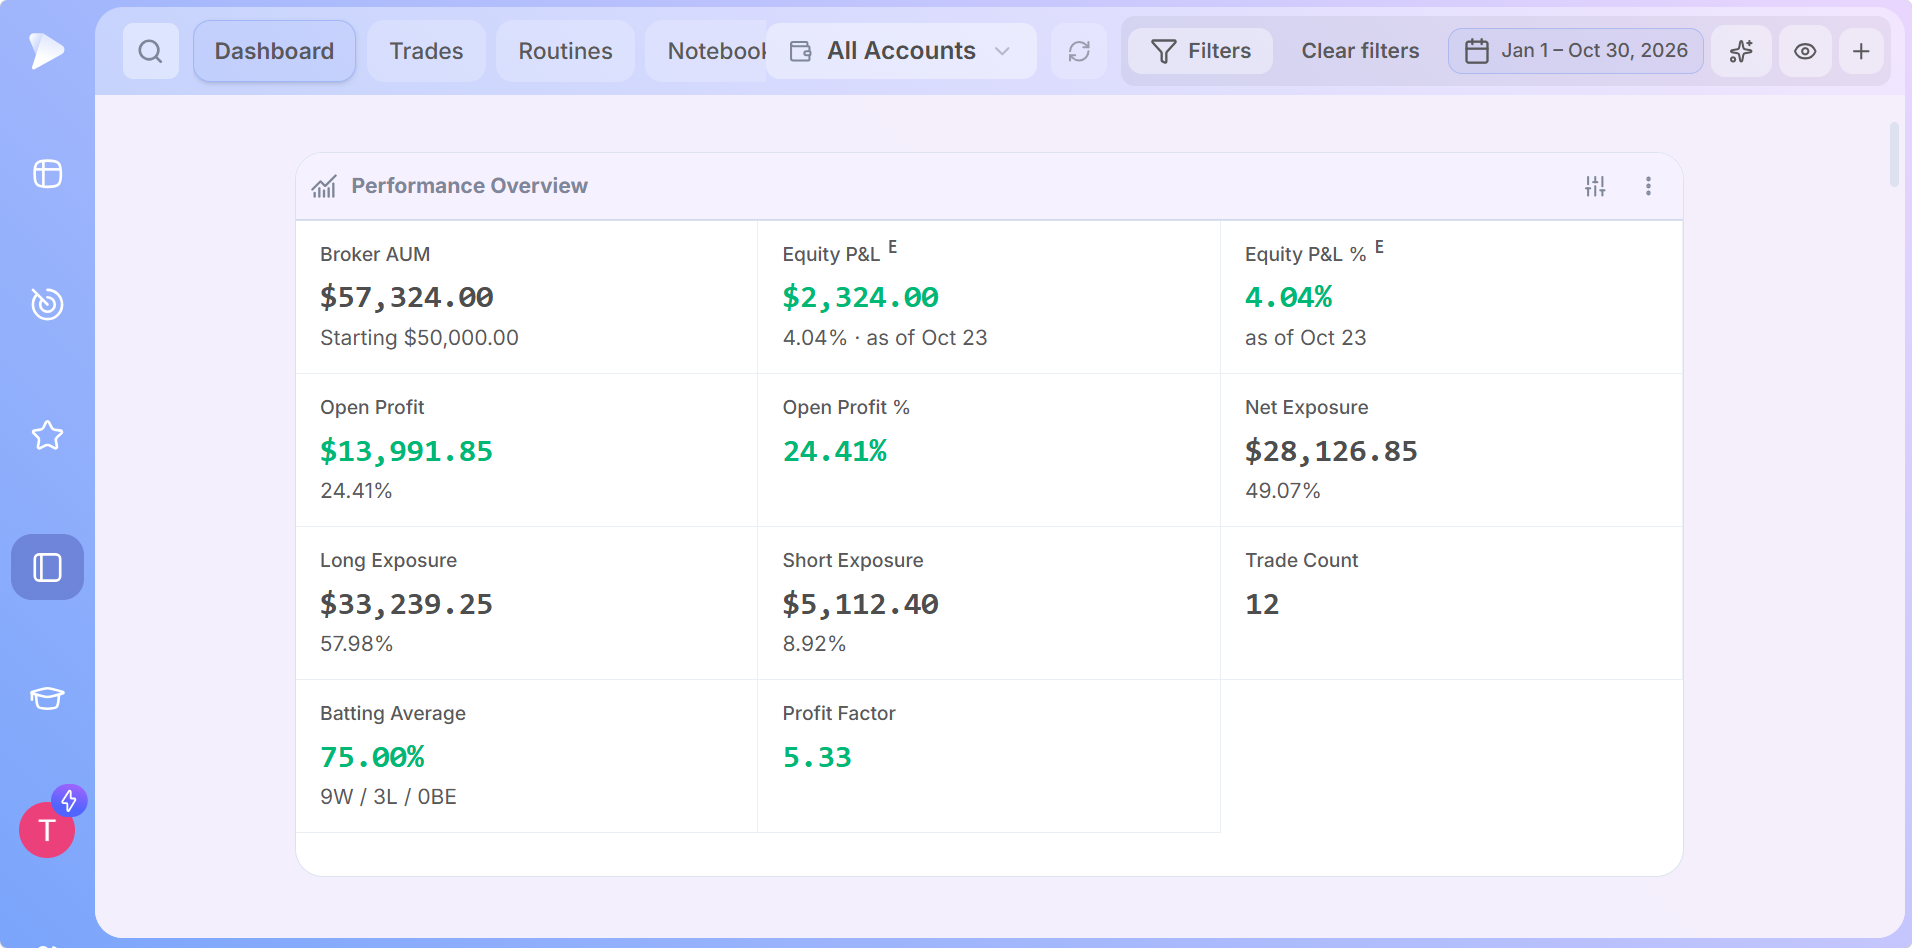
Read exposure next to the market. Heavy long exposure during a weak tape is often the first cause a review uncovers, well before any single trade looks wrong.
Calendar: When Do the Good and Bad Days Cluster?
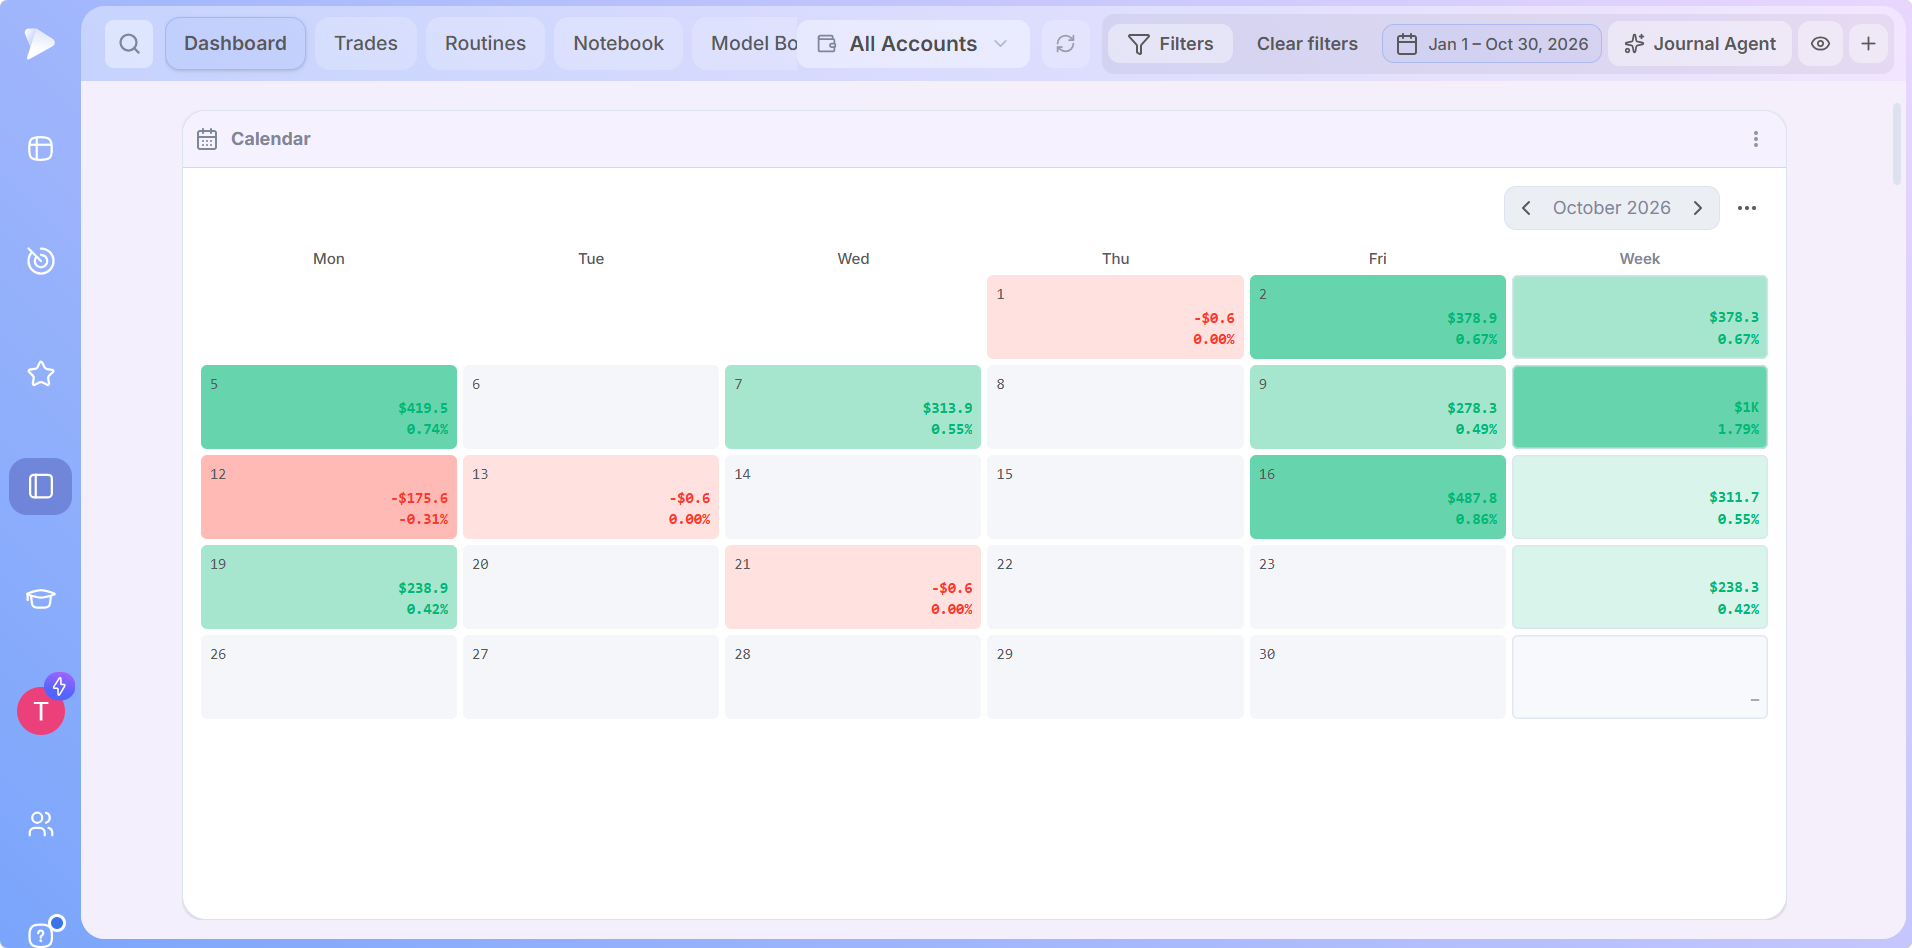
The Calendar shades each day by P&L and totals every week. Look for streaks: a run of red days right after a big win often points to overconfidence, while a quiet week after losses can show you backing off just as your setups improve.
“Tilt after a loss you notice. tilt after a win just feels like confidence.”
A trader in the same r/Trading thread on whether journaling helps
Performance by Playbook and Day of Week
Performance by Playbook scores each setup on P&L, profit factor, average R and win rate across its trades, which makes it the most direct answer to which setups deserve more of your capital. Performance by Day of Week runs the same numbers for each trading day.
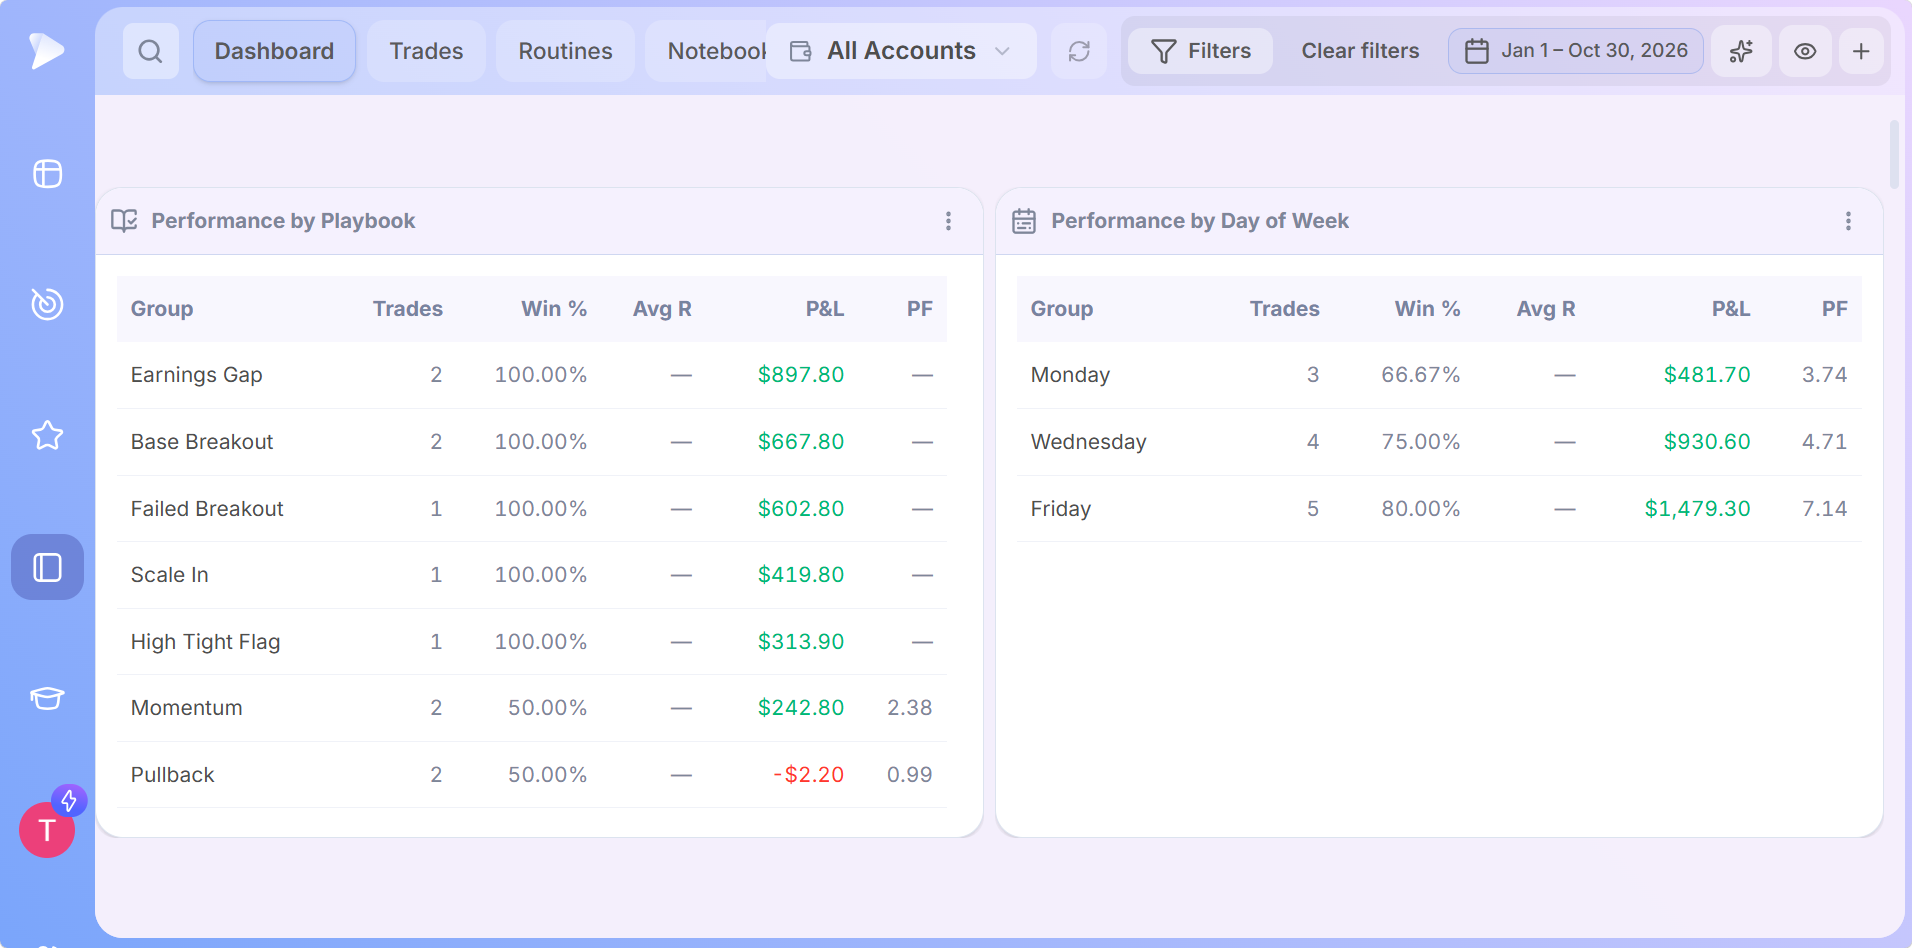
If one day keeps losing, check what those trades share. Monday entries that chase a weekend gap, or Friday trades taken to make up for a slow week, can show up here first.
Performance by Emotion: Your Trading Psychology Journal in Numbers
Most traders keep a trading psychology journal in their heads, which means it never gets tested. Log an emotion with each trade, such as calm, focused or confident, and Performance by Emotion shows the win rate and P&L behind each state of mind.
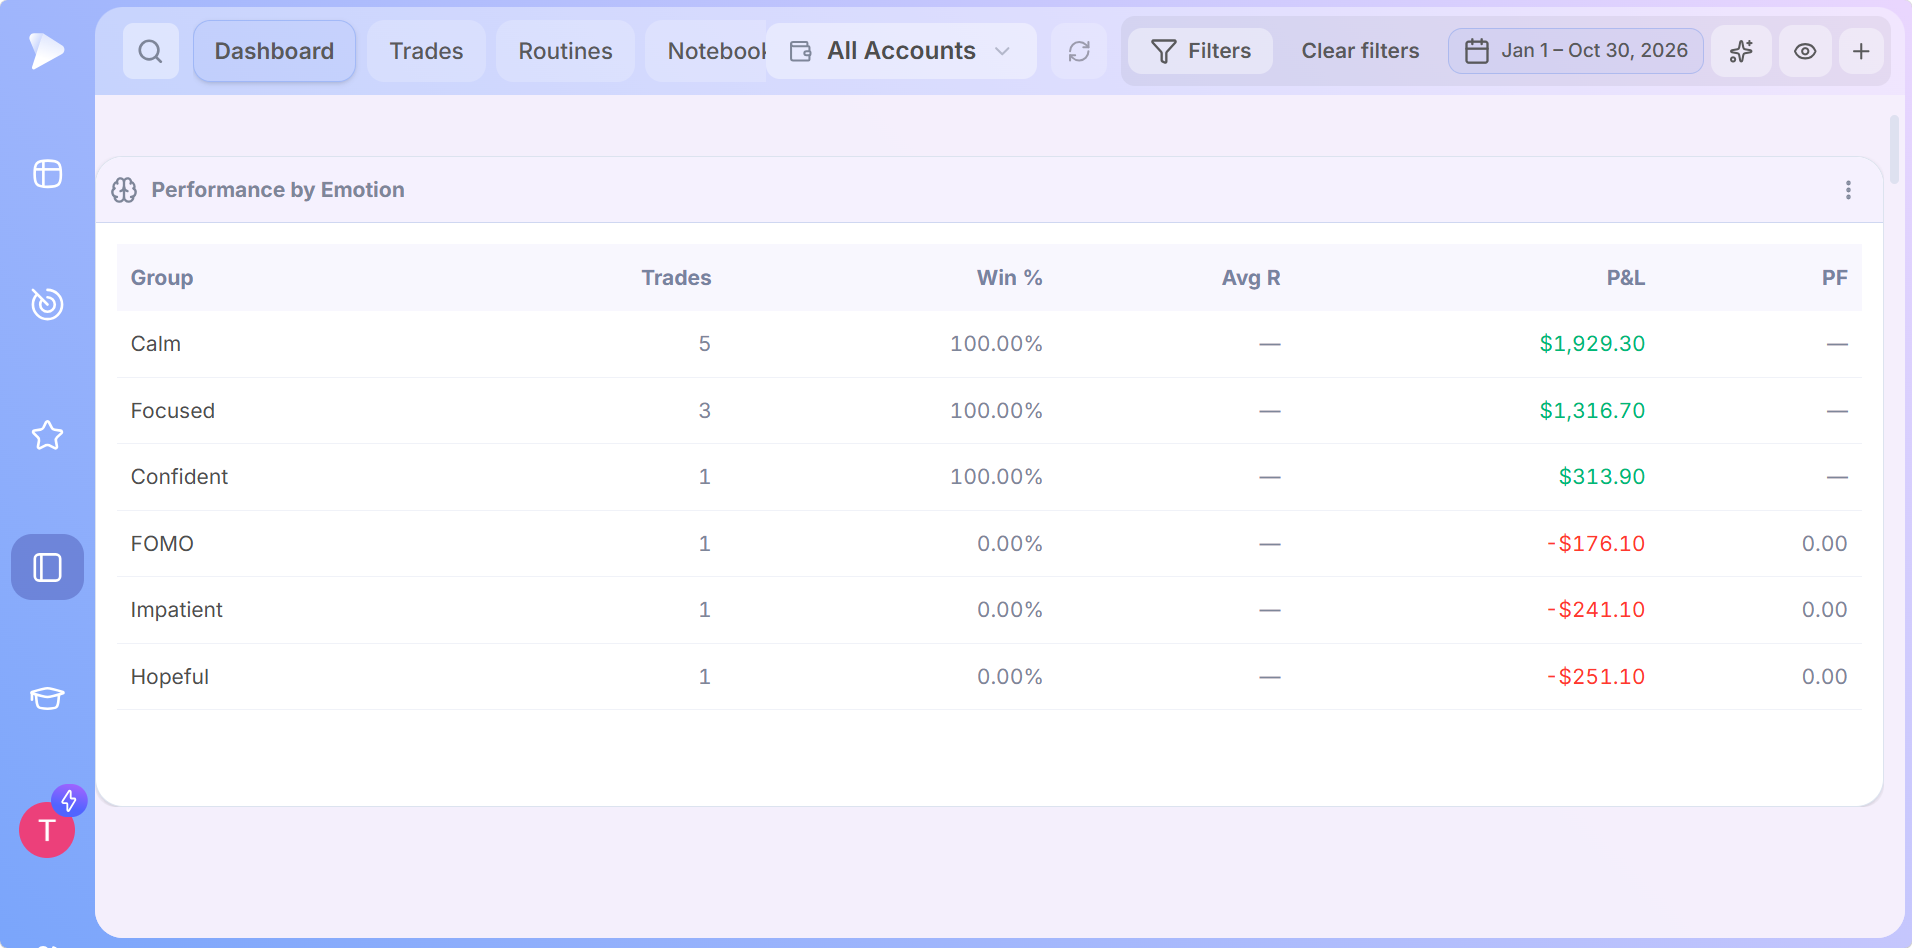
When the losing rows all carry the same feeling, you have a rule to write. A pause before any trade logged with that emotion costs nothing and can save a lot.
Performance by Symbol: Which Stocks Keep Costing You?
Performance by Symbol lists every ticker you traded with its results. Repeat losers on the same name often mean you’re forcing a stock you like onto a setup it isn’t forming.
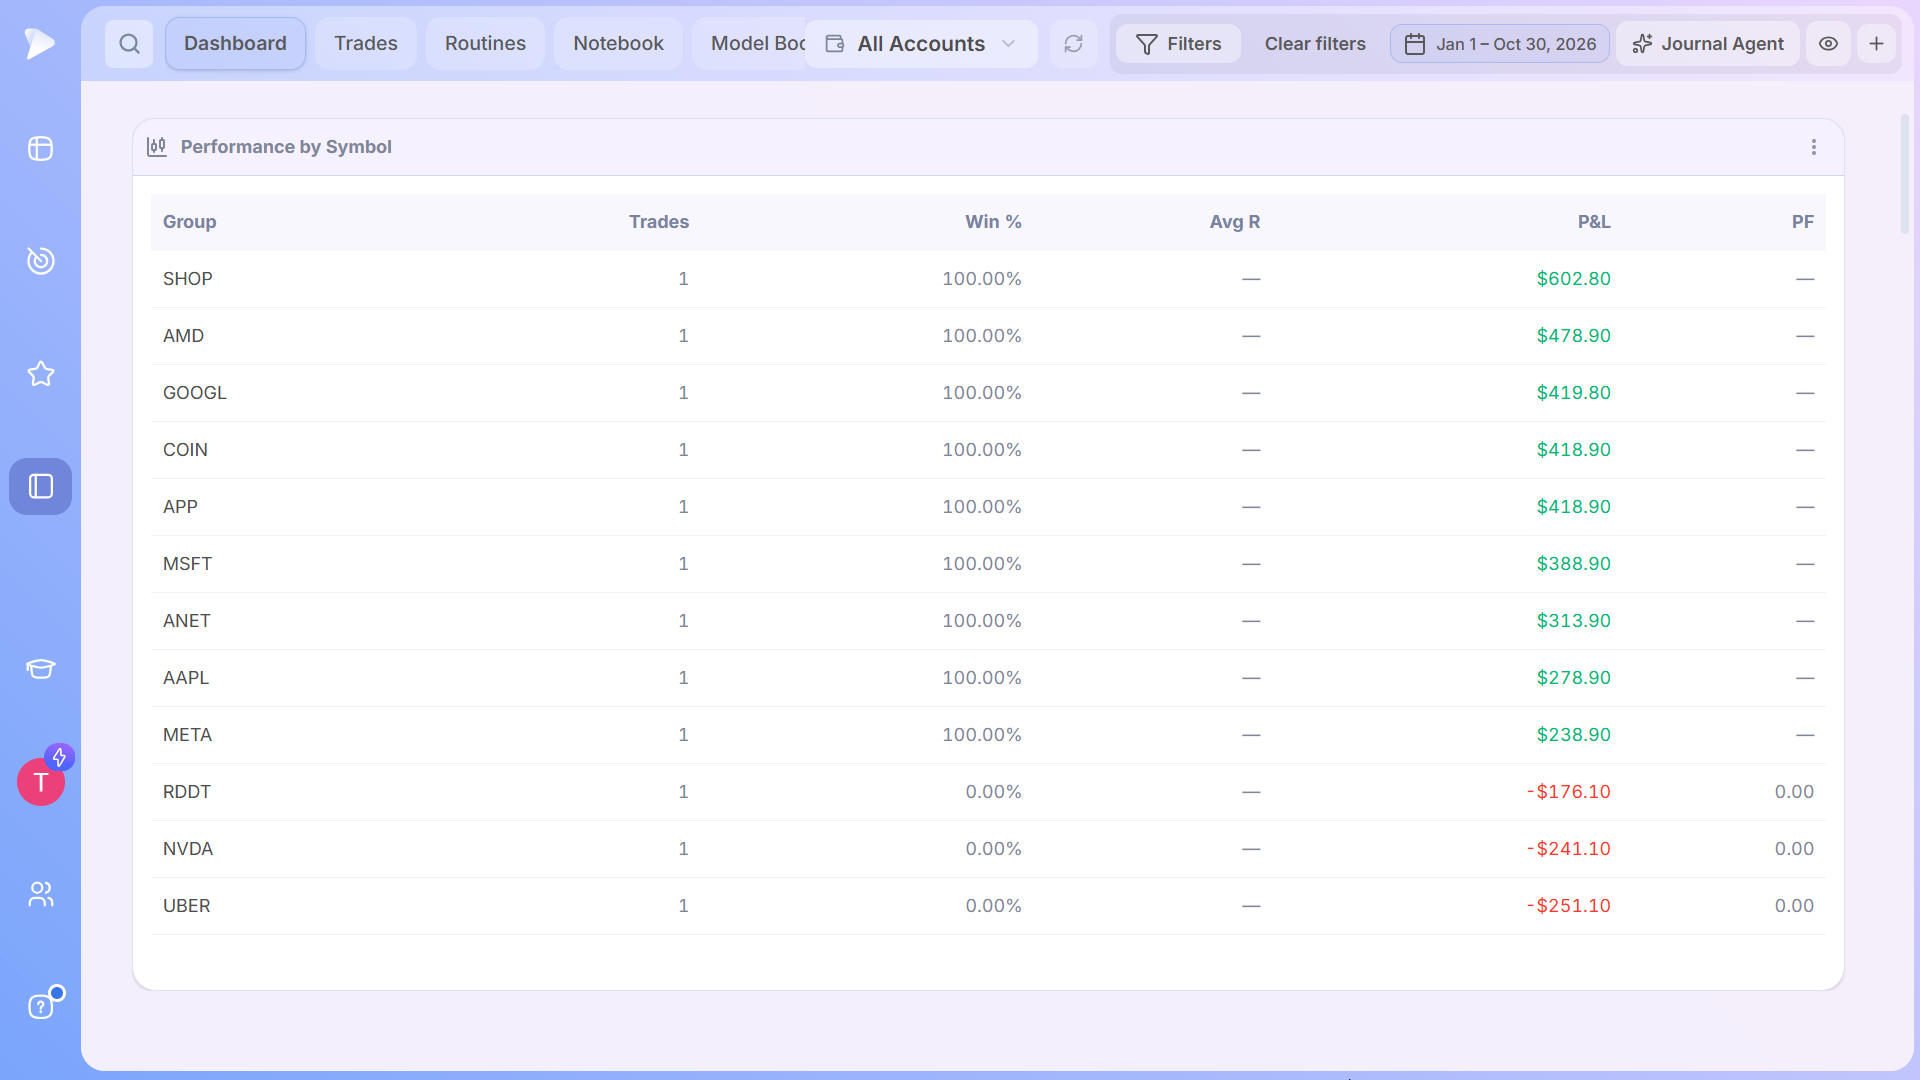
Performance by Tag and the R-Multiple Distribution round out the set. The first shows which conditions you tag tend to precede winners, and the second shows whether your losses stay near 1R or spread wider than you planned.
A Post-Trade Analysis Template You Can Copy
Use this trading checklist for every closed trade. Paste it into a note once, then reuse it each time:
- •The facts. Setup, entry, exit, stop, size, result in R and days held.
- •The plan. Did the trade meet every rule of the setup? Was the stop set before entry, and was size within your risk limit?
- •The entry. Did you buy near the planned price or chase it? How far was the fill from your alert or pivot?
- •The exit. Did you sell by rule or by feeling? How much further did the stock run, or fall, after you left?
- •The risk. Did you move the stop against the trade? Did current heat climb past what you planned to risk?
- •The market. Was the market in an uptrend, and was the stock’s group leading or lagging?
- •Your state of mind. What did you feel at entry and at exit, and did it change what you did?
- •The grade and the lesson. A to D for process, plus one sentence on what to repeat or change.
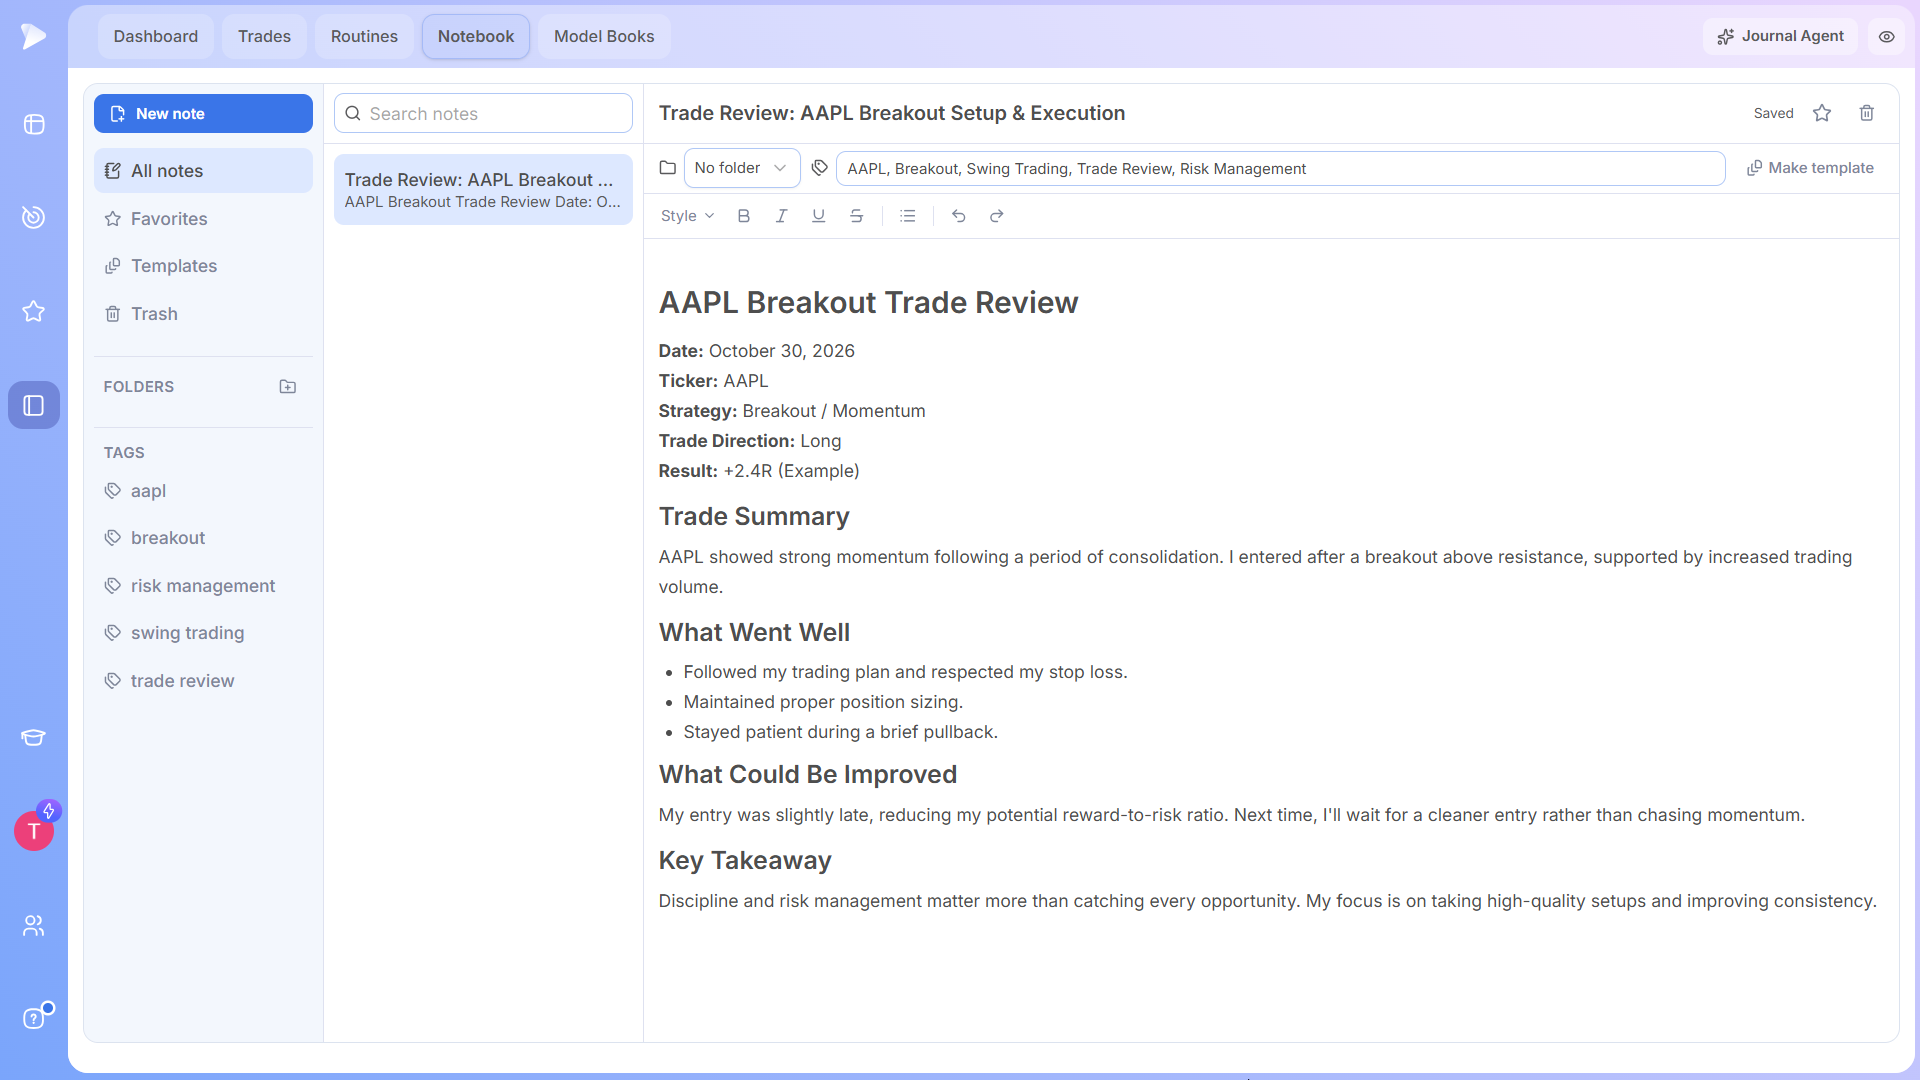
In the Deepvue Notebook, write the checklist once and click Make template, and it’s ready for every trade after that. Typing /chart drops a snapshot of the setup into the note, so the review and the picture stay together.
A Daily, Weekly and Monthly Review Routine
A review only works when it happens on schedule. This cadence keeps the daily part short and leaves the deeper trading performance analysis for when you have a sample worth reading:
| When | Time | What to do | Where in Deepvue |
|---|---|---|---|
| End of each day | 10 minutes | Add missing stops, tag new trades and write a one line trade recap | Needs Stop and Untagged filters, Notebook |
| Weekly | 30 to 60 minutes | Review every closed trade on the chart, grade the process and check the week’s totals | To Review, Save and next, Calendar |
| Monthly | About an hour | Compare setups, emotions, days and symbols, and check expectancy and drawdown | Analytics apps, Trading Edge, Risk & Consistency |
| Quarterly | Half a day | Decide which setups to trade more or drop, update your rules and save your best trades as examples | Performance by Playbook, Model Books, Journal Agent |
If you only keep one habit, keep the weekly trading review. A trader in an r/Trading thread about sticking with a journal named the usual reason routines die:
“most people quit when it becomes a chore.”
A trader on r/Trading
Automation keeps it light. When fills sync on their own, the daily part shrinks to stops, tags and a line of notes, and the Deepvue app for iOS and Android lets you do it on the way home and save the full review for the desk.
Common Post-Trade Analysis Mistakes
These trading mistakes show up in reviews more than in trades, and each one quietly bends the conclusions you draw:
- •Reviewing only losers. The winners hold the pattern you want to repeat, and the soldier study found that learning from both works better.
- •Judging by outcome. A loss on a perfect setup isn’t a mistake, and a win on a broken rule isn’t a success.
- •Hindsight bias. Once you know the ending, every chart looks obvious, and the classic study Hindsight ≠ Foresight found that knowing an outcome makes it seem more predictable than it was. Write the pre trade note before the result exists.
- •Logging only after the close. As one trader on Reddit put it, a note written once the trade is over means “you are writing a story about the outcome.” Record the plan while it’s still a plan.
- •Trusting tiny samples. Ten trades can’t confirm or kill a setup.
- •Ignoring costs. Commissions, fees and slippage turn a thin edge into a losing one, so count them in every result.
- •Changing several rules at once. If results improve, you won’t know which change did it.
- •Skipping open trades. Open risk is part of performance. A stop that never moves up can hand back weeks of gains.
- •Forgetting the trades you skipped. Setups you passed on show whether your filters work. A short Notebook note on each one brings them into the review.
- •Leaving out market context. A good setup in a falling market is a different trade from the same setup in a rising one.
Post-Trade Analysis Inside a Research Platform
Most journals stop at the review. Deepvue puts the journal next to the research tools you used to find the trade, so a lesson can become a screen, an alert or a model before your next entry.
Check the Market You Traded In
When a sound setup fails, the market is often the reason, and plenty of traders only see it once they look back across their losses:
“most of my losers were when i traded against the trend”
A trader on r/FuturesTrading
The market breadth tools on Deepvue’s home screen show breadth readings such as new highs against new lows and advancers against decliners.
Industry Ranks shows whether a stock’s group is leading, and the Theme Tracker shows which market themes are gaining or fading. Note both in your pre trade note so the review can test whether context explains your results.
Ask the Journal Agent for a Second Read
The Journal Agent reviews your record whenever you ask. Start with a suggested prompt such as Review my recent trading performance, or type or say a question of your own, and it answers with what it observed, your biggest opportunity and what to test next.
It works from anonymized numbers and symbols, and its AI provider keeps nothing. The prompts that get the most useful answers are in our AI trading journal guide.
Save Your Best Trades as Models
Your earned wins are the best teaching material you’ll ever have. Save them to Model Books inside the journal and keep them next to the preset setup examples Deepvue’s team built, so you can study what your best trades looked like before they moved.
Find the Next Trade That Fits Your Best Playbook
Once Performance by Playbook shows which setup pays, build a Deepvue screener around it and set price alerts at the pivots. The Position Size Calculator then sizes the next trade from your stop, so the risk you review is the risk you planned.
Take Your Review Queue Anywhere
Claim the Black Friday price in your phone’s browser, then download the Deepvue app for iPhone or Android. Your review queue, tags and the Journal Agent travel with you.
Make Your Next Review Count
Post-trade analysis comes down to a few habits: a complete record, a stop on every trade, honest tags, a weekly review and one rule change at a time. Do that for a few months and your journal will tell you more about your edge than any book.
New Deepvue members get a one on one onboarding session and weekly live webinars, and a fresh journal opens with demo trades, so you can practice the routine before your own history arrives. The setup guide walks through each step.
BLACK FRIDAY DEAL
Start Reviewing Your Trades in Deepvue for $490 a Year
Sync your broker, score every trade in R, see your results by setup and emotion, and get a second read from the Journal Agent, on desktop and mobile, for $490 a year instead of $990. Renewals keep that price while you stay subscribed.
$990 $490 a year, locked in
Frequently Asked Questions
What is post-trade analysis?
Post-trade analysis is the review of a trade after it closes: you check the decision, execution and result against your plan, then compare it with other trades to find patterns. The Deepvue Trading Journal keeps the record, tracks your win rate and adds R and heat once a trade has a stop.
How do I analyze my trade?
To analyze your trade, start with the facts: entry, exit, stop, size and the result in R. Then replay it on the chart, check it against each rule of your setup, note how you felt and write one lesson. Deepvue’s To Review filter lines up every trade still waiting for that pass.
What is the best way to journal my trades?
The best way to journal your trades is to let your broker supply the numbers and save your own time for what only you know: the setup, your reason, your emotion and the lesson. The Deepvue Trading Journal syncs fills from 20+ brokers, so every entry starts with the numbers filled in.
What is the difference between post-trade analysis and post-trade processing?
The difference between post-trade analysis and post-trade processing is who does it and why. Analysis is a trader reviewing performance. Processing is the back office work that confirms, clears and settles trades, which takes one business day for US stocks. Deepvue is built for analysis.
How often should you do post-trade analysis?
You should do post-trade analysis in layers: a few minutes at the end of each trading day to add stops and tags, a full review of every closed trade once a week, and a monthly look at results by setup. Deepvue’s To Review filter keeps count of the trades still waiting.
Can I make $1000 a day by day trading?
Making $1000 a day from day trading is possible, but it takes a proven edge and real capital. If your average trade earns 0.5R and you take five a day, each R must be worth $400, or 1% of a $40,000 account. Your expectancy in the Deepvue Trading Journal shows how close you are.
Can I make $200 per day from trading?
Making $200 per day from trading is possible on a smaller account, though the math still decides it. Two trades a day at an average of 0.5R means each R has to be worth $200, or 1% of a $20,000 account. The Calendar in the Deepvue Trading Journal shows how often your days clear that line.
How much can a day trader make with $100?
A day trader with $100 can make a few dollars a day at most, since risking 1% means $1 a trade. FINRA’s new rules replace the $25,000 pattern day trader minimum, but trading on margin still requires $2,000 in equity. Deepvue can show results as percentages, so a small record still counts.
What is the best stock to put $1000 in right now?
The best stock to put $1000 in right now depends on your plan, timeframe and risk, so no one can responsibly name it for you. A better test is which stocks meet your criteria. Deepvue’s screener finds names that fit your best playbook, and the Position Size Calculator sizes the trade.
Does the Deepvue Trading Journal do post-trade analysis automatically?
The Deepvue Trading Journal automates the math of post-trade analysis. It syncs your fills, works out R, heat, expectancy and win rate, and breaks results out by playbook, tag, emotion, symbol and day. The judgment stays with you, and the Journal Agent gives a second read whenever you ask.
Sources
- •Ellis, S. and Davidi, I. (2005). After-Event Reviews: Drawing Lessons From Successful and Failed Experience. Journal of Applied Psychology, 90(5).
- •Tannenbaum, S. I. and Cerasoli, C. P. (2013). Do Team and Individual Debriefs Enhance Performance? A Meta-Analysis. Human Factors, 55(1).
- •Keith, N. and Frese, M. (2008). Effectiveness of Error Management Training: A Meta-Analysis. Journal of Applied Psychology, 93(1).
- •Burke, L. E., Wang, J. and Sevick, M. A. (2011). Self-Monitoring in Weight Loss: A Systematic Review of the Literature. Journal of the American Dietetic Association, 111(1).
- •Klein, K. and Boals, A. (2001). Expressive Writing Can Increase Working Memory Capacity. Journal of Experimental Psychology: General, 130(3).
- •Baron, J. and Hershey, J. C. (1988). Outcome Bias in Decision Evaluation. Journal of Personality and Social Psychology, 54(4).
- •Fischhoff, B. (1975). Hindsight ≠ Foresight: The Effect of Outcome Knowledge on Judgment Under Uncertainty. Journal of Experimental Psychology: Human Perception and Performance, 1(3).
- •Chague, F., De-Losso, R. and Giovannetti, B. (2019). Day Trading for a Living? Working paper, SSRN.
- •Barber, B. M., Lee, Y. T., Liu, Y. J. and Odean, T. (2014). The Cross-Section of Speculator Skill: Evidence From Day Trading. Journal of Financial Markets, 18.
- •FINRA (2026). Regulatory Notice 26-10: FINRA Adopts New Intraday Margin Standards to Replace the Day Trading Margin Requirements.
- •Investor.gov, U.S. Securities and Exchange Commission (2024). New T+1 Settlement Cycle: What Investors Need to Know. Investor Bulletin.
- •Gandel, S. (2015). How One Trader Made $2.4 Million in 28 Minutes. Fortune.