Find Stocks Like Mike Webster: Read the Market Through Its Strongest Stocks
Last Updated:
September 29, 2026


Mike Webster screens are five Deepvue screener presets built by Mike Webster, the IBD Senior Market Strategist and former William O’Neil + Company portfolio manager known as “Webby.” Down Days Tell, Cross Fire, Hard Tape, Recession Proof and the Swing Trading List each surface a different kind of relative strength, so you can see which stocks are separating from the market.
This guide covers who Mike Webster is, how to open his presets in the Deepvue Screener, what every screen looks for, and how to combine all five into one daily routine for finding leading growth stocks.
Mike Webster Screens at a Glance
| Preset | What it finds | Best time to run it |
|---|---|---|
| Down Days Tell | Growth stocks holding support and closing strong while the market falls | Market pullbacks and down days |
| Cross Fire | Leaders accelerating on price and volume near 52-week highs | Strong market days |
| Hard Tape | Persistent relative strength with strong daily and weekly closes | Any day, to build a leadership watchlist |
| Recession Proof | Durable sales and earnings growth plus resilient charts | Economic or market uncertainty |
| Swing Trading List | Momentum names with the structure and dollar volume for swing trades | Setups lasting days to weeks |
Who Is Mike Webster?
Mike Webster is a professional growth-stock trader, veteran portfolio manager, and Senior Market Strategist at Investor’s Business Daily. Known throughout the trading community as “Webby,” he joined William O’Neil + Company as a data research analyst in 1997 and became a portfolio manager in 2000 after successfully managing his personal account with the CANSLIM® system.
Webster worked alongside IBD founder William O’Neil for nearly two decades and helped develop several widely used tools, including the Growth 250, MarketSurge Pattern Recognition, the Composite Rating, and the three- and six-month Relative Strength Ratings.
Never miss a Deepvue blog post.
That experience shaped a trading approach centered on studying how stocks behave under different market conditions. Webster uses closing ranges, relative strength, and price to identify stocks separating from the market – especially those holding firm when the indexes are under pressure. (For the indicators he uses on charts, see Mike Webster’s three must-know indicators.)
His five Deepvue presets turn that philosophy into a practical research process by highlighting resilient stocks, accelerating leaders, persistent strength, durable growth, and shorter-term swing-trading opportunities.
What Mike Webster Learned From William O’Neil
Webster’s screens make more sense once you know where he learned to read the market. He joined William O’Neil + Company as a data research analyst in 1997 and earned a portfolio manager seat in 2000 by trading his own account with O’Neil’s CANSLIM® system. He then spent nearly two decades working alongside O’Neil himself.
The biggest lesson he carried forward is to read the market instead of forecasting it. As Webster puts it:
“Remember what Bill taught us! Our job is NOT to predict what the market is going to do! Our job is to interpret what the market is actually doing RIGHT NOW!”
Mike Webster
That idea runs through every preset. O’Neil’s research showed that the biggest winners were relative strength stocks long before their largest gains, often with RS Ratings above 80. Webster helped build the Composite Rating and the 3- and 6-month RS Ratings at O’Neil, and those same measures are the backbone of his Deepvue screens: RS above 80 in Cross Fire and Recession Proof, above 70 in Hard Tape, and strong closes on weak days in Down Days Tell.
How to Find Mike Webster’s Screener Presets in Deepvue
Accessing Mike Webster’s screeners in Deepvue takes only a few steps:
- Open the Deepvue Screener.
- Click Screener Presets.
- Type “Mike Webster” into the preset search bar.
- Open the Mike Webster folder when it appears.
- Select one of his five presets: Down Days Tell, Cross Fire, Hard Tape, Recession Proof, or Swing Trading List.
- Review the charts and add the strongest names to a focused watchlist.
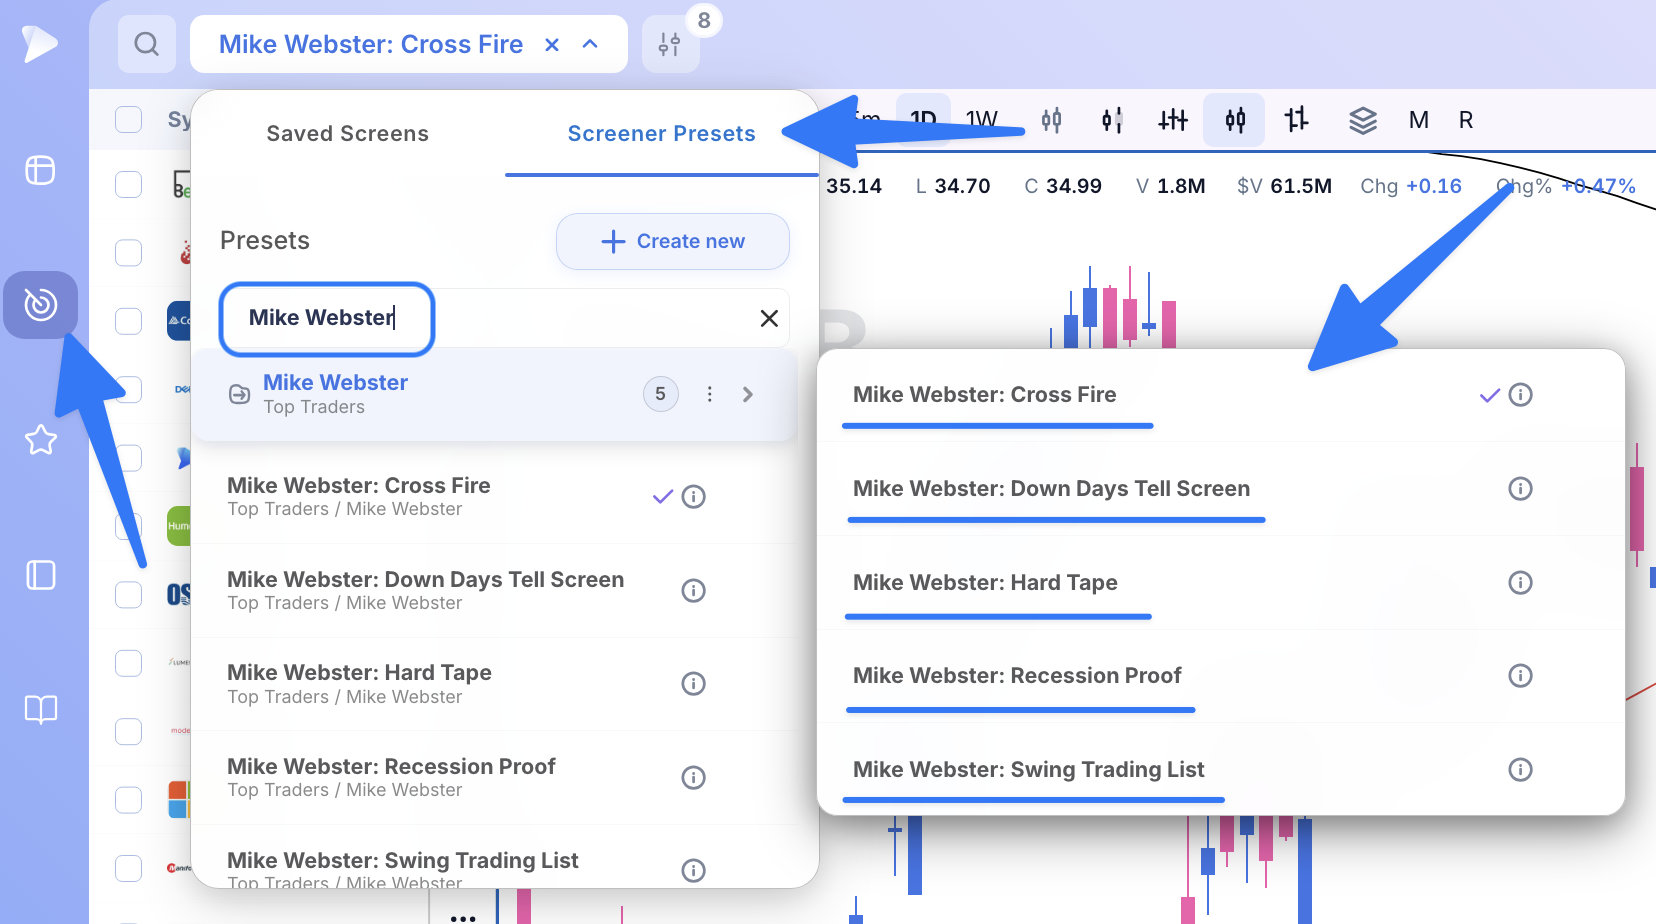
Deepvue lets you run professional presets directly or duplicate and customize them. Results flow straight into charts, watchlists and alerts. These screens are starting points, not automatic buy signals – every stock still needs individual chart review, market context, an entry plan, and a clear level for managing risk.
💡 Pro Tip: Want to test these screens yourself? Start a Deepvue trial and the Mike Webster presets are ready to run from the first login.
The 5 Mike Webster Screens Explained
Down Days Tell Screen: Stocks Holding Up When the Market Falls
Weak market sessions can reveal which stocks are showing genuine leadership. While most stocks decline with the indexes, the Down Days Tell screen looks for growth stocks that hold support, outperform the market, and close strongly within their daily ranges.
Below is a chart of NVAX compared to QQQ in 2020, from a time when it appeared on Mike Webster’s Down Days Tell screen. It’s a clear example of what the screen looks for: while the market pulls back, even for a few days, NVAX keeps closing near the top of its daily range and shows extreme relative strength.
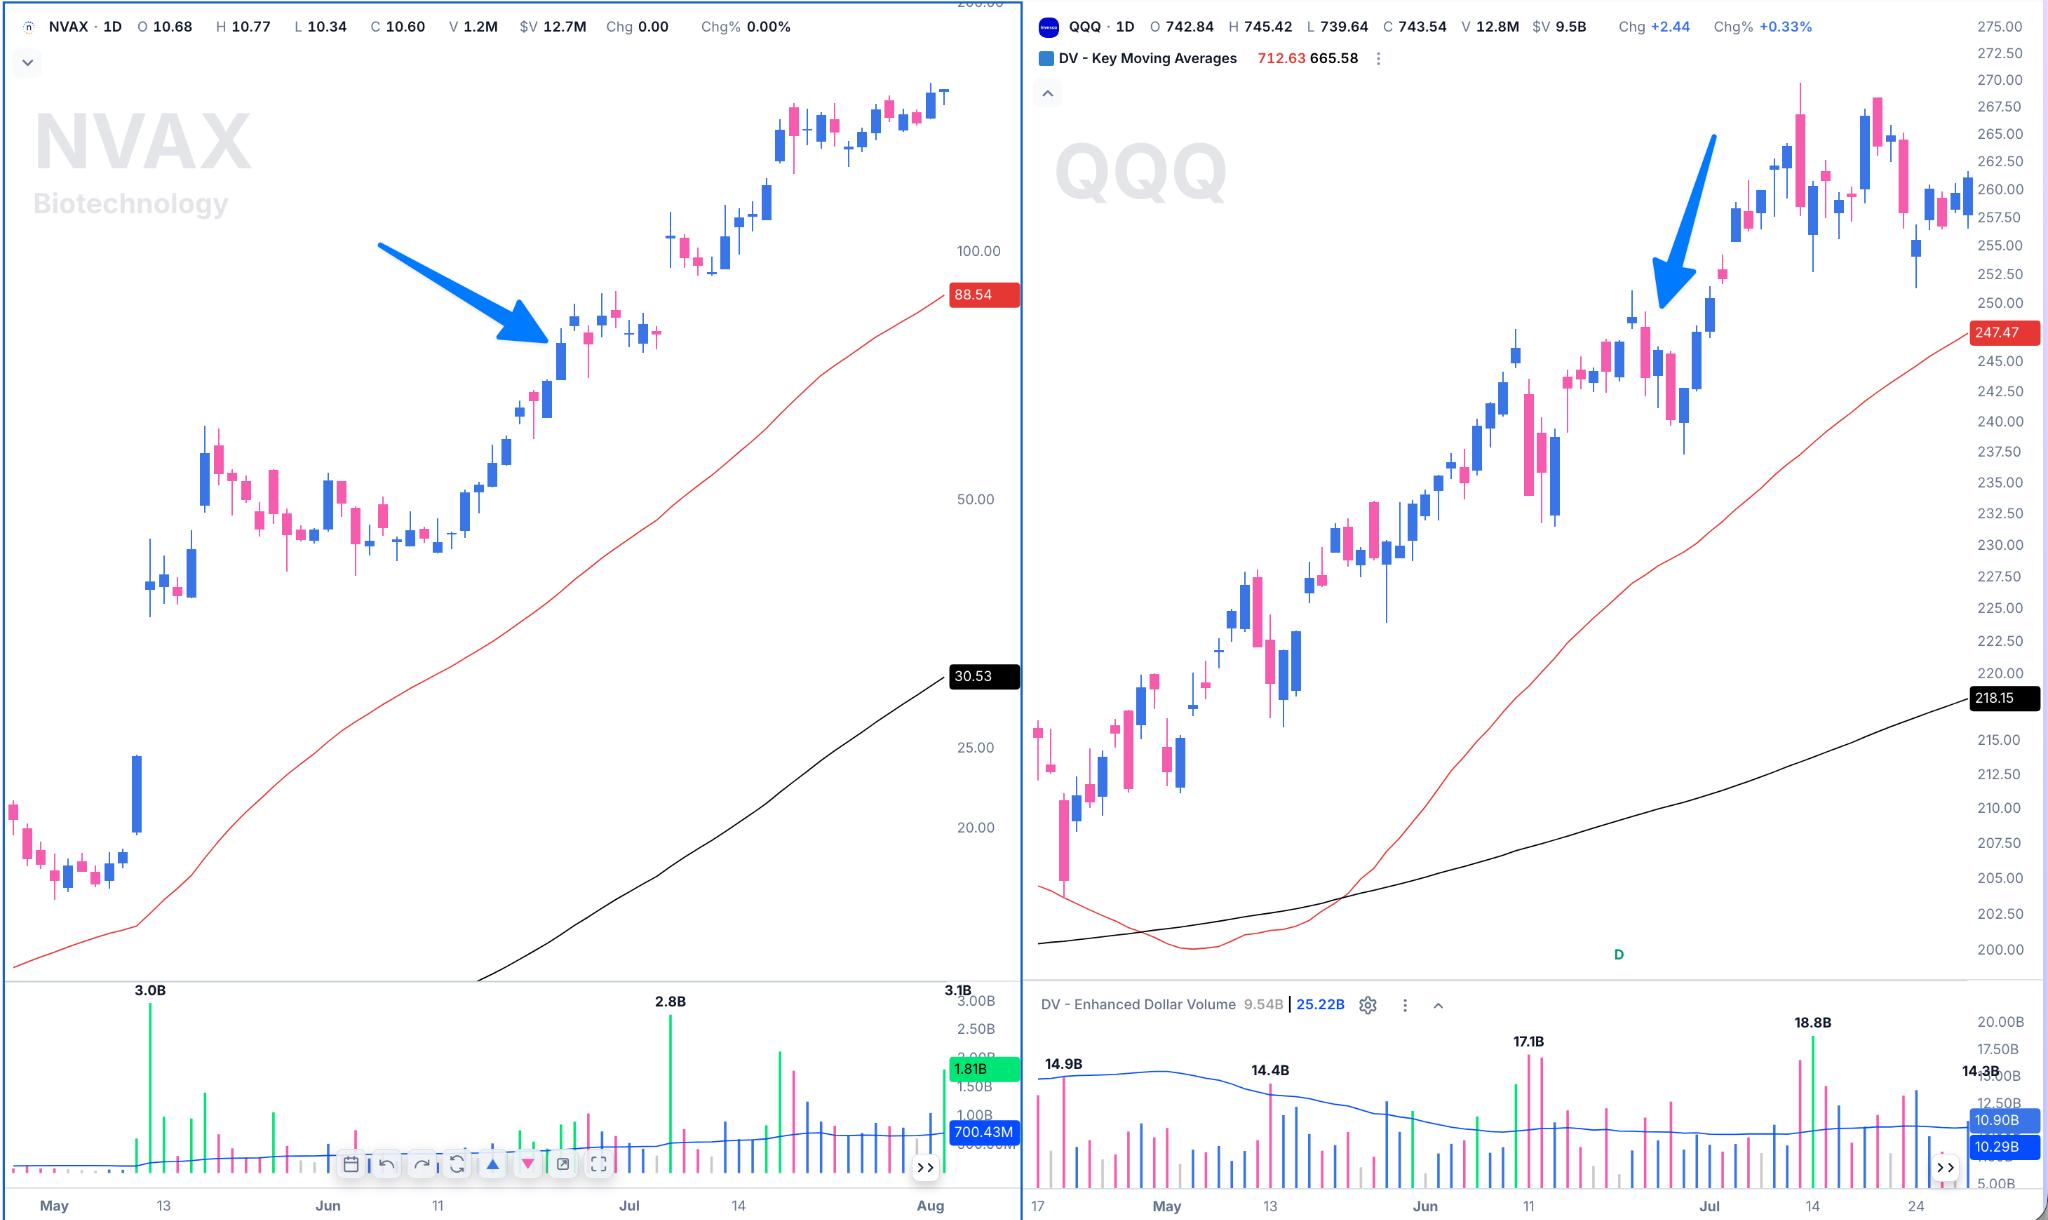
This resilience may suggest that demand remains beneath the surface. The best candidates are not simply strong for one day – they repeatedly avoid technical damage and remain well-positioned as the market begins to stabilize. It pairs well with our guide to finding strong stocks when the market is down.
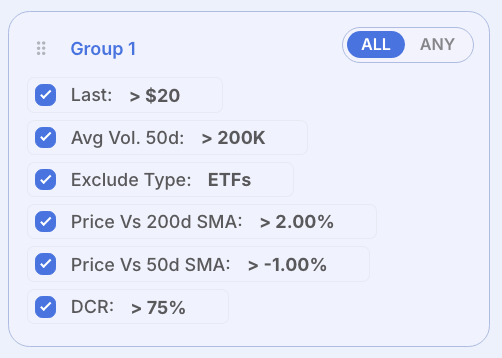
Screen criteria: price above $20, 50-day average volume above 200K shares, ETFs excluded, price more than 2% above the 200-day SMA and no more than 1% below the 50-day SMA, and a daily closing range (DCR) above 75%.
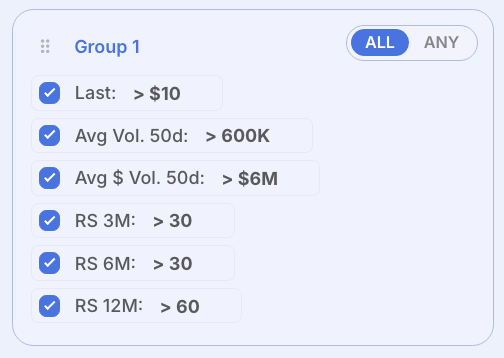
Screen criteria: price above $10, 50-day average volume above 600K shares, 50-day average dollar volume above $6M, RS 3M and RS 6M above 30, and RS 12M above 60.
When reviewing results, look for:
- Support holding while the market or industry group weakens.
- A strong close in the upper portion of the daily range.
- An improving relative strength line with limited technical damage.
Cross Fire Screen: Leaders Accelerating Near 52-Week Highs
The Cross Fire screen finds leaders accelerating when buyers take control. It looks for stocks making meaningful gains, closing near their session highs, trading close to their 52-week highs, and holding decisively above short-term support.
The goal is to identify stocks doing more than rising with the market. The best candidates show clear demand while remaining close enough to a pivot, moving average, or support level to provide a practical entry without chasing. For more real-time breakout scans, see how to find stocks breaking out today.
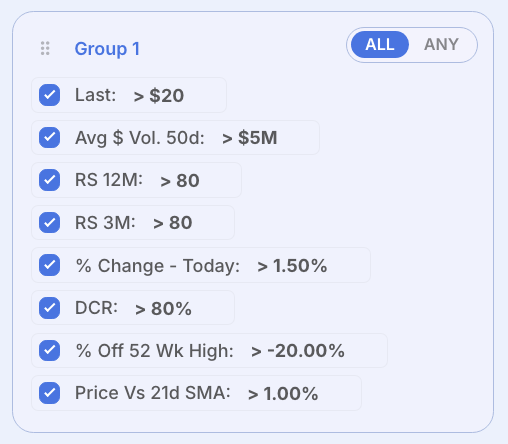
Screen criteria: price above $20, 50-day average dollar volume above $5M, RS 12M and RS 3M both above 80, up more than 1.5% today, DCR above 80%, within 20% of the 52-week high, and more than 1% above the 21-day SMA.
When reviewing results, look for:
- Strong price action supported by elevated volume.
- A close near the session high with price near its 52-week high.
- A nearby pivot or support level that keeps risk manageable.
Hard Tape Screen: Persistent Relative Strength
A “hard tape” stock behaves as though sellers cannot keep it down for long. The Hard Tape screen finds stocks displaying persistent relative strength, strong daily and weekly closes, and price action near their highs.
This screen is especially useful for building a leadership watchlist. Some results may be too extended to buy immediately, but they can become actionable after forming a tight consolidation, controlled pullback, or new base. Learn more about finding winning stocks with relative strength.
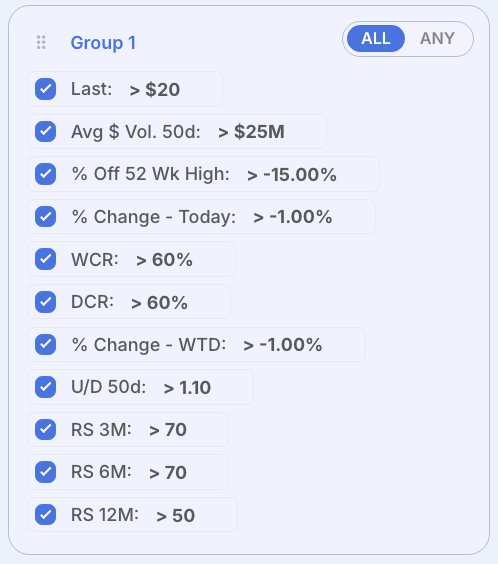
Screen criteria: price above $20, 50-day average dollar volume above $25M, within 15% of the 52-week high, down no more than 1% today and week-to-date, weekly and daily closing ranges above 60%, 50-day up/down volume ratio above 1.1, RS 3M and RS 6M above 70, and RS 12M above 50.
When reviewing results, look for:
- Persistent relative strength across daily and weekly time frames.
- Tight price action near the highs with constructive volume.
- A controlled base or pullback close enough to support.
Recession Proof Screen: Durable Growth Under Pressure
No stock is literally recession-proof. Webster’s Recession Proof screen looks for companies combining durable fundamental growth with relative strength during periods of economic or market uncertainty.
The screen helps traders focus on businesses whose sales, earnings, and charts remain firm while conditions become more selective. Treat the results as a resilience watchlist, not a guarantee, and require price action to keep confirming the story. Our breakdown of why sales growth reveals tomorrow’s winners explains the fundamental side.
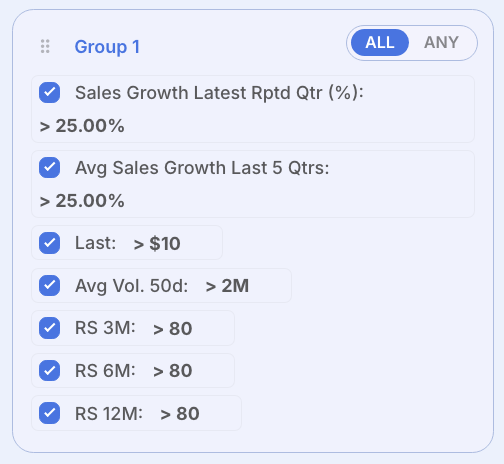
Screen criteria: sales growth above 25% in the latest reported quarter and averaging above 25% over the last five quarters, price above $10, 50-day average volume above 2M shares, and RS 3M, 6M and 12M all above 80.
When reviewing results, look for:
- Consistent sales and earnings growth.
- Relative strength during broad market or economic pressure.
- A healthy long-term chart holding above important support.
Swing Trading List: Setups for Days-to-Weeks Trades
The Swing Trading List is designed to find higher-tempo opportunities that may develop over several days or weeks. It surfaces stocks with the momentum, price action, and dollar volume needed for shorter-term swing trades.
The best candidates combine strength with structure, such as a clean base, breakout, tight area, or controlled pullback. The screen creates the starting list, but the chart must still provide a clear entry, stop level, and acceptable reward-to-risk profile – the position size calculator turns that stop into a share count.
When reviewing results, look for:
- A clean breakout, tight area, or controlled pullback.
- Strong relative strength supported by constructive volume.
- A defined entry and stop with enough upside to justify the risk.
How to Use Mike Webster’s Presets Together
Mike Webster’s Deepvue presets work best as one connected research process rather than five separate lists. Each preset highlights a different form of strength – resilience during weak markets, acceleration on strong days, persistent leadership, durable growth, or a timely swing-trading setup.
The goal is to narrow a large universe of stocks into a focused watchlist, then use chart review to decide whether a real opportunity exists. The strongest candidates may appear in multiple presets or keep showing up over several sessions.
- Down Days Tell: Use this during market pullbacks to find stocks holding support and outperforming the indexes.
- Cross Fire: Check this on strong market days for leaders accelerating on price and volume.
- Hard Tape: Use this to track stocks displaying persistent relative strength and strong closes near their highs.
- Recession Proof: Review this during economic uncertainty for companies combining durable growth with resilient charts.
- Swing Trading List: Use this to find shorter-term setups offering momentum, structure, and a clear risk level.
A stock appearing in multiple presets deserves added attention. For example, a Down Days Tell stock that later triggers Cross Fire may be shifting from quiet resilience into active demand. Likewise, a Hard Tape stock appearing on the Swing Trading List may be forming a timely setup after demonstrating persistent strength. Deepvue’s combo lists make that overlap easy to spot.
The presets identify where leadership may be developing. Your chart review determines whether the stock is actionable, where the entry belongs, and where the setup would be invalidated.
Key Lessons From Mike Webster’s Trading Strategy
Mike Webster’s approach shows how studying stock behavior across different market conditions can help traders uncover leadership early. His process centers on relative strength, price, market context, and disciplined risk management.
- Study weakness for clues – Stocks that hold support and close well during market declines may be showing demand before the next advance becomes obvious.
- Look for true separation – Focus on stocks outperforming the market, closing near their highs, and pulling away from the competition.
- Track persistent strength – One strong session can attract attention, but repeated relative strength across daily and weekly charts is stronger evidence of leadership.
- Balance strength with timing – A powerful stock can still be too extended. Wait for a breakout, tight area, or controlled pullback that offers a logical entry.
- Let the screens do the heavy lifting – Use Webster’s presets to find resilient stocks, accelerating leaders, durable growth, and timely swing setups.
- Keep risk defined – Every trade needs a clear level that tells you the setup is no longer working. Protecting capital keeps you ready for the next opportunity.
Leadership often reveals itself before the broader market improves. Watch how stocks behave under pressure, focus on the names that consistently separate from the pack, and wait for a setup that lets you act with confidence and control risk.
More Screens From Top Traders
Want to compare approaches? Deepvue has presets from other professional traders too:
- Qullamaggie screens – momentum breakouts, episodic pivots and continuation bases.
- Pradeep Bonde screens – momentum bursts and 4% movers on volume.
- Matt Caruso screens – how an investing champion finds leaders.
- Oliver Kell screens – the Cycle of Price Action in five presets.
- All Deepvue screener presets – the full library, organized by trader and strategy.
Ready to find leaders like Webby? Try Deepvue and run all five Mike Webster screens on today’s market.
This article is for educational purposes only and is not financial advice.
Frequently asked questions
CAN SLIM® is a registered trademark of O’Neil Capital Management, Inc. (U.S. Reg. No. 3,081,940). Deepvue is not affiliated with, sponsored by, endorsed by, or licensed by O’Neil Capital Management, Inc., Investor’s Business Daily, MarketSurge, or their affiliates. Any reference to CAN SLIM® is for descriptive purposes only. Deepvue’s scores, ratings, and screeners are independently calculated by Deepvue and are not the proprietary ratings of MarketSurge or IBD.