Find Stocks Like Jesse Livermore: Follow the Leaders
Last Updated:
October 29, 2026


Jesse Livermore screens are three Deepvue screener presets inspired by the trader behind Reminiscences of a Stock Operator. Pivotal Breakout, Follow the Leaders and Livermore Levels each turn part of his philosophy into a modern search: strength with activity, leadership across time frames, and strong stocks around round-number prices.
This guide covers who Jesse Livermore was, how to open his presets in the Deepvue Screener, the exact rules behind each screen, and how to use them together to go from screen result to trade setup.
Jesse Livermore Screens at a Glance
| Preset | What it finds | Key rules |
|---|---|---|
| Pivotal Breakout | Strong stocks near their highs showing elevated activity | Within 5% of 52-week high, Projected Volume above 1.5, AS 3M and 12M above 80 |
| Follow the Leaders | Liquid leaders outperforming across time frames | $50M+ dollar volume, RS 3M and 12M above 90, within 5% of 52-week high |
| Livermore Levels | Strong stocks around selected round-number prices | Price inside a round-number band, plus any one Absolute Strength condition |
Who Is Jesse Livermore?
Before Jesse Livermore became known as the “Boy Plunger” and the “Great Bear of Wall Street,” he was a teenager writing stock quotations on a board in a Boston brokerage office. He studied the changing prices, kept records, and began speculating in bucket shops – businesses where customers wagered on price movements without actually owning shares. Those early experiences helped launch a career that included major short-selling campaigns during the panics of 1907 and 1929, along with repeated fortunes made and lost.
Livermore’s career inspired Edwin Lefèvre’s Reminiscences of a Stock Operator, published in 1923. The book follows the fictionalized trader Larry Livingston; it is not an autobiography written by Livermore. His own How to Trade in Stocks, published in 1940, explains his approach to timing, pivotal points, market leadership, and protecting capital. Across those lessons, a consistent idea emerges: study the stocks leading the market, wait for their action to confirm the opportunity, and recognize when that evidence changes.
Never miss a Deepvue blog post.
“Just as I would avoid the weak industries and the weak stocks, so I would favor the strongest industries and the strongest stocks.”
Jesse Livermore
Deepvue’s three Livermore-inspired presets turn parts of that philosophy into a modern research process. Pivotal Breakout highlights strength accompanied by trading activity, Follow the Leaders finds liquid stocks outperforming near their highs, and Livermore Levels identifies strong stocks around selected round-number prices. These are modern screening tools inspired by his work, not historical formulas he used.
How to Find Jesse Livermore’s Deepvue Presets
Accessing the Livermore screeners in Deepvue takes only a few steps:
- Open the Deepvue Screener.
- Click Screener Presets.
- Type “Jesse Livermore” into the preset search bar.
- Open the Jesse Livermore folder when it appears.
- Select one of the three presets: Livermore: Pivotal Breakout, Livermore: Follow the Leaders, or Livermore Levels.
- Review the charts and add the strongest names to a focused watchlist.
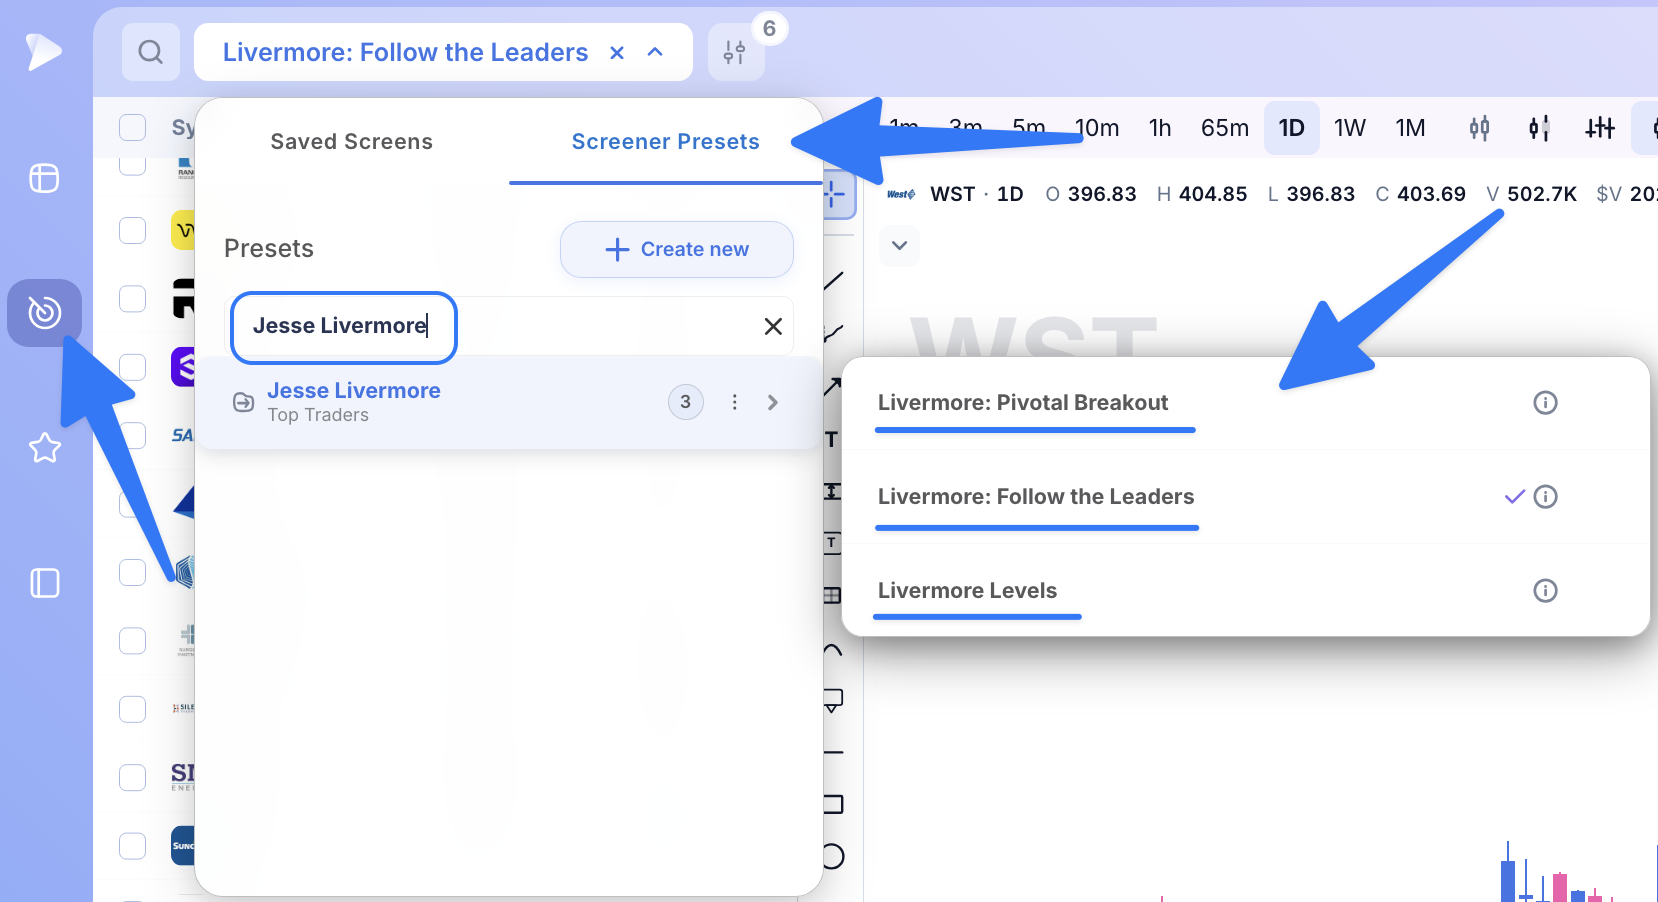
Deepvue allows traders to run the presets directly or duplicate and customize them for liquidity, fundamentals, or risk. The results can also flow into charts, watchlists, and alerts. These screens are starting points, not automatic buy signals. Every stock still needs individual chart review, market context, an entry plan, and a clear level for managing risk.
💡 Pro Tip: Want to run these screens on today’s market? Start a Deepvue trial and the Jesse Livermore presets are ready from your first login.
The 3 Jesse Livermore Screens Explained
Pivotal Breakout Screen: Strength With Activity
Livermore studied pivotal points – important price areas where a stock’s behavior could help confirm that a meaningful move was beginning or resuming. He wanted the market to support his judgment before committing, rather than buying simply because he believed a stock should rise.
The Pivotal Breakout preset applies that confirmation-first idea through modern filters. It searches for stocks near their highs, above important moving averages, and showing strength alongside elevated projected volume. The screen highlights candidates displaying activity, but the chart still determines whether price is actually clearing a meaningful pivot.
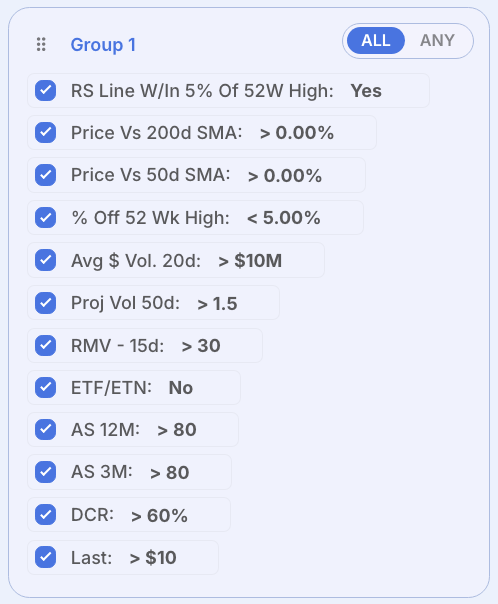
The preset uses these rules:
- Relative strength line within 5% of its own 52-week high.
- Price above the 200-day simple moving average.
- Price above the 50-day simple moving average.
- Price less than 5% below its 52-week high.
- 20-day average dollar volume greater than $10 million.
- Projected Volume (50-day) greater than 1.5.
- 15-day Relative Measured Volatility greater than 30.
- ETFs and ETNs excluded.
- 12-month Absolute Strength rating greater than 80.
- Three-month Absolute Strength rating greater than 80.
- Daily Closing Range greater than 60%.
- Last price greater than $10.
When reviewing results, look for:
- A recognizable pivot rather than price moving through an arbitrary area.
- Strong relative performance and increased volume as price challenges resistance.
- Follow-through above the pivot, with a nearby invalidation level if the move fails.
Follow the Leaders Screen: Liquid Stocks Outperforming Near Their Highs
Livermore did not believe traders needed to follow every stock. In How to Trade in Stocks, he emphasized concentrating on the prominent, active issues and recognizing that leadership changes. Yesterday’s strongest group does not automatically remain tomorrow’s best opportunity.
The Follow the Leaders preset puts that selection process first. It searches for liquid individual stocks trading near their 52-week highs, with strong Relative Strength ratings over both three and 12 months. The combination helps identify stocks showing leadership across more than one time frame, rather than names attracting attention for a single session.
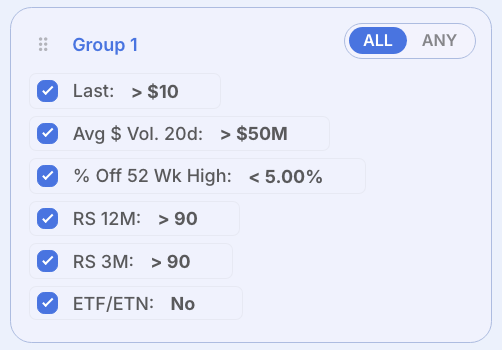
The preset uses these rules:
- Last price greater than $10.
- 20-day average dollar volume greater than $50 million.
- Price less than 5% below its 52-week high.
- 12-month Relative Strength rating greater than 90.
- Three-month Relative Strength rating greater than 90.
- ETFs and ETNs excluded.
When reviewing results, look for:
- Persistent outperformance across the daily and weekly charts – see using multiple timeframes.
- A constructive pause near the highs rather than an extended move far from support.
- A clear pivot and volume behavior that help distinguish an emerging setup from a watchlist candidate.
Livermore Levels Screen: Strong Stocks Around Round Numbers
Livermore paid attention to how stocks behaved around significant price milestones. In How to Trade in Stocks, he discussed movements through levels such as $100, $200, and $300. The important observation was not the number alone, but whether the stock showed convincing movement after passing it.
Livermore Levels builds a modern watchlist around selected round-number areas. A stock must meet the liquidity requirement, fall inside at least one price band, and satisfy at least one Absolute Strength condition. It does not have to meet every price range or all three strength thresholds – the same ALL/ANY group logic you can use in your own screens.
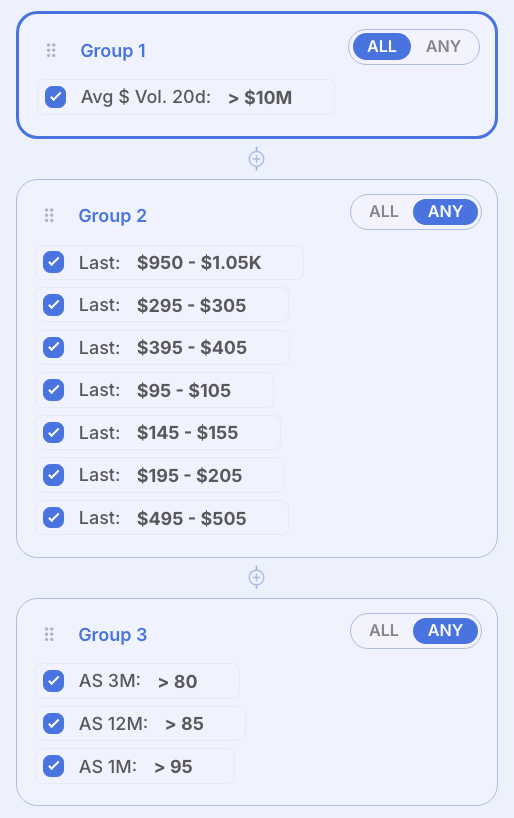
The preset requires:
- 20-day average dollar volume greater than $10 million.
Price must fall within at least one of these ranges:
- $95 to $105.
- $145 to $155.
- $195 to $205.
- $295 to $305.
- $395 to $405.
- $495 to $505.
- $950 to $1,050.
The stock must also meet at least one of these conditions:
- Three-month Absolute Strength rating greater than 80.
- 12-month Absolute Strength rating greater than 85.
- One-month Absolute Strength rating greater than 95.
These bands identify areas to study, not automatic breakout signals. A result may be approaching a round number, trading above it, or slipping back below it. Chart review determines whether that level also aligns with meaningful resistance, support, or a developing pivot.
When reviewing results, look for:
- A round-number level that matters on the chart, rather than proximity alone.
- Constructive price action and demand as the stock approaches or clears the level.
- Follow-through that holds the breakout area, with a clear exit plan if price reverses.
From Screen Result to Trade Setup
A leadership screen answers one question: which stocks deserve attention? It does not answer whether today’s price offers a sensible entry. A stock can meet every requirement in Follow the Leaders and still be too extended, too loose, or too far from a useful risk level.
Use the chart to separate leadership from timing. Study the prior advance, how the stock handles pullbacks, and whether a pause is creating a clear area of resistance. Then watch for demand as price approaches that area. The purpose is to follow demonstrated strength without assuming that strength makes every entry attractive.
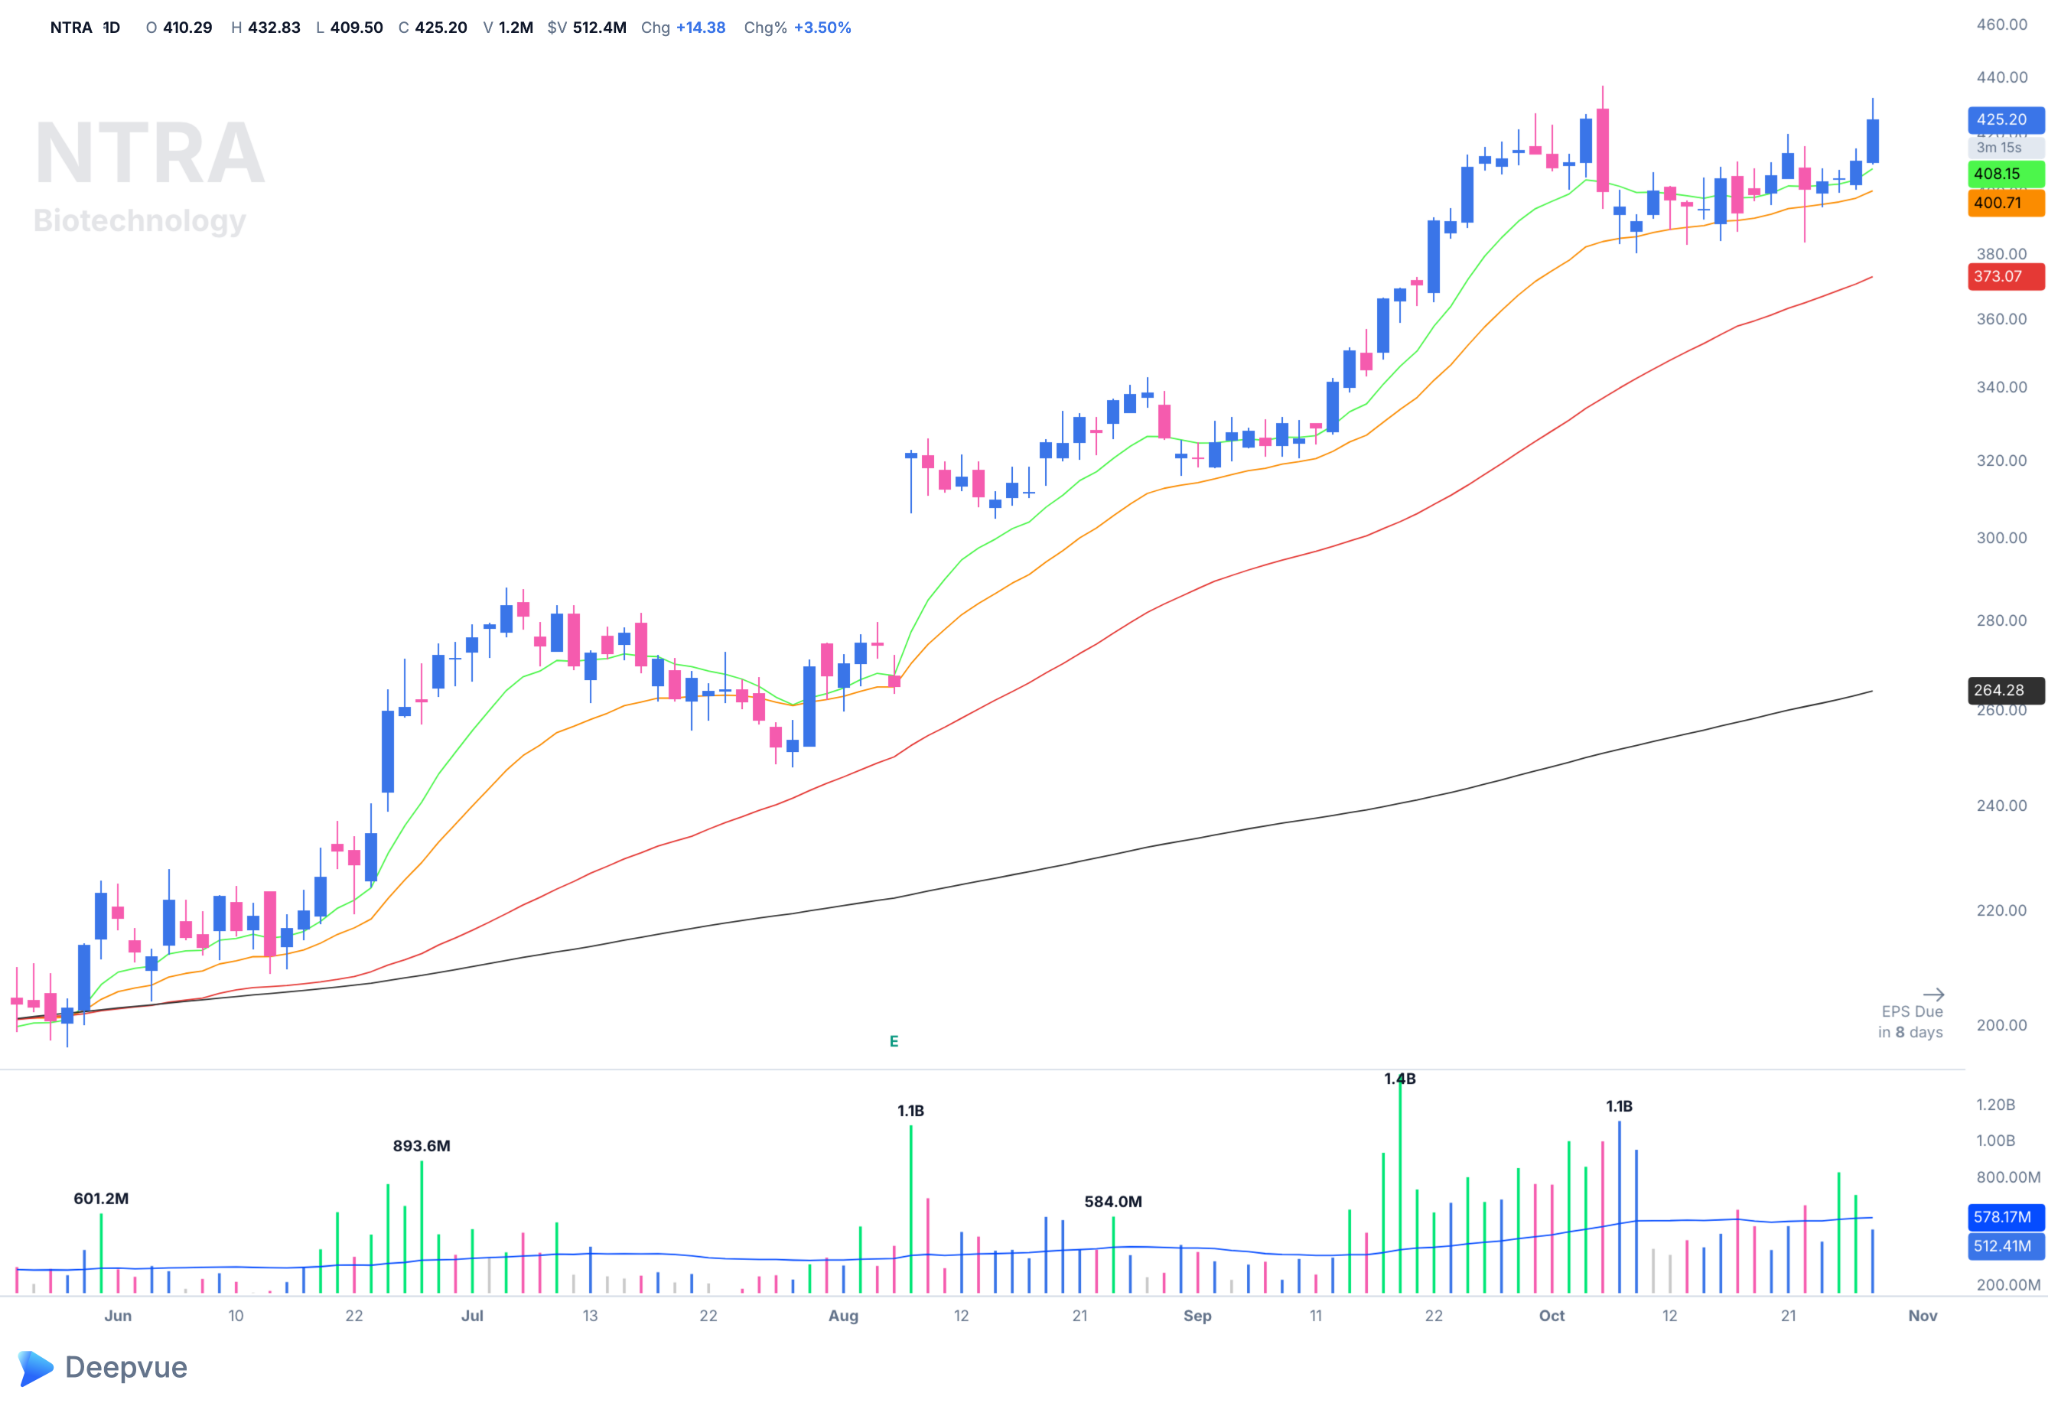
Above is a chart of NTRA, a strong stock in a strong biotechnology group and an example of the names the Follow the Leaders screen is designed to find. The idea is simple: focus on stocks already demonstrating leadership within leading groups, rather than waiting for weaker names to catch up.
When reviewing results, look for:
- A strong prior move followed by an orderly pause or controlled pullback.
- Relative strength remains firm while the stock builds its setup.
- A practical entry near a pivot, with a defined risk level rather than a need to chase – then size the trade with the position size calculator.
How to Use the Presets Together
The three Livermore-inspired presets work best as one connected research process. Follow the Leaders helps establish what is strong, Livermore Levels highlights selected price areas worth monitoring, and Pivotal Breakout focuses attention on strength accompanied by activity. They serve different purposes, but every result still needs chart review.
- Pivotal Breakout: Use this to find strong stocks near their highs showing elevated projected volume and firm price action.
- Follow the Leaders: Use this to build a watchlist of liquid stocks demonstrating sustained relative strength.
- Livermore Levels: Use this to monitor strong stocks around selected round-number prices and evaluate how they behave there.
Overlap can make a candidate more interesting without making it automatically actionable. A Follow the Leaders stock that also appears on Livermore Levels may be consolidating near a significant round number. A leadership candidate that later appears on Pivotal Breakout may be showing increased activity as it challenges resistance. Deepvue’s combo lists make that overlap easy to spot. In either case, inspect what changed on the chart rather than treating an additional screen appearance as confirmation by itself.
Livermore also warned against assuming every group would turn at the same time. Compare the behavior of several leaders and their groups instead of letting one successful breakout – or one failure – define the entire market. The presets show where strength may be developing. Chart review determines the entry, the invalidation level, and whether the risk is acceptable.
Key Takeaways From Jesse Livermore’s Strategy
Jesse Livermore’s approach connected leadership, timing, and the discipline to wait for evidence. His legacy includes both important trading lessons and repeated financial setbacks – a reminder that knowing sound principles and consistently following them are different challenges.
“In the long run, patience counts more than any other element except knowledge. The two really go hand in hand.”
Jesse Livermore
Here are the biggest takeaways from his trading strategy:
- Start with demonstrated leadership. Focus on stocks and groups already showing strength rather than assuming weaker names must eventually catch up.
- Separate selection from timing. A liquid leader belongs on a watchlist, but it still needs a setup offering a practical entry.
- Use each screen for a different purpose. Follow the Leaders identifies strength, Livermore Levels highlights price milestones, and Pivotal Breakout looks for strength accompanied by activity.
- Wait for the market to confirm. A promising idea becomes more useful when price and volume support it near a meaningful pivot.
- Stay flexible as leadership changes. Keep evaluating the current leaders rather than remaining attached to stocks that used to outperform.
- Protect capital when the evidence breaks down. Define the risk before entering, respect failed setups, and avoid adding to a losing position simply to lower the average cost. TraderLion’s risk management guide goes deeper.
The presets find the candidates. The chart determines whether leadership is developing into a usable setup, while position size and risk management determine whether that setup is worth taking.
More Screens From Top Traders
Want to compare approaches? Deepvue has presets from other professional traders too:
- Dan Zanger screens – liquid high beta, high priced leaders and 40/40.
- Leif Soreide screens – high tight flags, low tight flags and rocket bases.
- Mike Webster screens – relative strength on down days and hard tape leaders.
- Qullamaggie screens – momentum breakouts, episodic pivots and continuation bases.
- Oliver Kell screens – the Cycle of Price Action in five presets.
- All Deepvue screener presets – the full library, organized by trader and strategy.
Ready to follow the leaders like Livermore? Try Deepvue and run all three Jesse Livermore screens on today’s market.
This article is for educational purposes only and is not financial advice.