The Volatility Contraction Pattern Screener Built Around a Tightness Indicator
A volatility contraction pattern screener finds stocks whose price range is narrowing inside a base, a sign sellers are being absorbed before a breakout. Tightness isn’t a single number, so ordinary filters miss it. Deepvue measures it with RMV, a proprietary indicator that scores volatility against the stock’s own recent average. One plan, $49 a month.
Key Takeaways
Few traders screen for the VCP pattern properly. A cup and handle has a shape you can describe and a 52 week high is a simple comparison, but contraction is a run of narrowing swings that only means something relative to what came before. So most traders still flip through hundreds of charts every weekend.
Deepvue’s screener measures what every contraction shares instead: volatility collapsing against the stock’s own recent behavior. That’s a number you can filter on, across the whole market.
- ✓RMV scores contraction from 0 to 100, and a reading near zero marks the tightest range in the lookback
- ✓Under 10 is the working threshold for tight in the presets
- ✓Use a 15 bar lookback for standard bases and 5 bars for IPO bases, recent gaps and fast movers
- ✓Presets pair tightness with leadership, so you only see stocks that were already strong
- ✓RMV finds the tight area, and the chart still decides the context
- ✓One plan at $49 a month, a third of MarketSurge’s $149
What Is a Volatility Contraction Pattern?
A volatility contraction pattern (VCP) is a constructive base inside a longer term uptrend. Through the base, price range and volume tighten from left to right: each pullback is shallower than the last, volume dries up, and the stock breaks through the pivot on expanding volume.
Textbook VCP setups form above a rising 200 day moving average, which separates a real base from a stock quietly rolling over.
Why the VCP Pattern Contracts
Each dip inside the base brings out new sellers, and buyers who want the stock absorb them. By the third or fourth contraction few sellers are left at those levels, so the range collapses. You’re watching supply run out in slow motion.
The behavior is older than the label. Mark Minervini coined the term, hence the Minervini VCP, but William O’Neil marked tight closes in cup and handle bases decades earlier. Stan Weinstein’s stage two continuation and Nicolas Darvas boxes describe the same contraction.
Tight Areas: The Actionable Part of a VCP Setup
Every VCP ends in a stretch where the range narrows, closes cluster and volume drops well below its base average. That’s where risk is definable: the stop goes just below a range a few percent wide, and the position size calculator turns it into a share count. A working VCP pattern screener has to find these tight areas first.
Why the VCP Chart Pattern Resists Ordinary Screening
Try writing a VCP as a standard filter set. The stock is in an uptrend, yet the base is a pause in it. It makes three or four shallower pullbacks, though the count and depth vary. Volume falls overall but spikes on advances. And tight is relative: a 5% week is nothing for one name and extreme for another.
No mix of moving averages and fixed thresholds captures that, so fixed filters rarely catch the VCP chart pattern. The fix is to measure the condition under the shape.
WatchWatch how to find and trade VCP setups in Deepvue hereRMV: A VCP Indicator Built for Screening
Relative measured volatility (RMV) is proprietary to Deepvue. It compares a stock’s current volatility with its own average over a lookback period and returns a score from 0 to 100.
| RMV reading | What it means |
|---|---|
| Near 100 | Volatility is expanding relative to recent behavior |
| Mid range | Normal movement for this stock |
| Under 10 | Meaningfully tight, the threshold the presets use |
| 0 | The tightest range in the lookback window |
Because the score is relative, a name that swings 8% a day and one that drifts 1% can both register a real contraction, and one condition catches both.
Choosing the Lookback
Fifteen bars is the standard setting and surfaces the bigger contractions position traders want. Five bars suits IPO bases, recent gaps and names with an average daily range above 4%, and it flags subtler tightness like inside days.
On a weekly chart, a zero reading marks the tightest weekly range in the lookback. On a mature base, that’s about as clean a sign of exhausted supply as the pattern gives.
What RMV Is Not
RMV isn’t ATR renamed. The calculation is Deepvue’s own. It also measures tightness and nothing else: a low reading says the stock went quiet, and your other conditions check that it went quiet in the right place.
Why Deepvue Is the Best Volatility Contraction Pattern Screener
RMV turns tightness into a number. Deepvue wraps leadership, liquidity and fundamentals around it in the same query, which is what makes it a complete VCP screener.
A One Click VCP Scanner
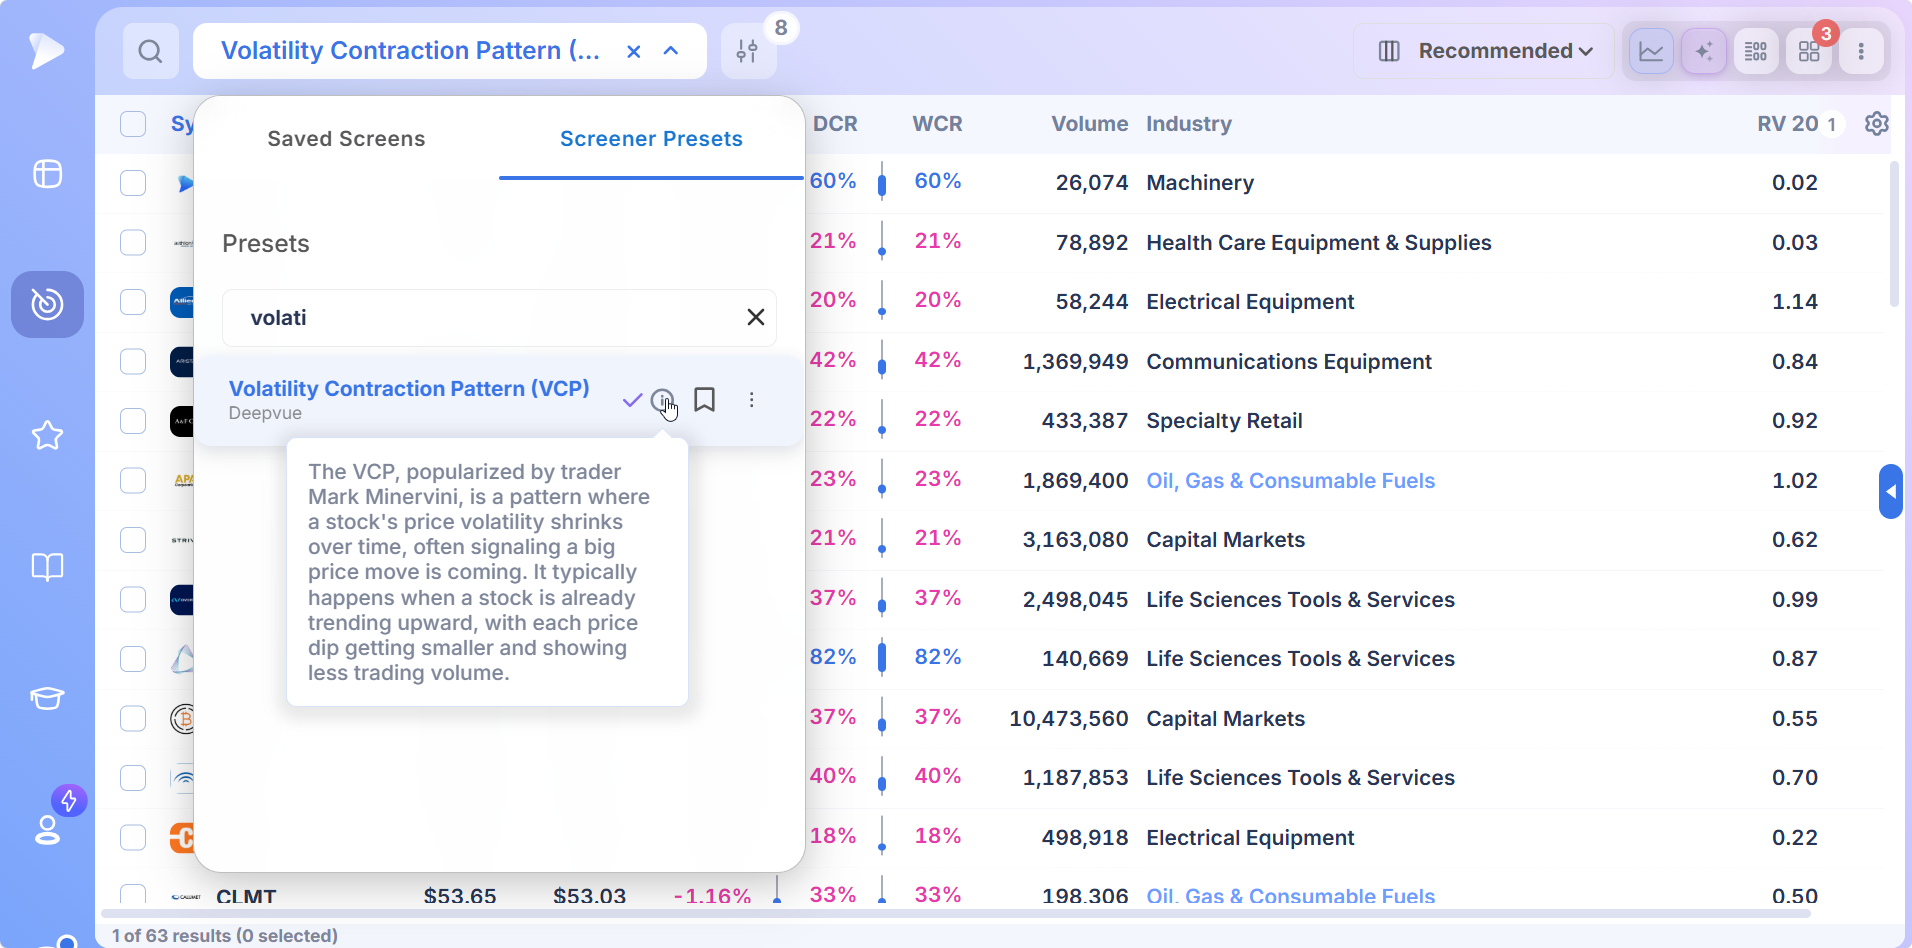
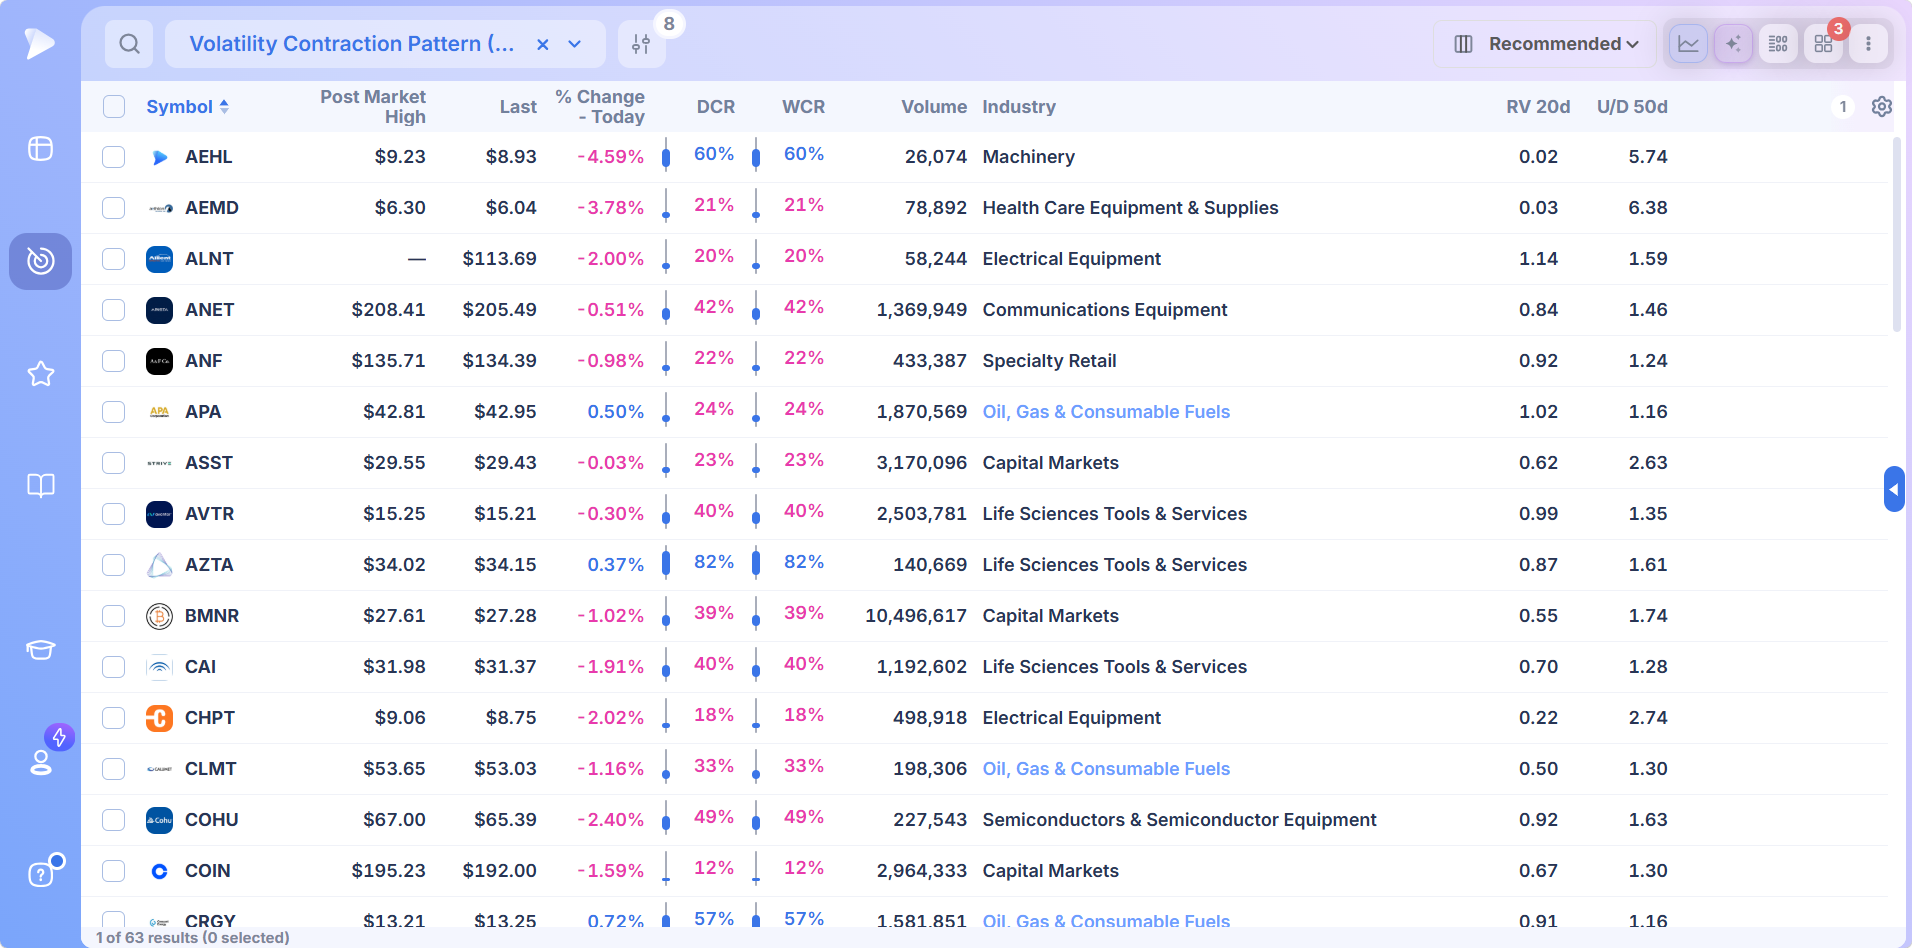
The Volatility Contraction Pattern (VCP) preset loads in one click and returns stocks in a tight range right now. It’s a solid VCP scanner on its own, and you can switch between a results table and a grid of charts to work through bases fast.
Power and Tightening: Tightness Plus Leadership
Tightness alone returns everything that went quiet. The Power and Tightening preset adds leadership, so only names worth a look come back.
| Condition | Why it’s there |
|---|---|
| Relative strength in the top percentile over 1 or 3 months | The stock was leading before it paused |
| RMV under the tightness threshold | It’s contracting now |
| Minimum average daily range | It moves enough to trade |
| Minimum dollar volume | Clears out illiquid names |
| Price above the 50 day moving average and above $5 | Keeps you in healthy, tradable trends |
A stricter preset adds a 200 day moving average condition, higher dollar volume and ADR floors, a cap on how far price traveled over the last five days, and a double inside day.
Make It Your Own VCP Stock Screener
Presets are locked on purpose. Save a copy and it becomes your own screen, ready for the context RMV leaves out:
- •Distance from the 50 day to confirm the stock is basing rather than extended
- •Percent off the 52 week high to keep the contraction inside a base
- •Industry rank to favor leading groups
- •Earnings and sales growth so the business backs up the chart
Tightness and business quality in one query is where a VCP stock screener beats a pattern drawing tool.
The Chart Is Where the Screen Ends
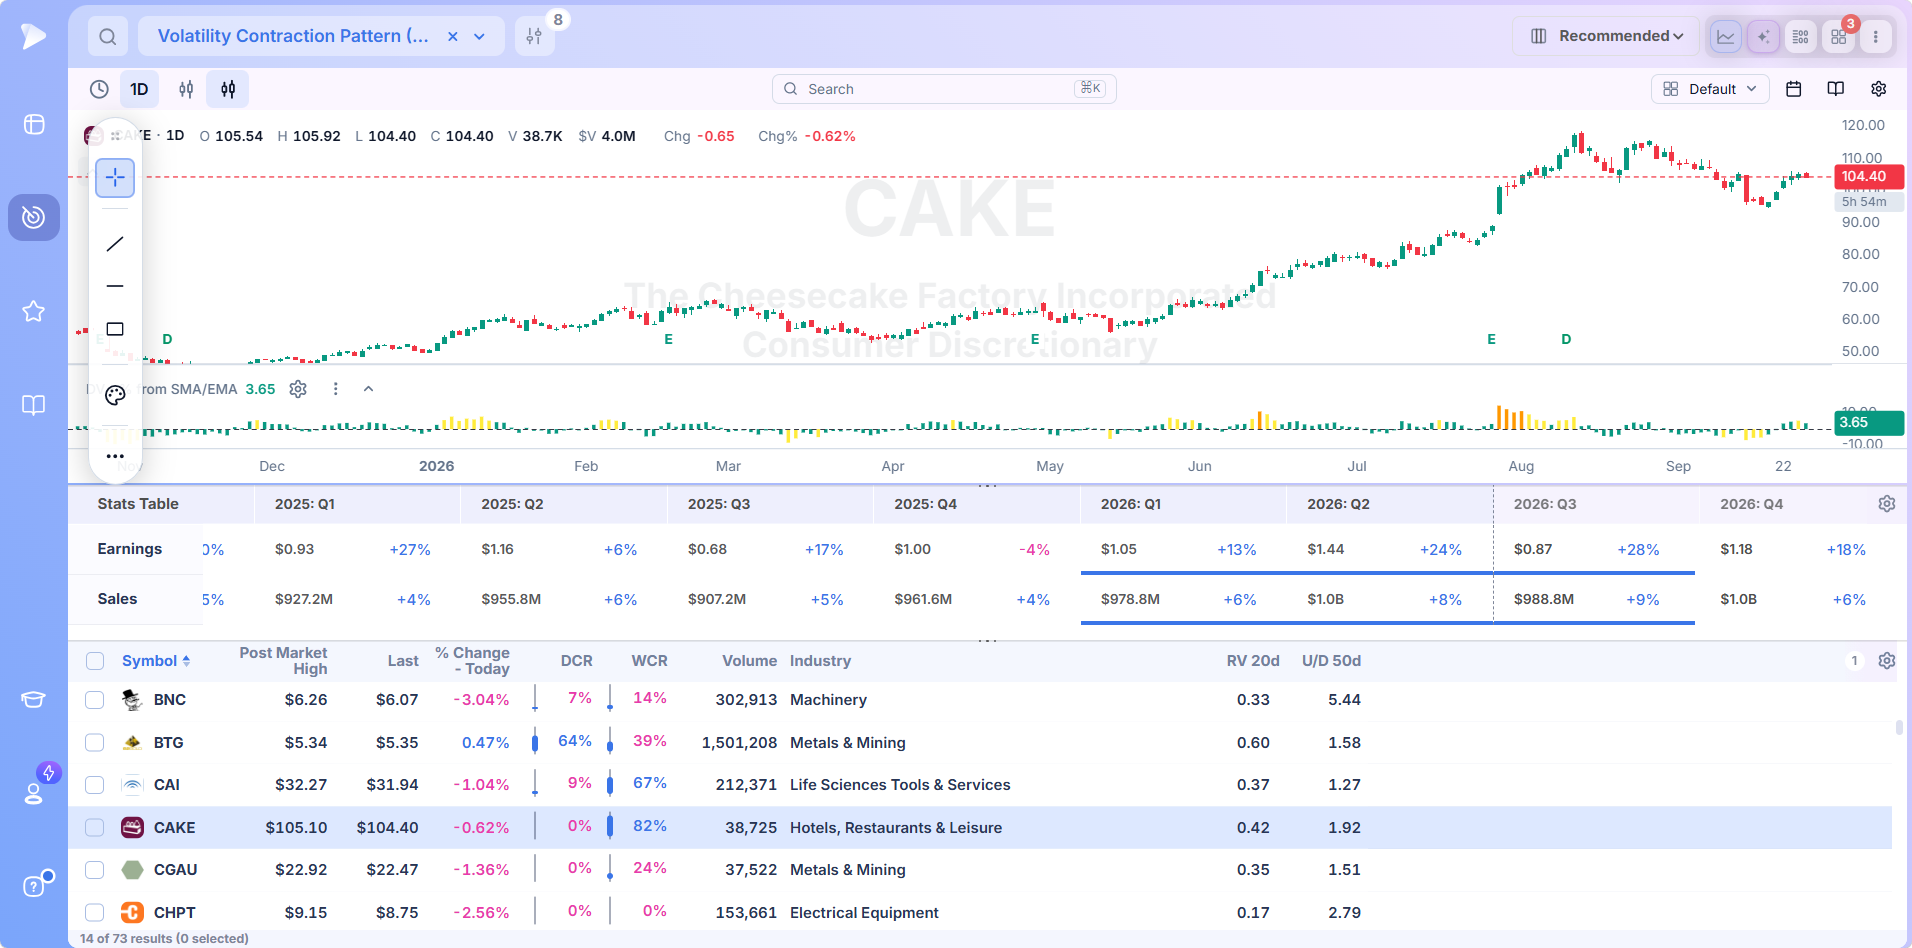
Every row opens its chart beside the results with drawing tools ready, and RMV can run in its own pane so tightness and price read together.
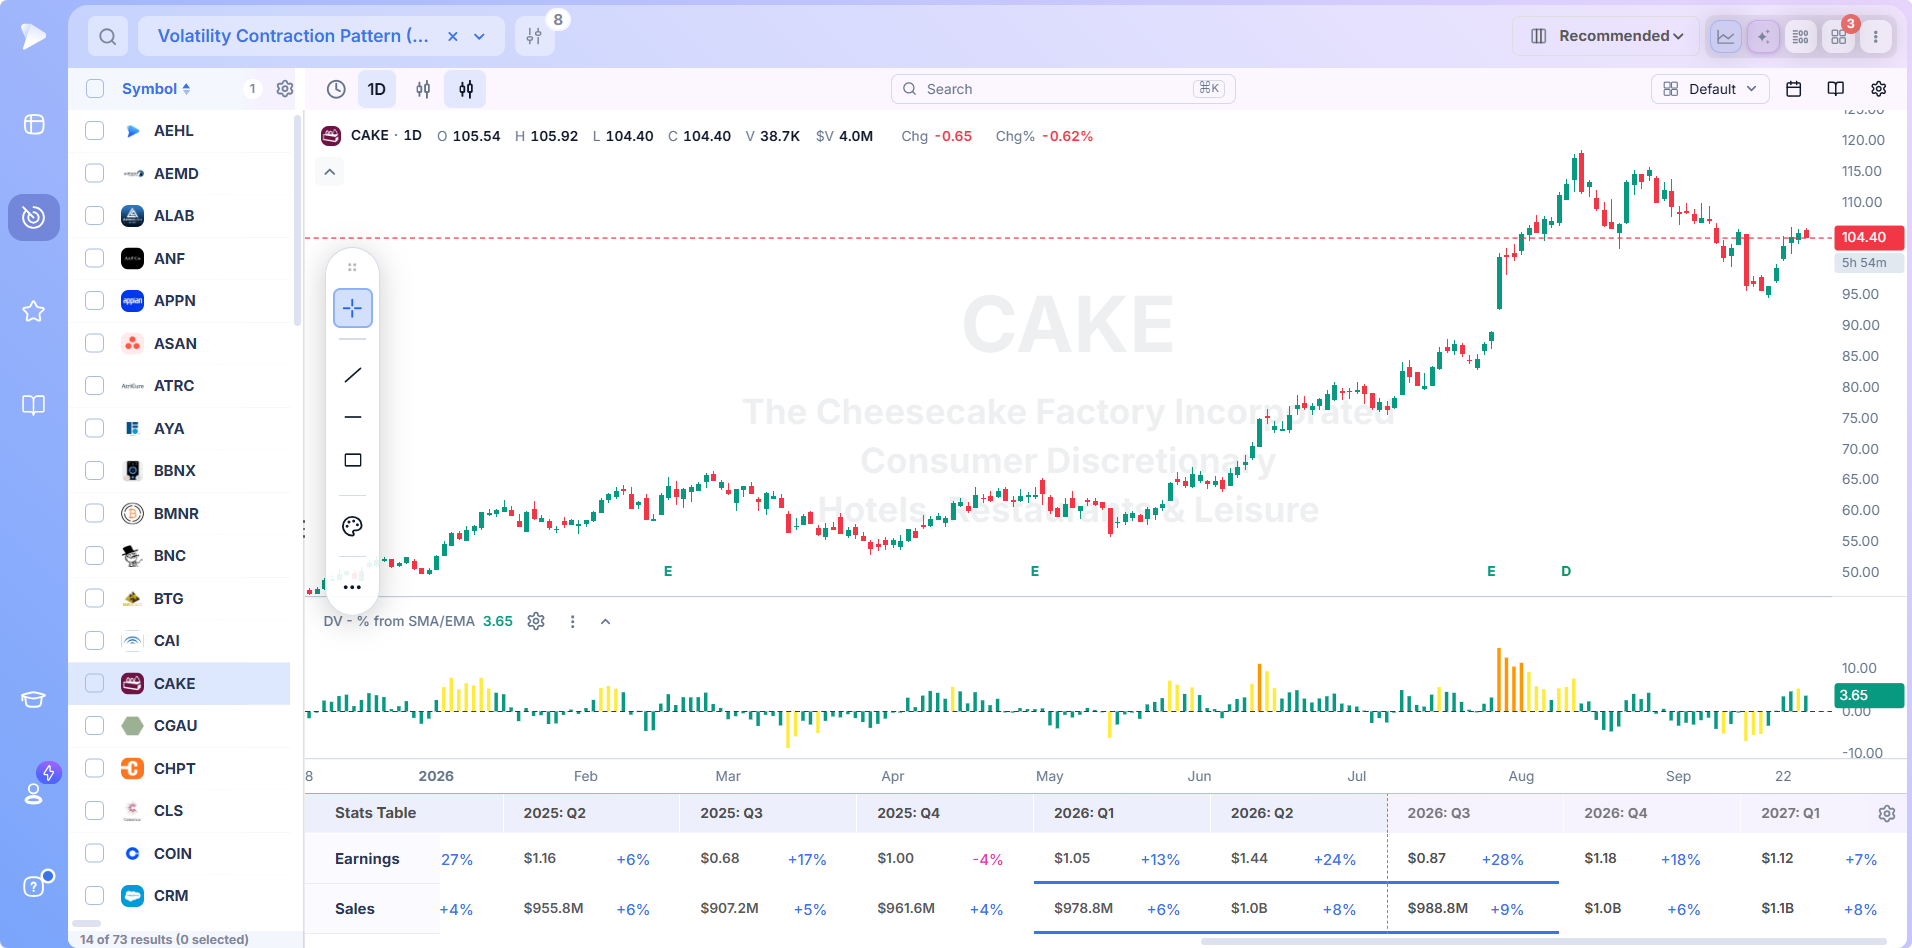
Look for shallow late pullbacks, bunching closes and drying volume, then the expansion that ends the pattern. Some bases never resolve, and reading the difference is the skill the screen buys you time to build.
From Row to VCP Breakout Alert in Two Clicks
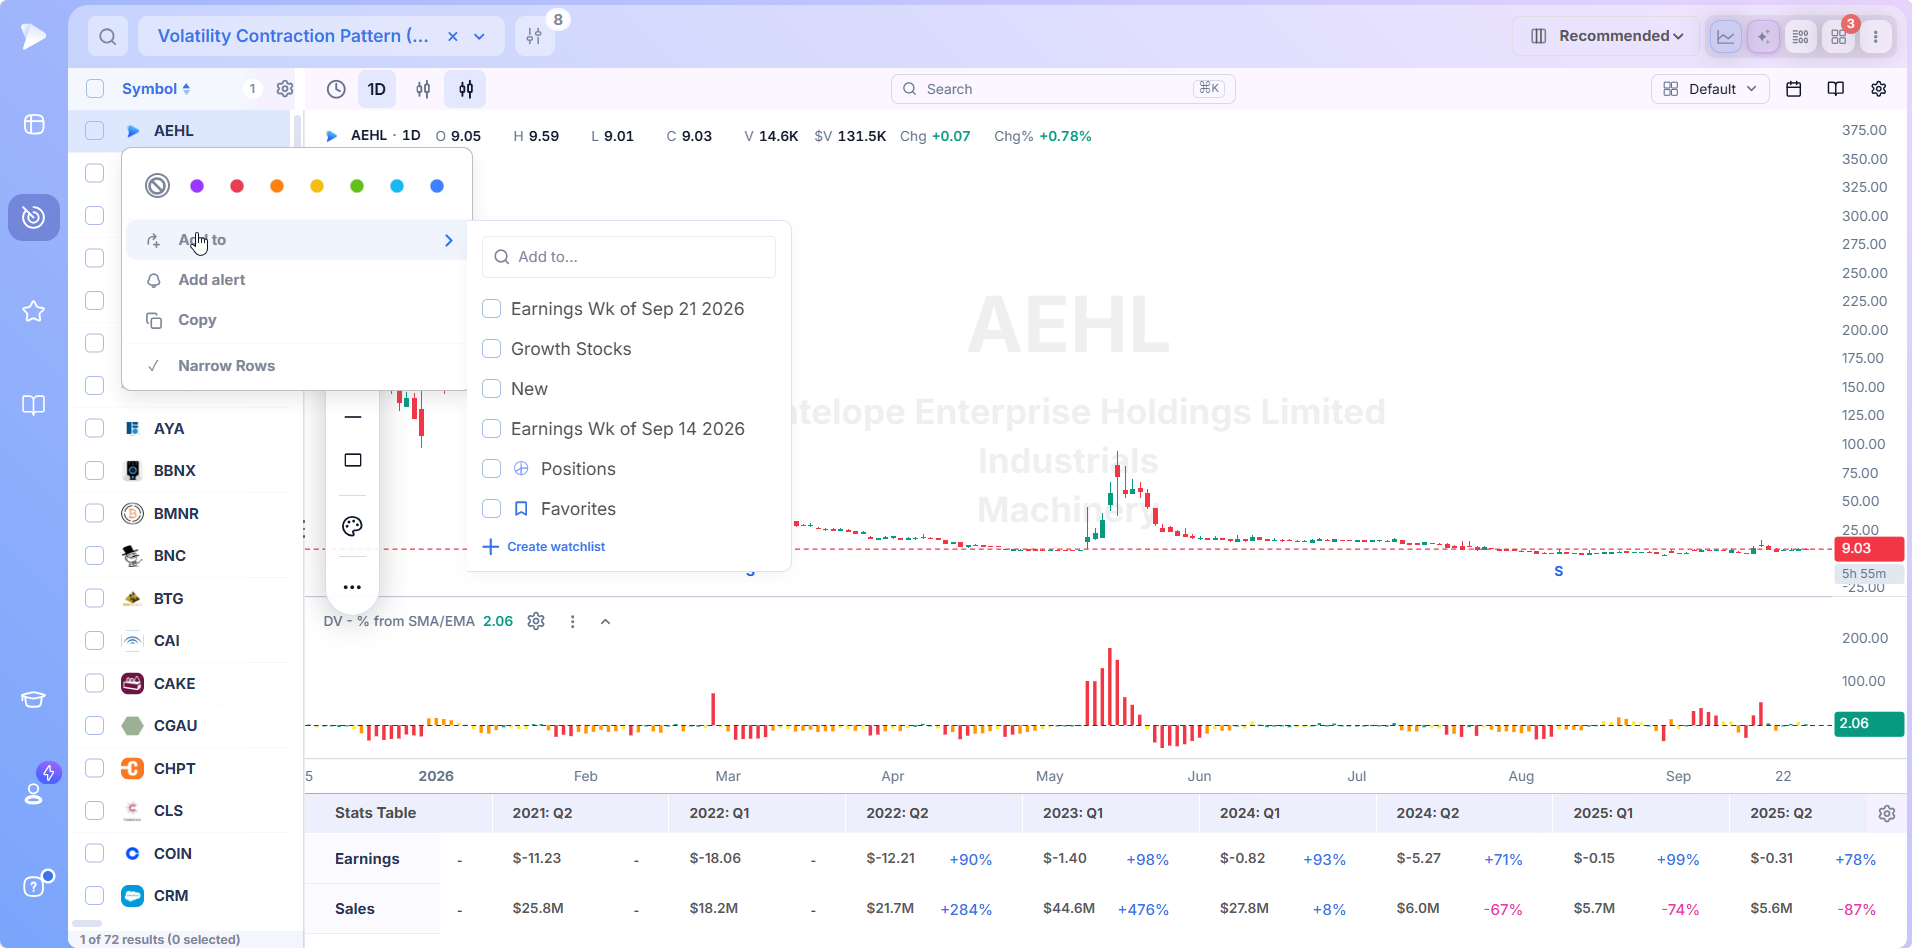
Right click any row to color tag it, add it to an existing or new watchlist, set an alert or copy it.
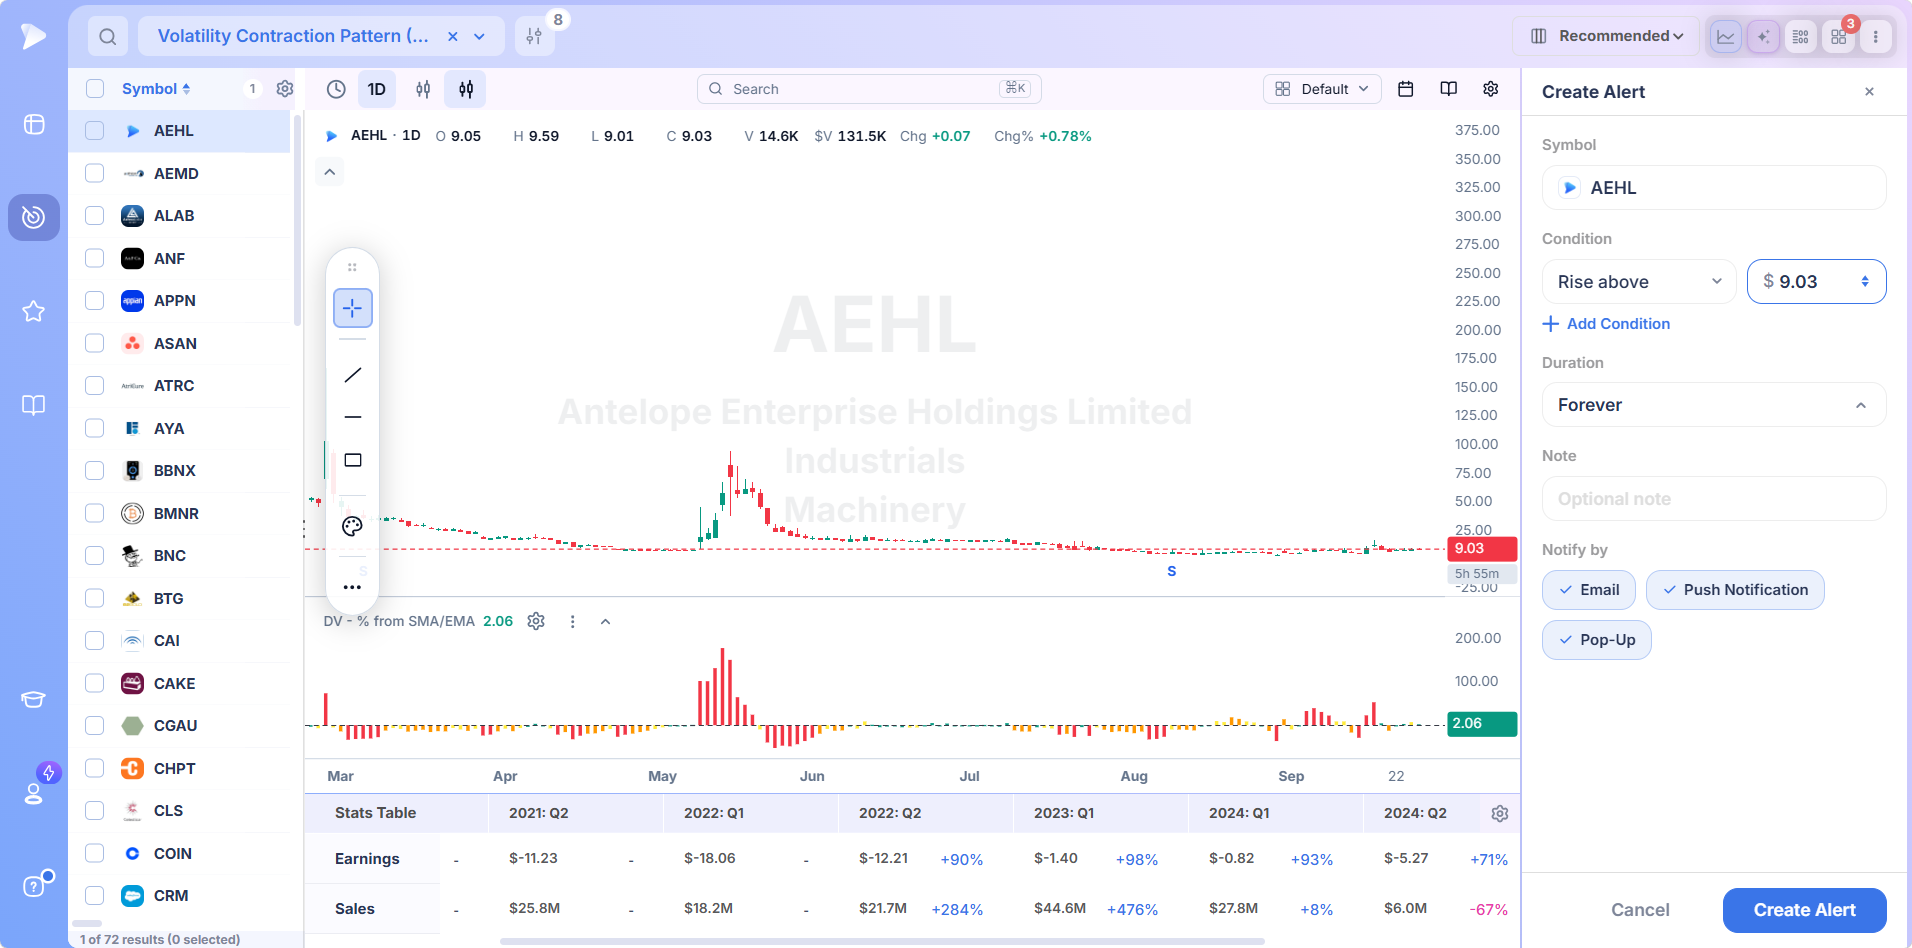
Price alerts take the pivot directly. Stack conditions, set a duration, add a note and pick email, push or an in platform pop up, so the VCP breakout comes to you.
A Table Built for Reading Bases
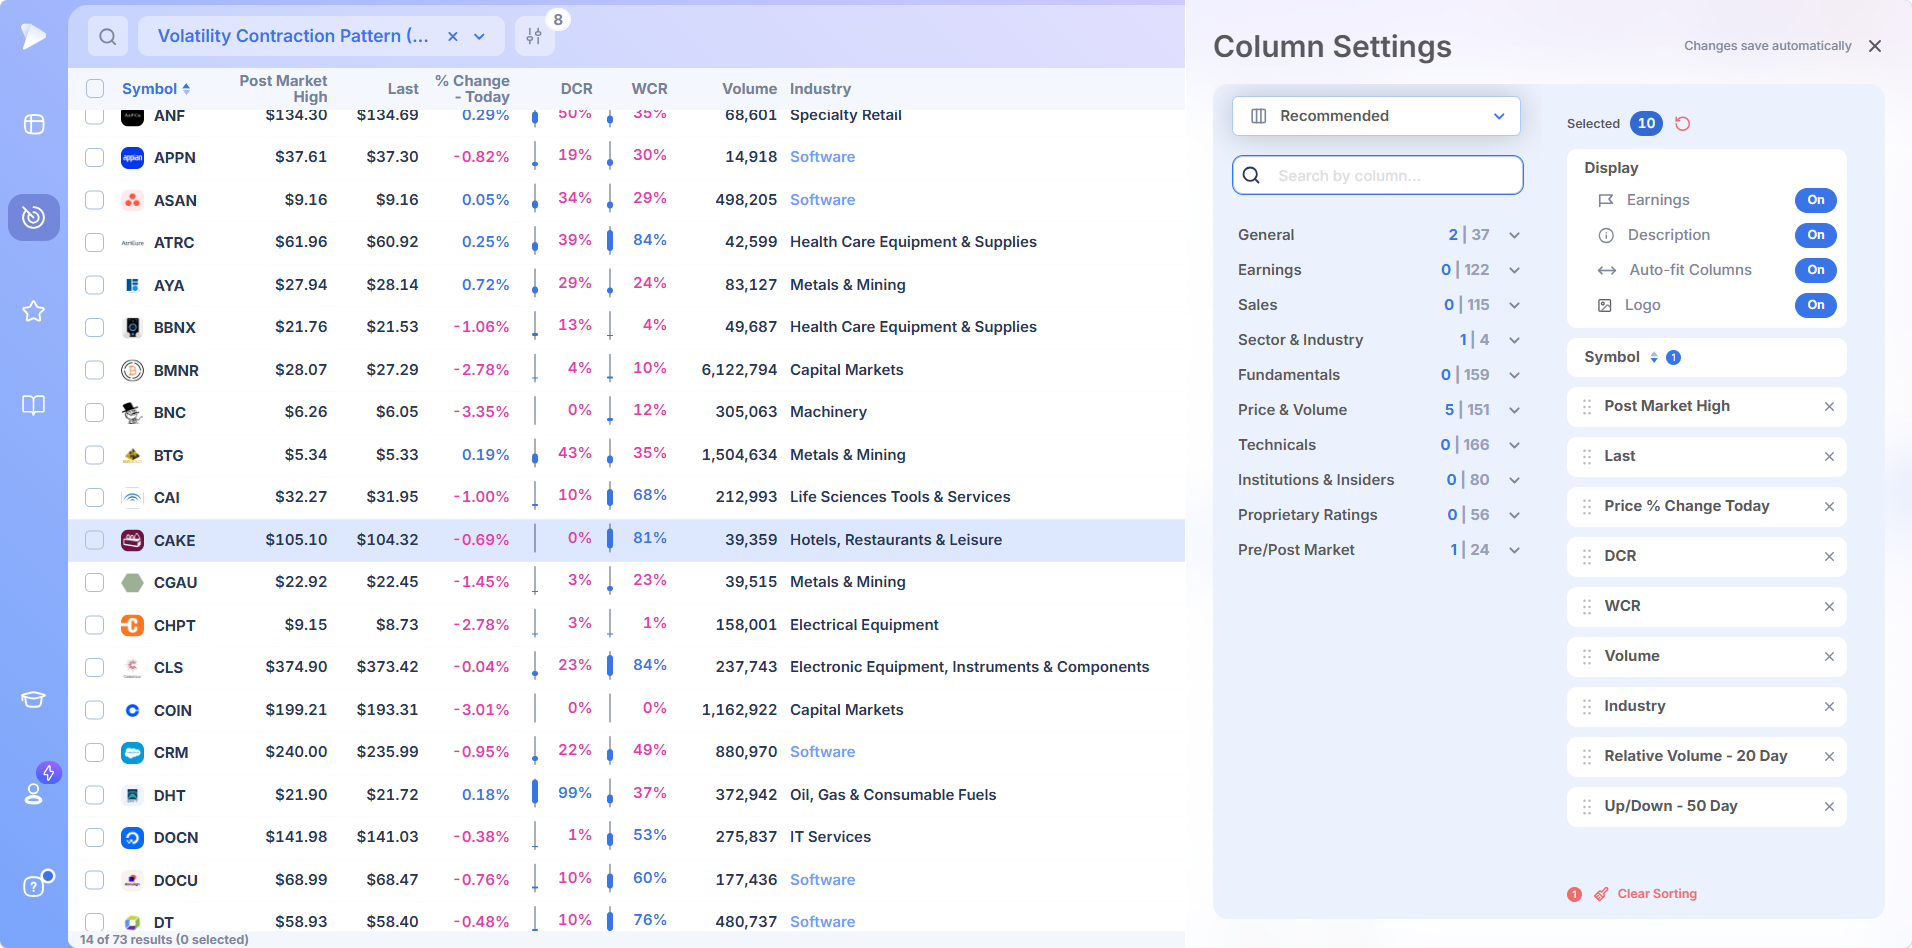
Columns draw on 1,152 data points grouped by category. For VCP work, add distance from the 50 day, percent off the 52 week high, relative volume and the up/down volume ratio.
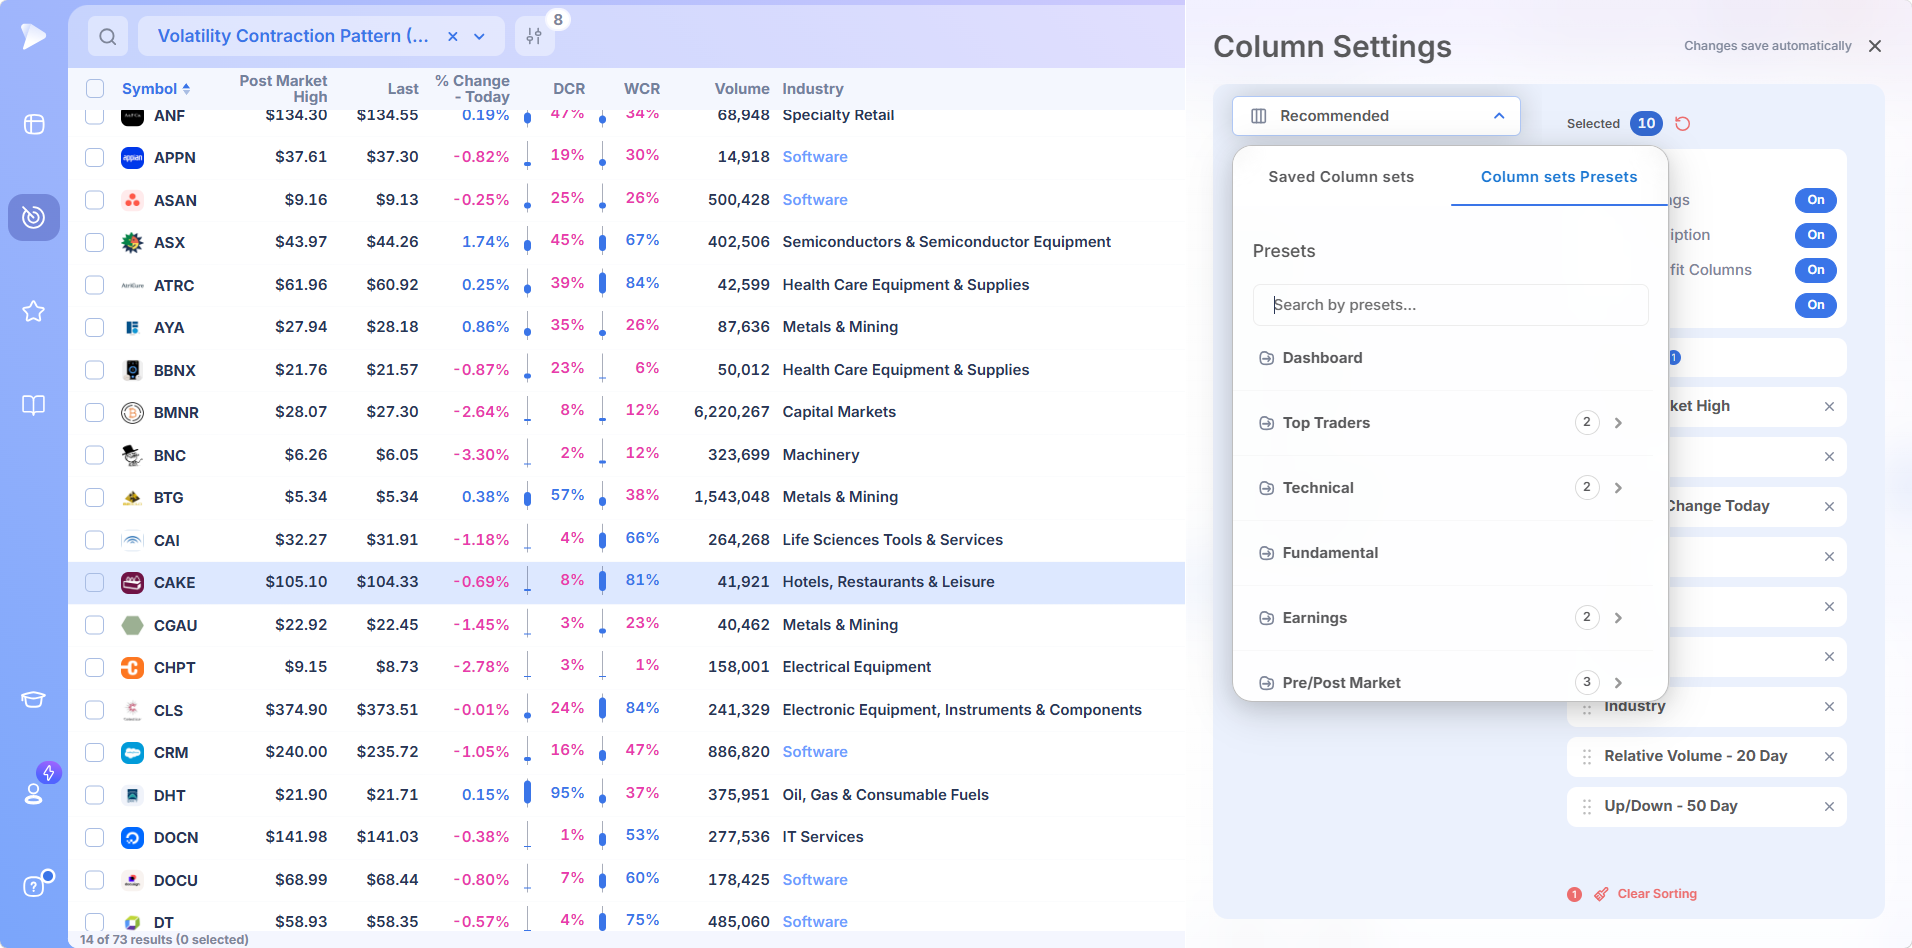
Save column sets in the order you read fastest, or start from a preset, so your base table and gapper table stay separate.
How to Build a VCP Pattern Screener, Step by Step
Six conditions, built once and saved.
Load the Volatility Contraction Pattern (VCP) preset and save a copy to unlock the filters.
Set RMV under 10 with a 15 bar lookback, or 5 bars for faster names.
Add leadership: relative strength in the top percentile over 1 or 3 months.
Add tradeability: minimum average daily range, dollar volume and price floors.
Add base context: above the 50 and 200 day moving averages, near the 52 week high.
Run it, review the charts, move keepers to a watchlist and alert each pivot.
Rather type it? The AI Terminal turns a sentence into the filter stack, ready to tune.
What the Screener Will Not Do For You
RMV can’t tell whether tightness is constructive. A stock grinding sideways halfway off its high can match a textbook final contraction, and only the chart separates them.
Contractions also fail, break down or drift until the setup expires. VCP trading gives you a defined risk point and a decent hit rate in the right market, with a strong market, theme and stock lined up behind it.
What the screen buys you is time: 20 tight charts to review instead of 600, and your attention on the question that matters, whether this one is in the right place.
Who This Screener Is For
- •Traders running a Minervini style VCP trading process who want each setup found for them
- •Growth and momentum traders buying breakouts from constructive bases
- •Anyone losing weekends to chart reviews by eye
- •Traders who want tightness and business quality in one query
- •Swing and position traders sizing risk against a defined range
Pricing
One plan at $49 a month, RMV included.
- •Proprietary indicators, including RMV on charts and as a screener condition
- •Every preset and the full field library, so tightness, leadership and fundamentals share one query
- •Charting, watchlists, alerts and column sets, the whole path from scan to pivot
- •Live data through the session, with 568 fields streaming, so a contraction that resolves at 10am shows up at 10am
MarketSurge costs $149 a month, and RMV is exclusive to Deepvue.
Signing up includes a one on one setup call, an onboarding email series and weekly live webinars, several on this pattern.
Stop Hunting the Pattern by Eye
Contraction is one of the clearest tells in growth trading and the hardest to search for. Measuring it instead of describing it is what makes this volatility contraction pattern screener work.
Browse every formation in stock screener by pattern and indicator screens under screener by indicator.
Start screening for contractions today
↑ Back to contentsFrequently Asked Questions
What is VCP in stock trading?
VCP in stock trading stands for volatility contraction pattern, a base where price range and volume tighten from left to right as sellers are absorbed, usually inside an uptrend. Deepvue scores that tightening with RMV, so you can screen for it instead of hunting through charts.
What does VCP mean in finance?
In finance, VCP means volatility contraction pattern, the base popularized by Mark Minervini. Outside markets the initials mean unrelated things, like a VMware certification. Deepvue’s volatility contraction pattern screener is built around the trading definition.
How does the VCP pattern work?
The VCP pattern works by exhausting supply. Each pullback flushes out sellers that buyers absorb, until almost none are left, the range collapses and modest demand lifts price through the pivot on rising volume. Deepvue’s RMV measures that collapse directly.
How reliable is the VCP pattern?
The VCP pattern is reliable enough to build a process on, though never to trade blind. Results depend on market conditions and many tight areas fail. Its edge is a defined risk point, and a Deepvue alert on the pivot tells you when it triggers.
How do you find VCP pattern stocks?
You find VCP pattern stocks by screening for tightness instead of flipping through charts. In Deepvue, load the Volatility Contraction Pattern (VCP) preset or build your own with an RMV condition, relative strength and liquidity floors, then review the charts.
What is the VCP indicator in TradingView?
TradingView has no official built in VCP indicator, and community scripts vary because each author defines tightness differently. Deepvue’s RMV is a proprietary VCP indicator built for this job, usable as a screener condition and a chart pane.
What is the time frame for a VCP pattern?
The time frame for a VCP pattern is usually several weeks to several months, with the final tight area lasting days to a couple of weeks. In Deepvue, match the RMV lookback to it: 15 bars for longer bases, 5 for IPO bases and faster names.
What is the Mark Minervini trading strategy?
The Mark Minervini trading strategy buys leading growth stocks as they break out of constructive bases, with strict risk control and a trend template for moving averages and relative strength. The Minervini VCP is its core base, and Deepvue screens for it with RMV and the Minervini Trend Criteria preset.
What is a VCP breakout?
A VCP breakout is the move out of the final contraction through the pivot on a clear expansion in volume. Volume confirms it, since a quiet breakout usually means demand hasn’t arrived. Set a Deepvue alert on the pivot and the breakout comes to you.
What is the best VCP screener?
The best VCP screener measures tightness relative to each stock and pairs it with leadership and fundamentals. Deepvue does both with RMV, the Volatility Contraction Pattern (VCP) preset and 1,152 data points, with charts and alerts beside the results for $49 a month.