Stock Market Top Movers: The Day’s Biggest Stock Movers, With the Reason Attached
Top Movers is a dashboard app inside Deepvue that ranks the stock market top movers for a chosen session and tells you what caused each one. Every row carries the symbol, the percent change, a Bullish or Bearish tag, and a written catalyst.
Four tabs split the day into All, Pre, Regular and Post, a date control reaches back through earlier sessions, and a right click sends any name to a watchlist, the clipboard or an alert.
and today’s ranking lands on your board with the reasons already written.
Deepvue market movers, in numbers:
Key Takeaways
You know the drill. Something is up 30 percent, you have never heard of it, and now you are three browser tabs deep trying to work out whether this is a real move or a press release with a stock attached. Twenty minutes gone, still no answer.
Top Movers kills that errand. It ranks the day’s top moving stocks, tags each one Bullish or Bearish, and prints the reason in the same row as the number. Percentage and cause in one glance turns a movers list from something you skim into something you use.
- ✓Four columns per row: symbol, percent change, a Bullish or Bearish tag, and a written catalyst explaining the move.
- ✓Four session views: All, Pre, Regular and Post, with the All tab merging them and labeling where each move came from.
- ✓Ranked by percent change, with the top percentage gainers at the head of the list and the top percentage losers at its foot.
- ✓Sortable and historical: sort on sentiment to bring declines to the top, or step the date back for the daily stock movers from any earlier session.
- ✓Actionable on the spot: right click a mover to tag it with a color, add it to a watchlist, copy the ticker or attach an alert.
- ✓Included in the one plan. Get started with Deepvue here.
Top Movers at a Glance
- Session tabs
- All, Pre, Regular and Post, selecting which part of the trading day the ranking covers
- Columns
- Symbol, % Chg, Sentiment and Catalyst, with sort controls on % Chg and Sentiment
- Catalyst
- A written account of what drove the move, printed beside the number
- Sentiment
- A Bullish or Bearish pill on every row, colored to match
- Ordering
- By percent change, largest gain first; a Sentiment sort brings Bearish rows to the top
- Date control
- Arrows either side of the date plus a month calendar; future dates unavailable
- Refresh stamp
- A Last updated time in Eastern time, above the Catalyst column
- Row actions
- Right click for color tags, watchlist adds, Copy and Add alert
- Where to find it
- Research apps, via Add Apps
- Cost
- No extra charge on the one Deepvue subscription
What the Stock Market Top Movers App Shows
One table, four columns and a control strip on top. The proportions tell you what the app cares about: the numbers stay compact and most of the width goes to the explanation. The figures in the screenshots come from single sessions and are examples, not live data.
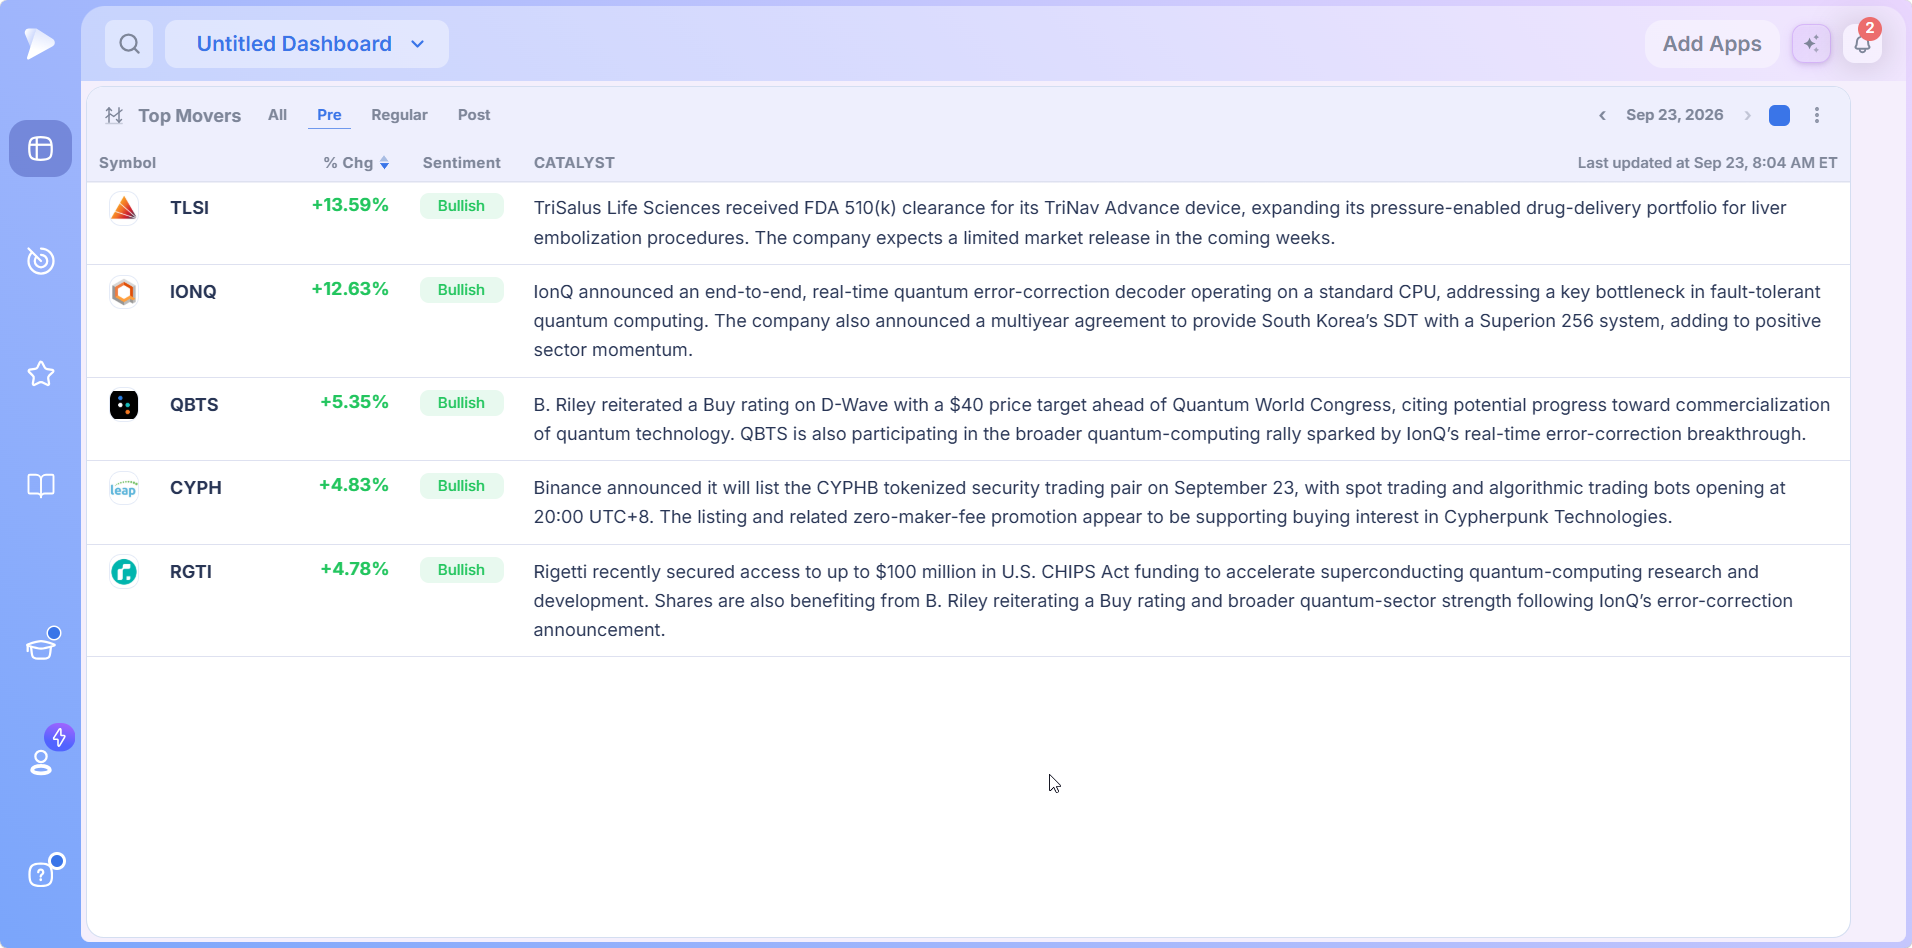
- •Symbol. Ticker plus the company mark. In the All view a small session tag appears beside it, marking where the move was recorded.
- •% Chg. Percent change for the session, green up and red down. The header sorts, and this column sets the default order.
- •Sentiment. A Bullish or Bearish pill, colored to match. This header sorts too, giving a second way to arrange the same names.
- •Catalyst. A sentence or two on what happened, the column doing the heavy lifting.
Above the table are the four session tabs, a date with arrows either side, a small colored square that assigns the widget to a color group, plus a three dot menu. A Last updated stamp reports the latest refresh in Eastern time, matching the market clock rather than yours.
Who the Top Movers App Is For
- ✓Momentum traders who want the day’s largest reactions and the reason for each in one pass, not across five news tabs.
- ✓Swing traders building a watchlist from catalysts, where a gap on strong results is the start of a setup rather than the end of a move.
- ✓Position traders watching what they already hold, for whom the top losing stocks are the half of the list that counts.
- ✓CANSLIM traders hunting earnings gaps and episodic pivots, where the catalyst text names the surprise outright.
- ✓MarketSurge users who want a movers view that explains itself and shares a screen with the charts and screens they already run.
Most of these styles get their own routine on the Deepvue for hub.
The Catalyst Column: Why Today’s Top Moving Stocks Moved
Most movers tables hand you a ticker and a number and wish you luck. This one writes down what happened, specifically enough to act on.
The real value is how fast you can throw names away. An acquisition at a fixed cash price is over; that stock will trade near the offer for months. A secondary priced under the market is supply, not demand. A record quarter that beat expectations on accelerating revenue is a different animal, and it belongs on a watchlist tonight. Strip the catalyst column away and all three look identical: big percentages on a screen.
What the Catalysts Tend to Cover
- •Earnings and sales results, with the direction and scale of the surprise against expectations.
- •Analyst actions, a target raised or cut, a rating moved, or coverage initiated.
- •Deal news, acquisitions with the price per share and the premium to the prior close.
- •Capital markets activity, secondary offerings, convertible notes, buyback authorizations and debt issuance.
- •Regulatory and product news, such as a device clearance or trial data.
- •Sector and theme moves, where a stock is carried by money running through a whole group rather than by its own news.
That last one repays attention. When several of the day’s top moving stocks share a driver, you are not reading six stories but one, and the Theme Tracker tells you whether the theme behind it has been leading for a week or only since lunchtime.
The universe is not restricted to ordinary common stocks. Leveraged exchange traded funds turn up too, and a fund built to return twice the daily move of one large company will regularly outrank real operating businesses on percentage alone. The catalyst text names them as such, which is exactly why you read it.
Bullish and Bearish Tags on the Biggest Stock Movers
Every row wears a sentiment pill: green Bullish, red Bearish. In practice the tag matches the direction of the move, so read it as a label on the row rather than a separate forecast. Its job is structural, since the column sorts and turns one mixed table into two clean halves.
Sorting: Top Percentage Gainers and Top Percentage Losers
By default the list runs in order of percent change, from the largest gain at the top down to the steepest decline at the bottom. The top percentage gainers are what you read first; the top percentage losers are there too, collected at the foot of the list.
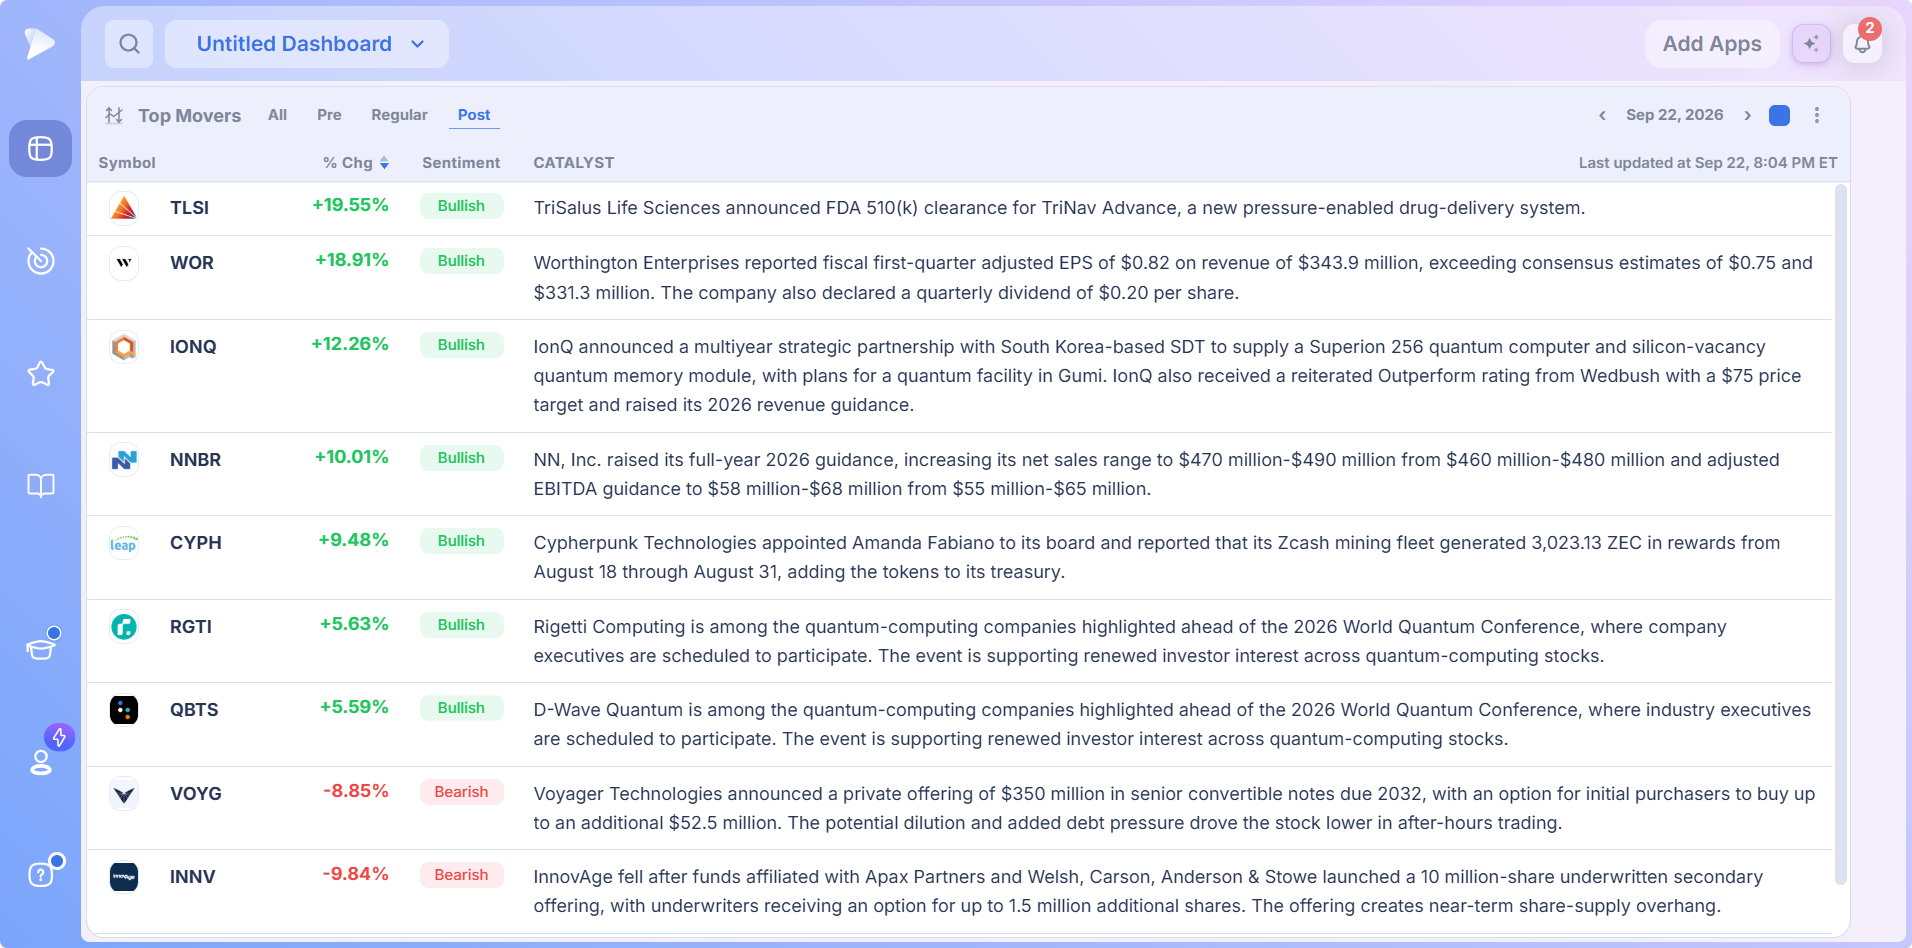
Click the Sentiment header and the table regroups: Bearish rows move to the top with the steepest decline first, and Bullish rows follow with the largest gain first. Click % Chg and you are back to the straight ranking. Two controls, two readings of the same session, about two seconds.
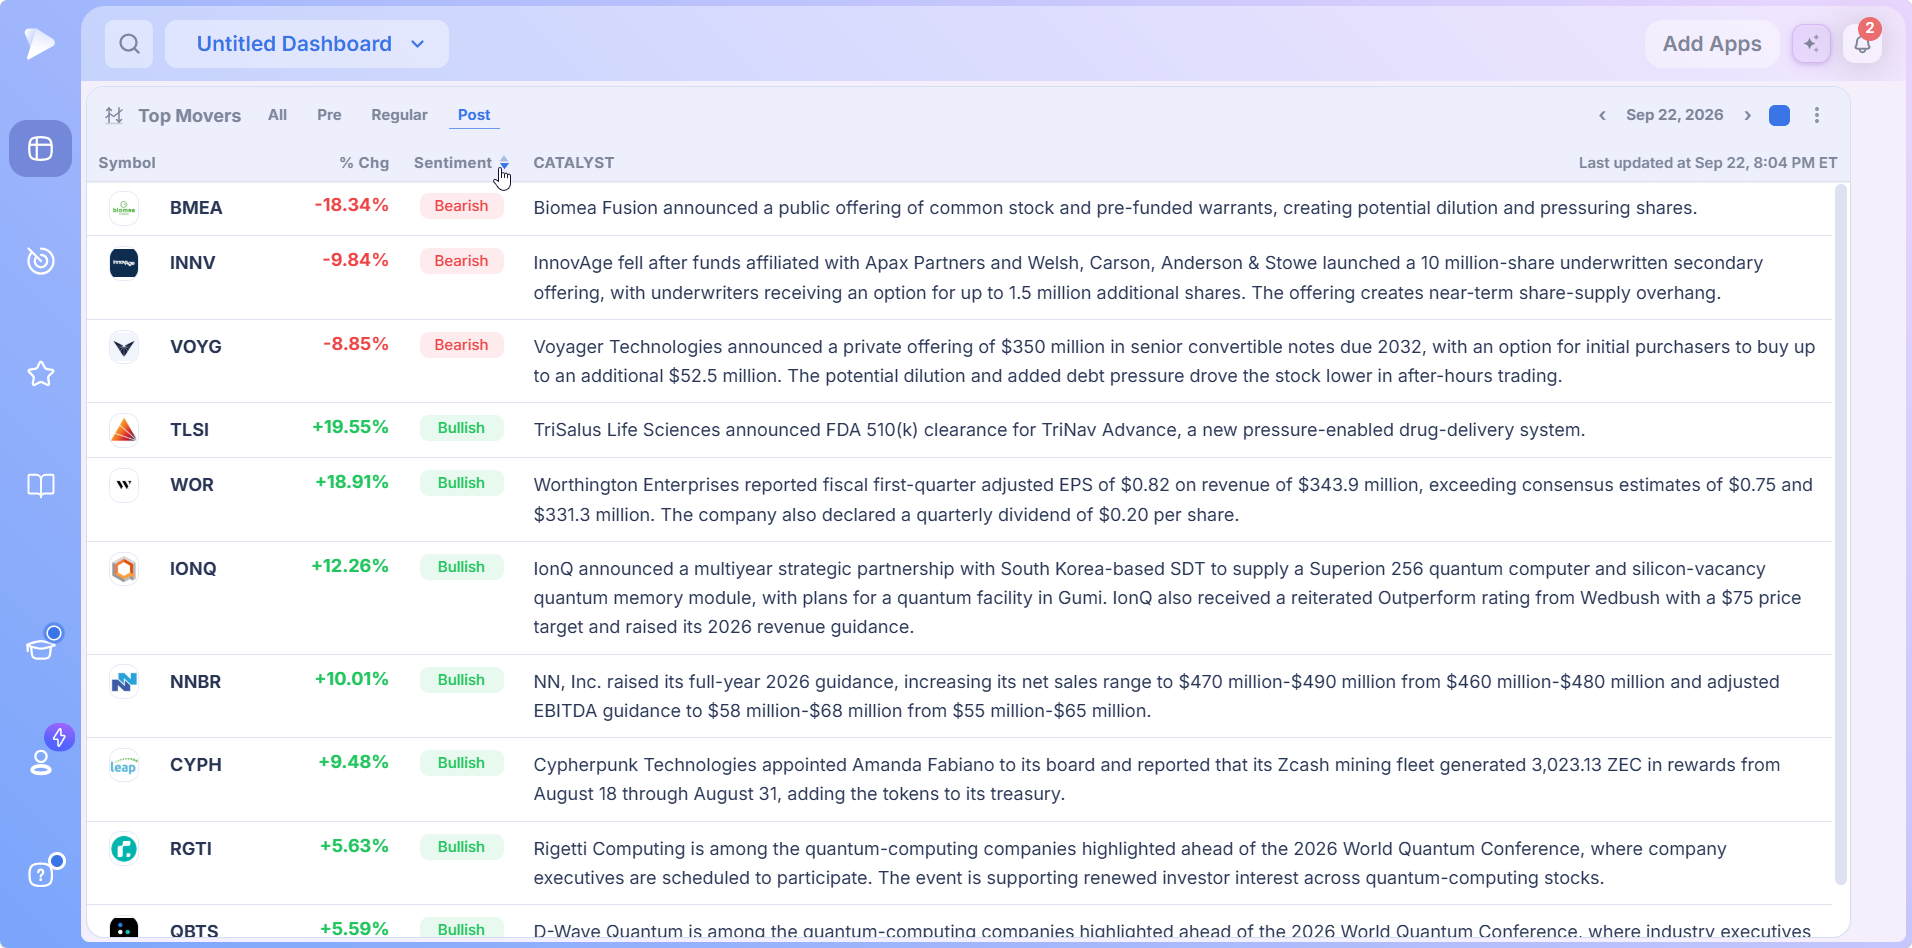
Read the Top Losing Stocks on Purpose
Most traders skip the red rows, and that is a mistake. The top losing stocks tell you where positioning just broke, and a name that gaps down on a guidance cut or a dilutive offering has told every holder the story changed. That news travels through the rest of its group over the following sessions.
There is a selfish reason too. If something you own shows up among the biggest stock losers with a catalyst you had not seen, you know before the close instead of after it. Pair the habit with the Alerts app and a daily check becomes something closer to a safety net.
Four Session Views for Stocks Moving Today
The four tabs are the app’s most useful control, because the same stock is a completely different proposition depending on which session produced the move.
Pre
Premarket runs from 4:00 AM Eastern to the 9:30 open. Thin volume, wide spreads, prices moving on whatever landed overnight: results before the bell, a deal at 7:00 AM, an early analyst note. A short list is normal here. The timestamp matters more than anywhere else, because a name up seven percent at seven in the morning can be up two by the bell once real size shows up. Treat a premarket ranking as a starting point for the open, not a verdict on it.
Regular
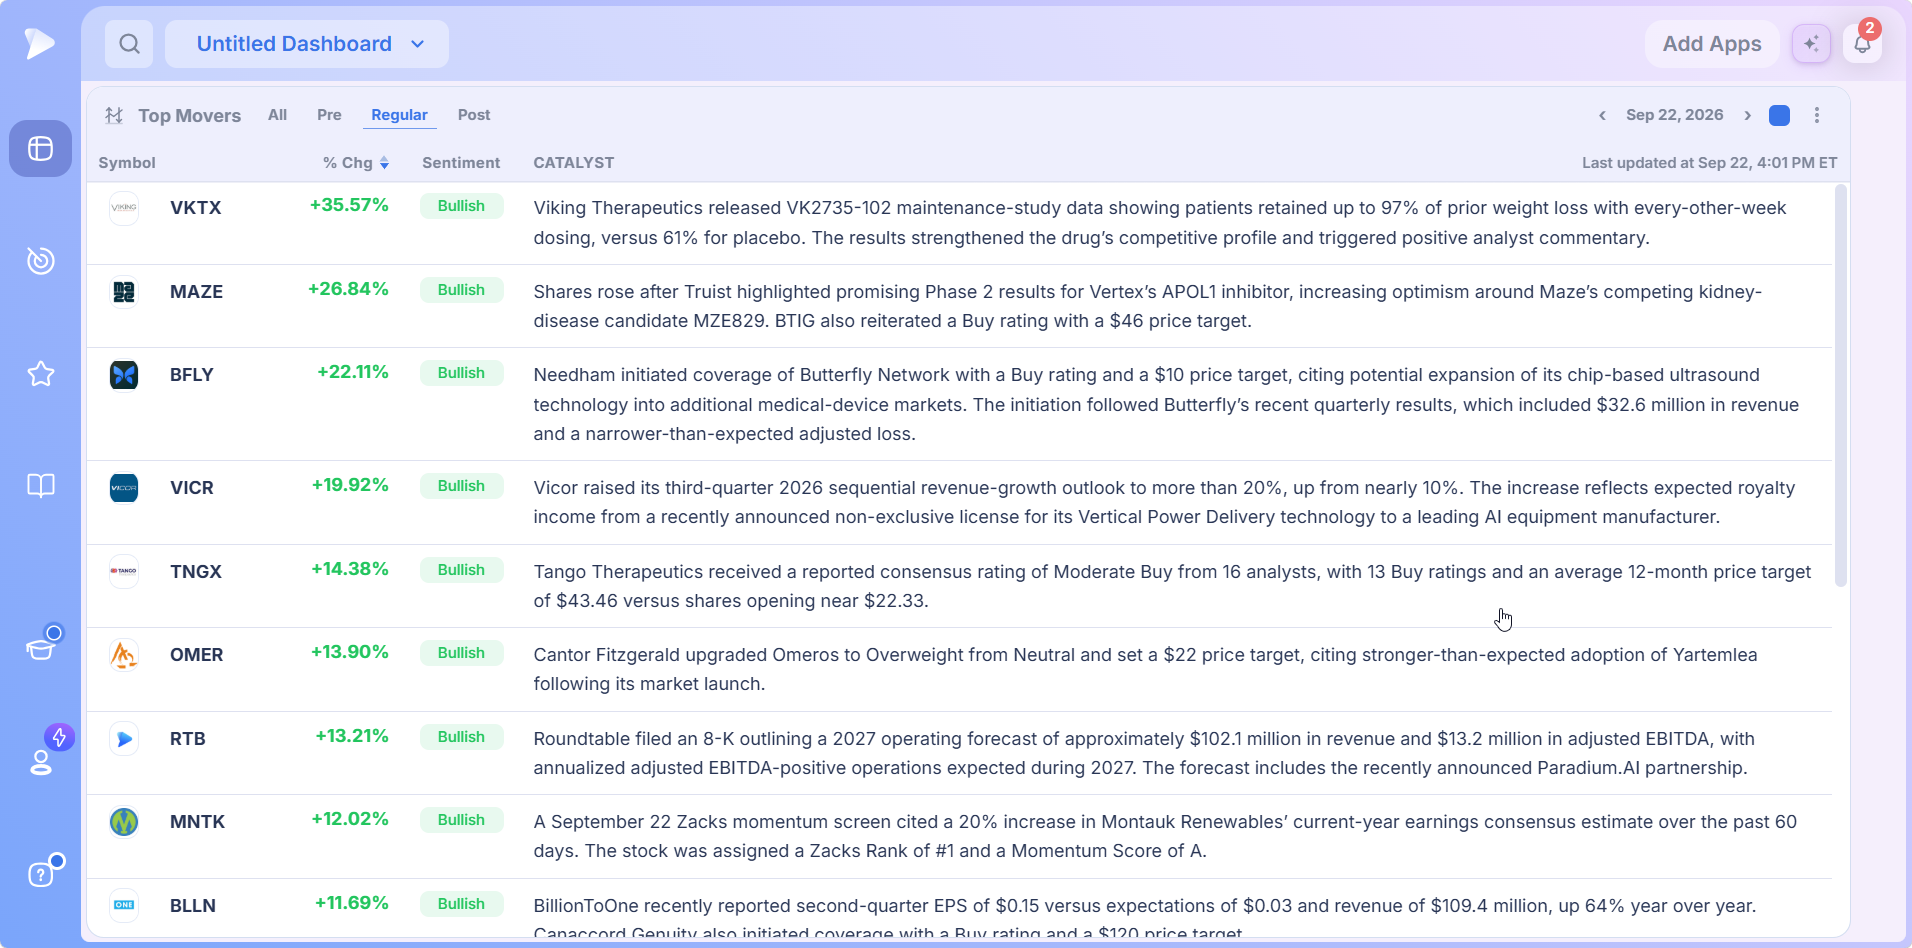
9:30 to 4:00 Eastern, and this is where the list gets long. Real volume is behind these moves, and a large gain that holds into the afternoon means something a premarket print never can.
Post
The Post tab picks up the reaction to results and announcements released after the bell, which is when many companies report. The reaction starts long before the next open, and seeing it tonight beats discovering it at 9:30 tomorrow.
All
The All tab merges the sessions into one ranking and tags each row with where its move came from, such as Pre. This is the view to leave a board on, because it answers the widest question: what has been moving today.
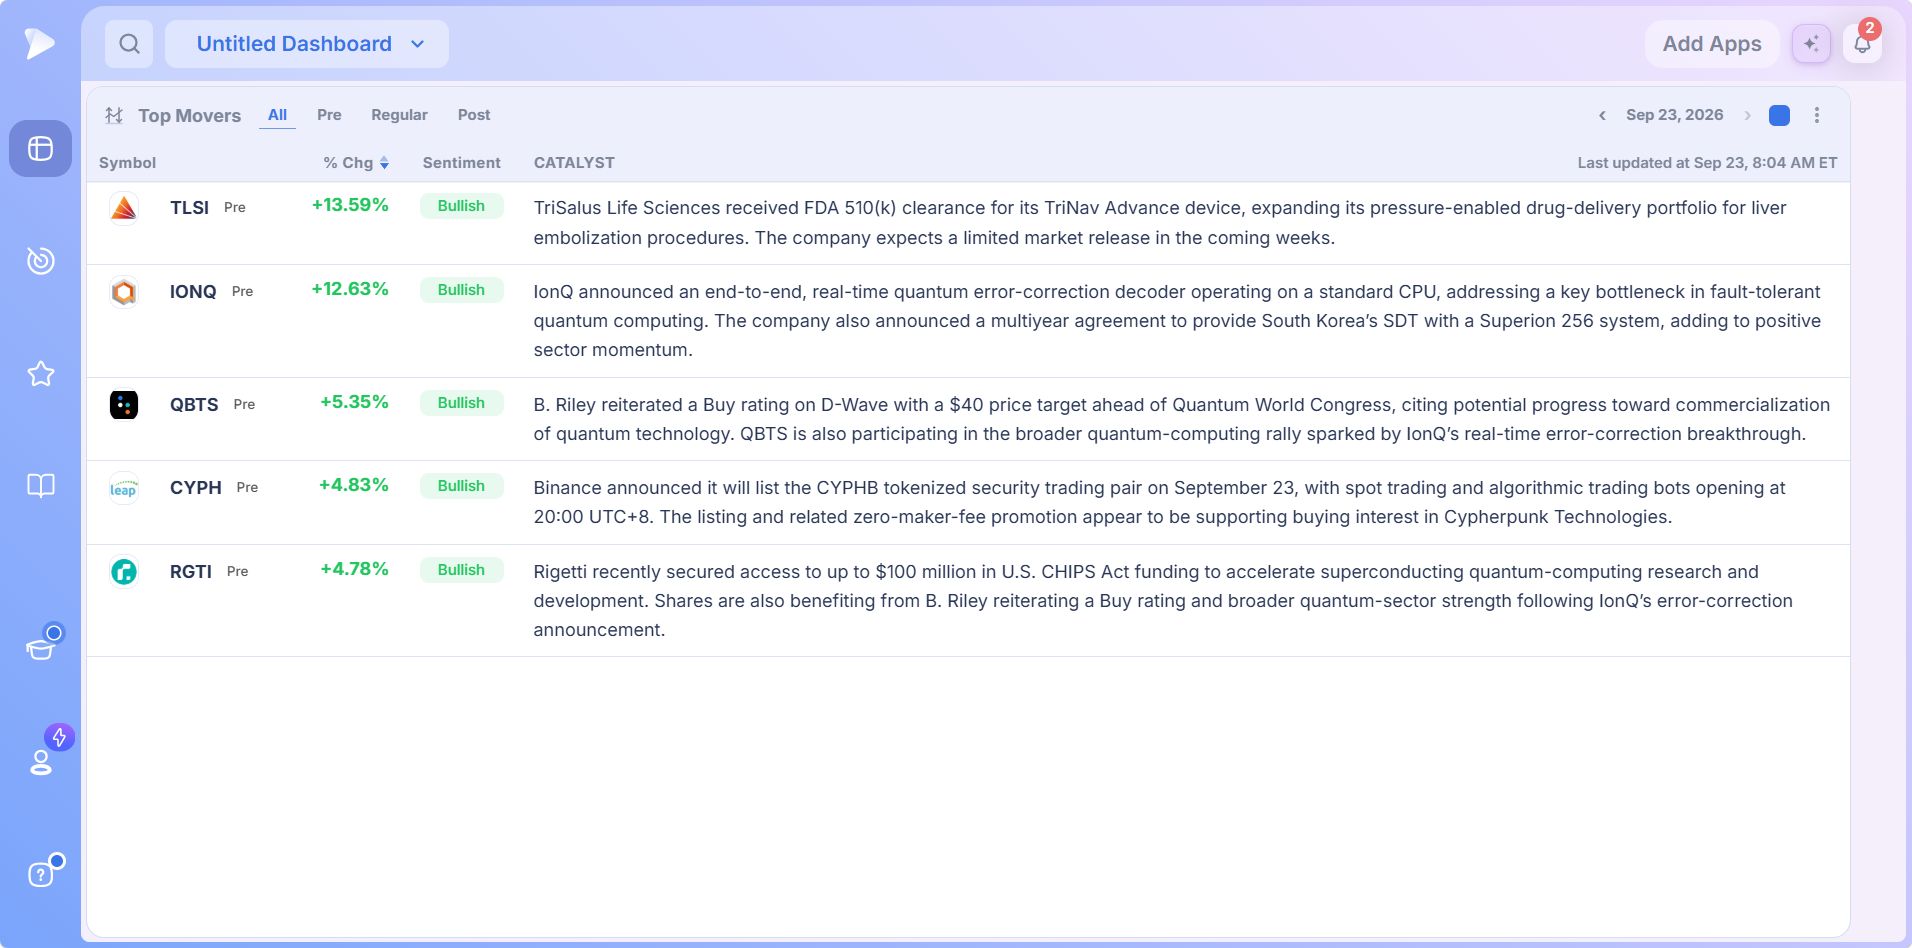
The tags make this view readable. A premarket name near the head of the ranking makes a weaker claim than a regular session name in the same spot, and the tag stops you confusing the two. For stocks moving today across the whole day rather than one slice, this is the tab.
Try Deepvue and see which stocks are moving today, with the reasons written beside them.
Looking Back at Daily Stock Movers From Earlier Sessions
Arrows either side of the date step one trading day at a time. Click the date itself and a month grid opens, with dropdowns for a different month or year. Future dates are grayed out, since nothing has happened tomorrow yet.
Looking back earns its keep. When a stock turns up on a screen, stepping through the daily stock movers around that period tells you which day carried the news and how hard it hit, separating a quiet grind higher from a gap on a specific catalyst three weeks ago. It also makes the app a review tool: running back through the week on a Friday and asking which catalysts produced follow through is one of the cheapest ways to get better at reading news.
From a Mover to a Watchlist: The Right Click Menu
A movers list you can only read is a news feed. This one plugs into the rest of the platform, so a ticker that pulls your attention becomes something you track without a detour. Right click a row and a strip of color swatches runs across the top, with a clear option, above three entries:
- •Add to. Expands into your saved lists, each with a checkbox, a search field above them, and a Create watchlist link when the right list does not exist yet.
- •Copy. Lifts the ticker to your clipboard, handy when the next stop is a spreadsheet or a trade journal.
- •Add alert. Attaches an alert to the name so the next move finds you instead of the other way around.
The swatches mark a symbol with a color, turning a long list into a triaged one: one color for names to chart properly tonight, another for names you are just noting. Naming a list for the earnings week it covers gives you something worth reviewing later, and the Watchlist module holds them all.
Pairing Top Movers With a Chart Using Color Groups
The small square in the control strip puts the widget in a color group, the mechanism dashboards use to keep separate widgets in step. Two widgets sharing a group share a symbol, so a chart beside the movers table follows whatever name you pick.
This is the layout that earns the app a dashboard slot instead of a browser tab. The list supplies the name and the reason; the chart answers what the catalyst cannot, which is whether the move happened somewhere that matters.
A gap out of a long base on record results is a setup; the same percentage in the middle of a two month downtrend is noise with a press release stapled to it. Deepvue’s charts carry relative measured volatility, distance from a moving average and Enhanced Volume for exactly that call.
Open a Deepvue account and assemble that board tonight, so tomorrow’s ranking lands already explained.
How to Add the Top Movers App to a Dashboard
Go to the Dashboard module. Reopen a board you already use, or create a fresh one and give it a name.
Open Add Apps. The panel slides in from the right, with everything sorted into Core, Visualizations, Research and Tools.
Click Top Movers in the Research group to add it to the dashboard. Typing the name into the panel’s search field beats scrolling for it.
Give it a wide slot. The catalyst column rewards width, so a wide space reads far better than a narrow one.
Assign a color group from the header square, so a chart or another widget tracks the table.
Pick a session tab. Settings stick per instance, so one board can carry the app twice: Pre for the overnight news, Regular for what the open confirmed.
Reading a List of Top Gaining Stocks Without Getting Burned
A movers list is a source of ideas, not signals. Everything on it has already moved, so the easy part is behind you by the time you are reading. Every trader has bought the top of a forty percent day at least once. Four questions keep a name off the order ticket until it earns its place.
Is the Catalyst Finished or the First of Several?
An acquisition at a fixed cash price is finished. A short squeeze is finished the moment the shorts are out. A record quarter on accelerating revenue is the opposite: the first data point in a series, and institutions cannot build a position in one afternoon.
Where Did the Move Start From?
Out of a tight consolidation after weeks of quiet is a breakout. Off the lows after a long decline is a bounce. To a new high from an already extended position is late. That is a chart question, which is the argument for reading the table beside one.
Did Size Show Up?
A large percentage move on thin trade is not the same event as one on many times the usual activity. Institutions cannot buy quietly, so a breakout without a volume footprint tends not to hold. The table ranks on price, so this check belongs on the chart or in the screener.
One Stock or a Whole Group?
When several of the day’s market movers come from the same industry, the individual stories matter less than the rotation behind them. Industry Ranks, with the Theme Tracker beside it, answers that in seconds, and a leading name inside a leading group beats a strong name in a group nobody is buying.
One more question outranks all four. In a healthy uptrend, stocks that gap on good results keep going; in a correction the same gaps get sold. Market Breadth and New Highs / Lows give you that read fast.
Top Movers vs Most Active Stocks and High Volume Stocks
These three lists get treated as the same thing. They are not, and knowing which one you are looking at prevents a specific kind of mistake.
| List type | Ranks by | Surfaces | The trap |
|---|---|---|---|
| Top movers | Percent change over a session | The largest price reactions, up and down | A tiny company can post a huge percentage on almost no trade |
| Most active stocks | Share volume traded | Where the day’s turnover actually went | The same mega caps dominate it nearly every day |
| High volume stocks | Volume against a name’s own average | Unusual activity relative to normal behavior | Needs a baseline, so the comparison is doing the real work |
Top Movers is the first of the three, ranking the stock market top movers by percentage for the chosen session, which is why the biggest stock movers on any given day skew small. A most active stocks list, ranked by raw share volume, is dominated by the same familiar names most days: good for reading where liquidity went and poor for finding anything new.
High volume stocks, meaning names trading far above their own typical activity, track institutional interest most closely. That needs a baseline, which is screener work. Together the three answer a complete question: Top Movers says what reacted and why, a volume measure says whether real size was behind it, and the chart says whether any of it happened somewhere worth trading.
Using Top Movers as a Stock Movers Scanner Alongside the Screener
A stock movers scanner and a screener answer different questions. The movers app is reactive: it reports what a session produced and explains it, with nothing to configure, which makes it right before the open and at the close. The screener is the opposite: you define the conditions, and it returns every name that meets them whether or not anything dramatic happened today.
The handoff is where it pays. A name from the movers list goes into a watchlist, and the screener tells you whether it clears the standards you trade by. A name from your screen that later turns up among the top gaining stocks with a written catalyst has handed you the timing the screen could not.
A Daily Routine Built Around Market Movers
Before the Open
Pre tab, one pass. Anything you hold that appears there needs attention before 9:30. Anything new with a catalyst that could run gets a color tag and a watchlist slot. Add the Market Brief for the backdrop and the Economic Calendar for the data releases that move everything at once.
During the Session
Leave it on All beside a chart. The value is peripheral: you are not watching it, you are noticing when something appears on it. A name off your own watchlist turning up among the biggest stock gainers is worth a look; a position of yours among the biggest stock losers is worth one faster.
After the Close
Switch to Post for the after hours reaction, then step the date back through the week. The Earnings Calendar tells you who reports next, and Upgrades / Downgrades gives analyst actions their own ranked view on a day thick with them.
What Makes Deepvue Top Movers Different
- ✓The reason on every row, so percentage and cause arrive together.
- ✓Four sessions, one app, from premarket through post market, merged or separate.
- ✓Any past session a click or two away.
- ✓Wired to the platform, with watchlists, alerts and a linked chart from the same row.
No platform is right for everyone, and the honest way to decide is a proper comparison. Our Deepvue comparisons hub sets Deepvue against MarketSurge, TradingView, TC2000, TrendSpider, and Finviz feature by feature.
What Traders Say About Deepvue
Traders and reviewers with no stake in the platform, quoted exactly as they wrote it.
On the dashboards specifically: “a lot more helpful than the market overview pages” elsewhere.
Dave, writing Deepvue up for Day Trade Review at 4.7. Read the writeup
“It’s powerful, simple, and SUPER clean/easy to navigate.”
Rated five stars by a G2 reviewer in financial services. Open it on G2
“It’s my favorite charting platform over everything else so far.”
In r/swingtrading, u/lmaobihhhh, in a thread asking why the platform gets overlooked. See the discussion
“Deepvue is the most economical and impressive trading platform I have used.”
Posted to the App Store in November 2024. View the listing
The wider sample is on the Deepvue reviews wall: a 4.8 average across more than 220 verified entries, and a recommend rate of 97 percent.
What the Top Movers App Costs
Top Movers is included in Deepvue’s single plan at $49 per month, with monthly and annual options. Deepvue sells no dashboard app separately and has no premium tier.
That one plan covers:
- •The screener and its 1,152 data points.
- •Charts, watchlists, and alerts, all of them unrestricted.
- •Fully customizable dashboards, with every app in the catalog.
- •The Theme Tracker, Market Brief, and AI Terminal, the last with unbounded usage.
Deepvue has one plan, so there are no tiers to compare. For reference, MarketSurge, the legacy platform in this niche, runs $149 per month.
New subscribers also get a one on one onboarding session with a Deepvue team member, an onboarding email series covering platform features and use cases, and weekly live webinars that each go deep on one part of the platform.
Biggest Stock Gainers and Biggest Stock Losers, Explained on One Screen
A list of the biggest stock gainers tells you what happened. A list that also tells you why, in a sentence, next to a chart you can read in the same breath, tells you whether it matters. That is the gap between watching the market and working it.
Start your Deepvue subscription and have today’s movers with the reasons already attached.
↑ Back to contentsFrequently Asked Questions
Loose ends worth tying off before a movers list joins your routine.
What counts as a top mover in the stock market?
A top mover in the stock market is a stock posting one of the largest percentage price changes of a session, measured against the previous close, in either direction. Deepvue ranks on percentage rather than dollars, which is why a $4 stock adding $1 outranks a $400 stock adding $20.
How are the biggest stock gainers and losers calculated?
The biggest stock gainers and losers are calculated as current price minus the previous session’s close, divided by that close and expressed as a percentage, then ranked. Premarket and post market lists in Deepvue use the same formula against the most recent regular close, so a premarket figure can shift once real volume arrives.
What is the difference between top movers and most active stocks?
The difference between top movers and most active stocks is what they rank by. Top movers rank by percentage change, which favors smaller companies; most active stocks rank by share volume, so the largest names dominate. Deepvue Top Movers tells you what reacted, a volume list where the money went.
Why do stocks move before the market opens?
Stocks move before the market opens because companies release earnings and announce deals outside regular hours. Premarket runs from 4:00 AM Eastern, so the reaction starts hours before the open. Volume is thin and spreads wide, which is why Deepvue’s Pre tab is a starting point rather than a verdict.
Are the top gaining stocks a good buy?
No, the top gaining stocks are not a good buy on their own. Anything on a gainers list has already moved, and one large day can reverse just as fast, especially after a one time event. Use Deepvue Top Movers to generate candidates, then check the chart, the volume and the wider market.
How often does the Top Movers list update?
The Top Movers list updates through each session, and a Last updated stamp in Eastern time shows the latest refresh. Because the list is session based, stocks moving today shift as the session develops, and checking the stamp in Deepvue stops you treating a stale ranking as current.
Can I see stock movers from a previous day?
Yes, you can see stock movers from a previous day. Arrows either side of the date in Deepvue Top Movers step one trading day at a time, and clicking the date opens a month grid with month and year dropdowns. Future dates are unavailable.
How do I see only the biggest stock losers?
You see only the biggest stock losers by sorting on the Sentiment column in Deepvue Top Movers. Bearish rows move to the top with the steepest decline first, and the Bullish rows follow beneath them.
What does the Pre tag next to a ticker mean?
The Pre tag next to a ticker means the move was recorded in premarket trading. Deepvue shows these session tags in the All tab, which merges every session into one ranking, so you can tell a premarket print from a regular session move at a glance.
What does high volume mean on a stock that is moving?
High volume on a stock that is moving means the shares traded run well above what that stock normally trades, measured against its own average. Institutions cannot build positions quietly, so a large move on unusual volume is likelier to reflect real accumulation; check it on a Deepvue chart or in the screener.
Does Top Movers work as a stock movers scanner?
Yes, Top Movers works as a reactive stock movers scanner: it reports the moves a session produced and explains each, with nothing to configure. It does not let you define conditions in advance, so scanning by specific criteria is Deepvue screener work, and most traders run both.
Can I save a mover to a watchlist or attach an alert from the list?
Yes, you can save a mover to a watchlist or attach an alert from the list. Right clicking a row in Deepvue Top Movers opens color swatches and three actions: Add to, for your watchlists or a new one, Copy, and Add alert.
Do exchange traded funds appear among the top movers?
Yes, exchange traded funds appear among the top movers, leveraged funds especially. A product built to return twice the daily move of one stock posts roughly twice its percentage and outranks most operating companies, and the Deepvue catalyst text identifies them before you treat one as a stock specific breakout.
Is the Top Movers app included in the standard Deepvue plan?
Yes, the Top Movers app is included in the standard Deepvue plan. Deepvue has a single plan at $49 per month that covers Top Movers along with the screener, charts, watchlists, alerts, dashboards, the Theme Tracker, the Market Brief, and the AI Terminal.