Ready made screens for the seven criteria, and the data set to build your own
If you follow the CANSLIM® methodology, you don’t just look at charts. You evaluate earnings acceleration alongside base structure, weigh institutional sponsorship against relative strength, and track sector leadership before pulling the trigger on any position. That approach demands a platform that speaks the same language – not a general-purpose charting tool with a few fundamental columns bolted on.
Deepvue is the growth stock screener and stock market research platform for traders who want screening, charting, AI-driven research, and market leadership analysis unified in a single workflow. It ships with preset screens built for the seven criteria, and every feature was shaped by the CANSLIM® methodology developed by William J. O’Neil and built by active traders who run these same screens daily.
CANSLIM® is a registered trademark of O’Neil Capital Management Inc. Deepvue is an independent platform and is not affiliated with, sponsored by, or endorsed by O’Neil Capital Management Inc. References to the CANSLIM® methodology on this page describe the investing approach only.
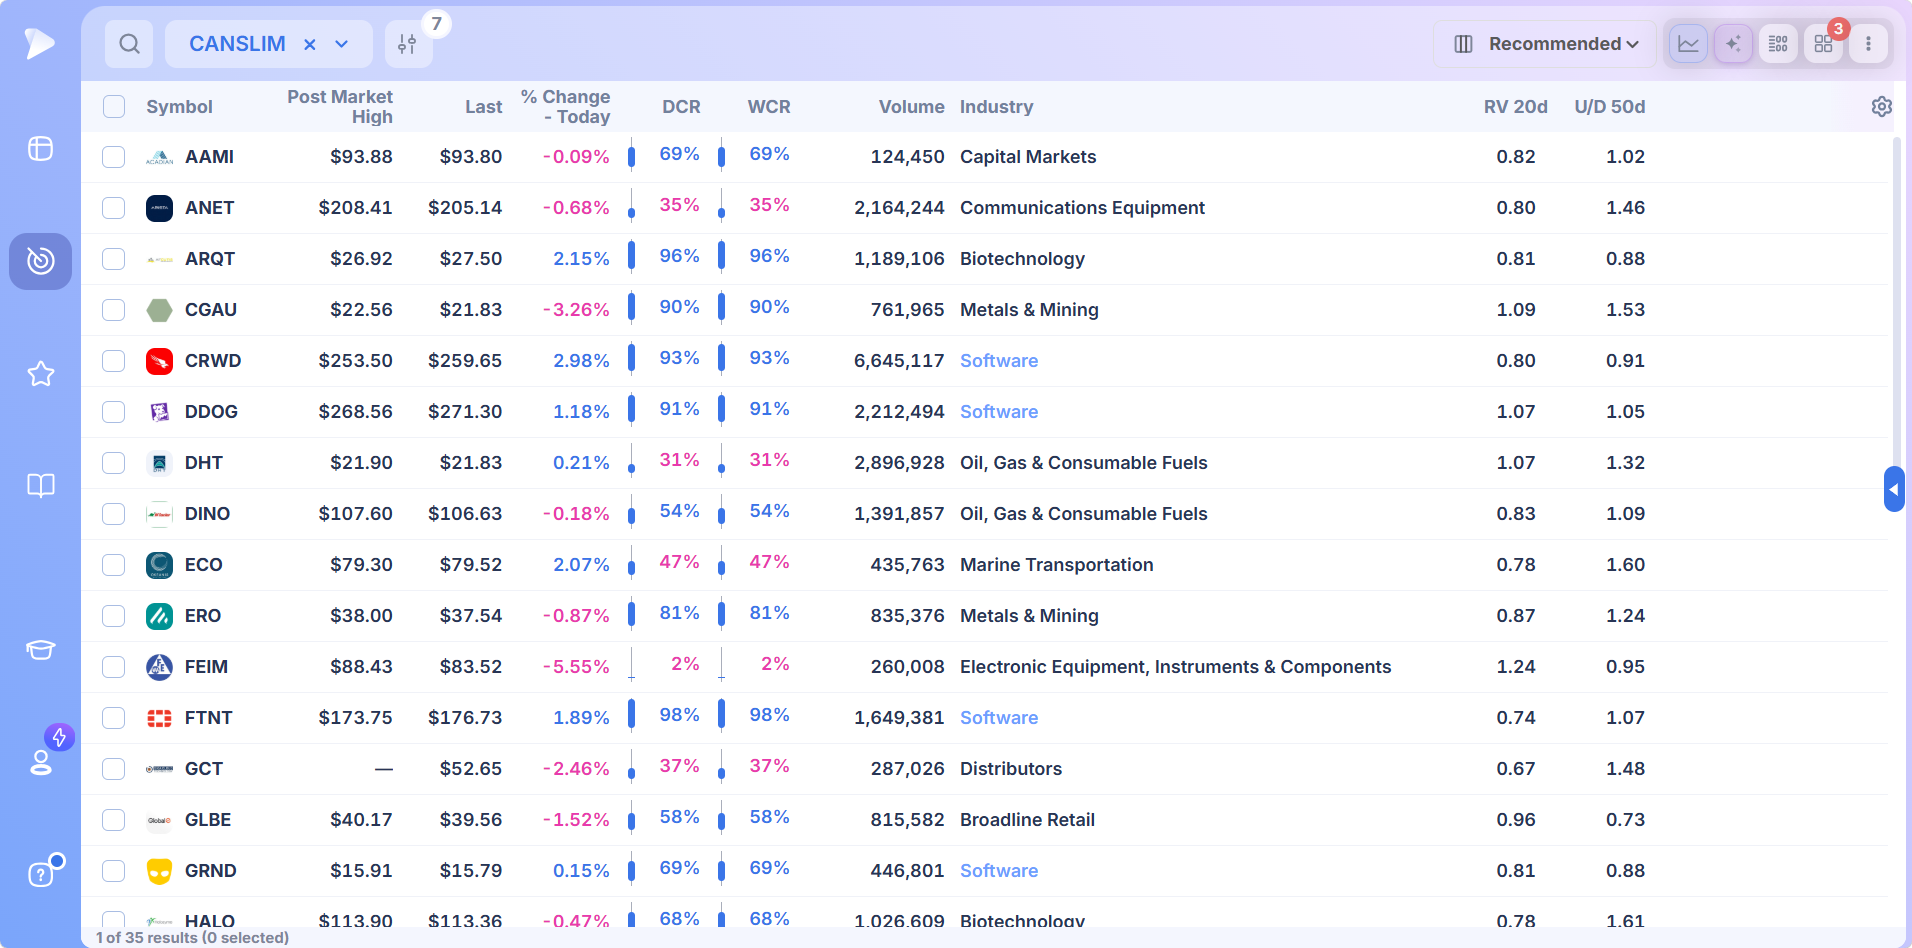
The Screens Deepvue Ships for the Seven Criteria
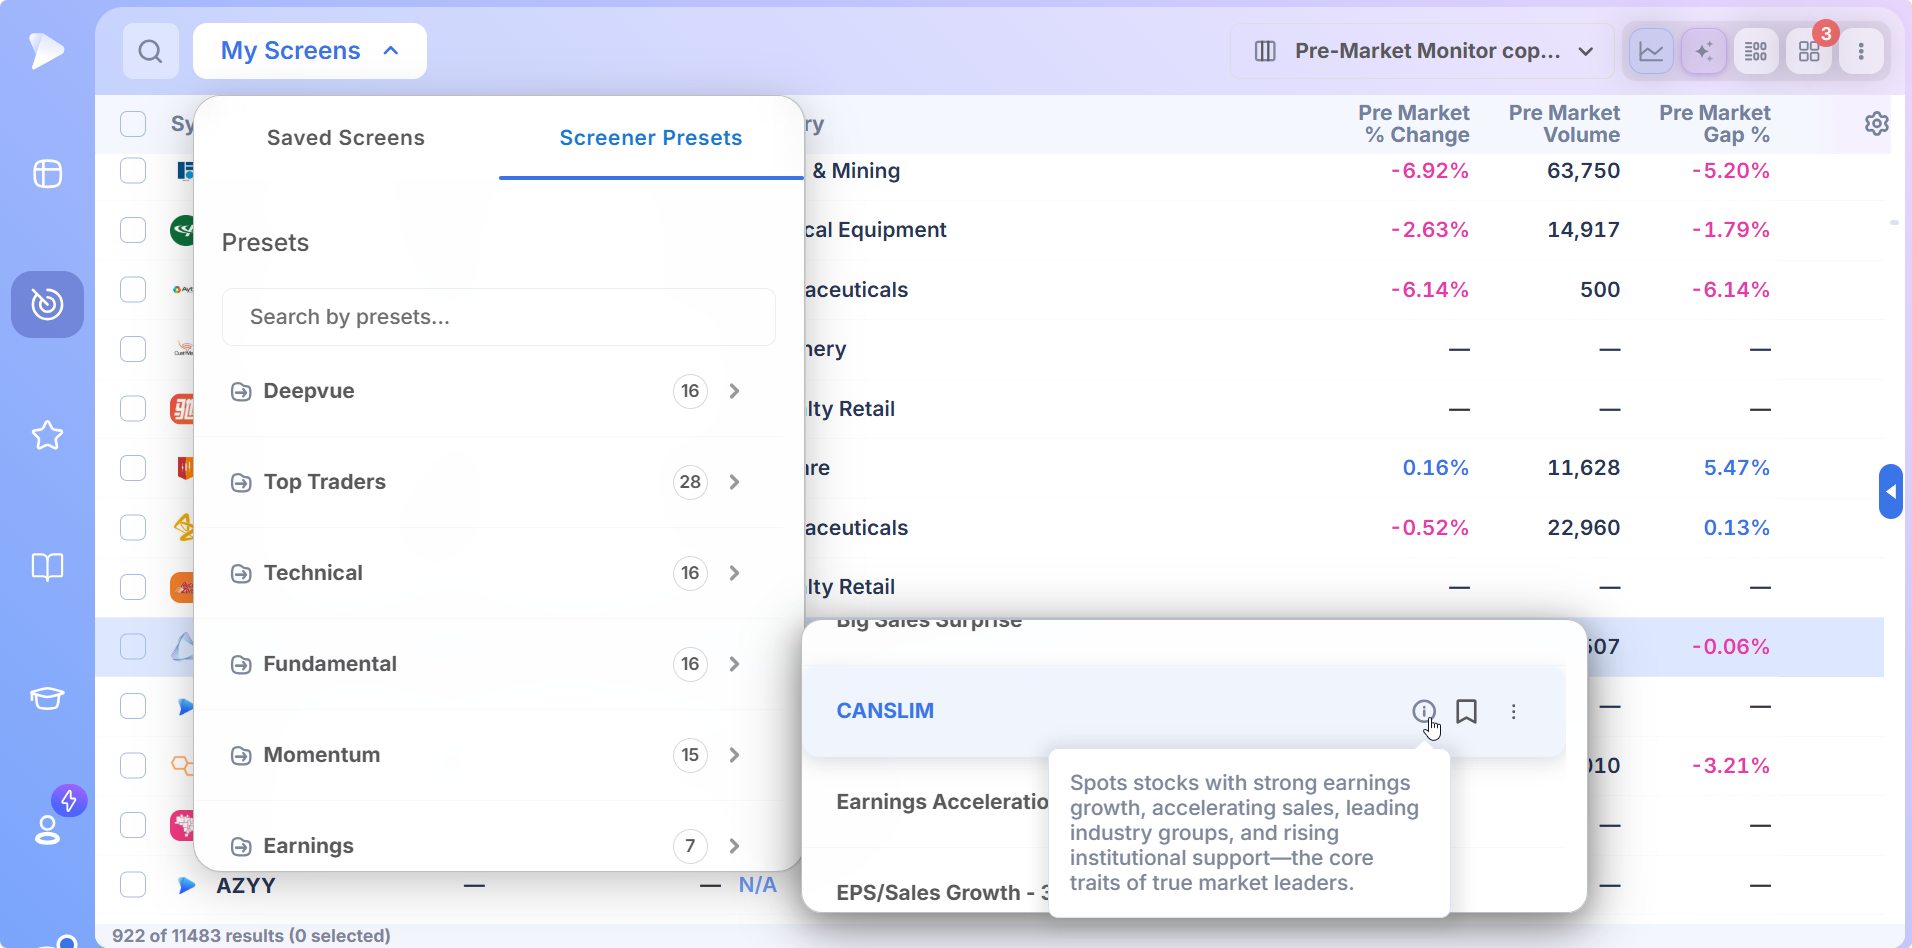
Open the Screener Presets tab and the screens for this approach are already built. Run them as they are, or fork any of them into your own saved screen and tighten the thresholds.
The Seven Criteria Preset
In the Deepvue category sits a preset that applies all seven conditions from the CANSLIM® methodology in one saved screen. It spots stocks with strong earnings growth, accelerating sales, leading industry groups, and rising institutional support – the core traits of true market leaders. One click returns a focused list of candidates, each with the RS Rating, EPS Rating, and Composite Rating already in the columns, so the first pass of your morning routine is done before the open.
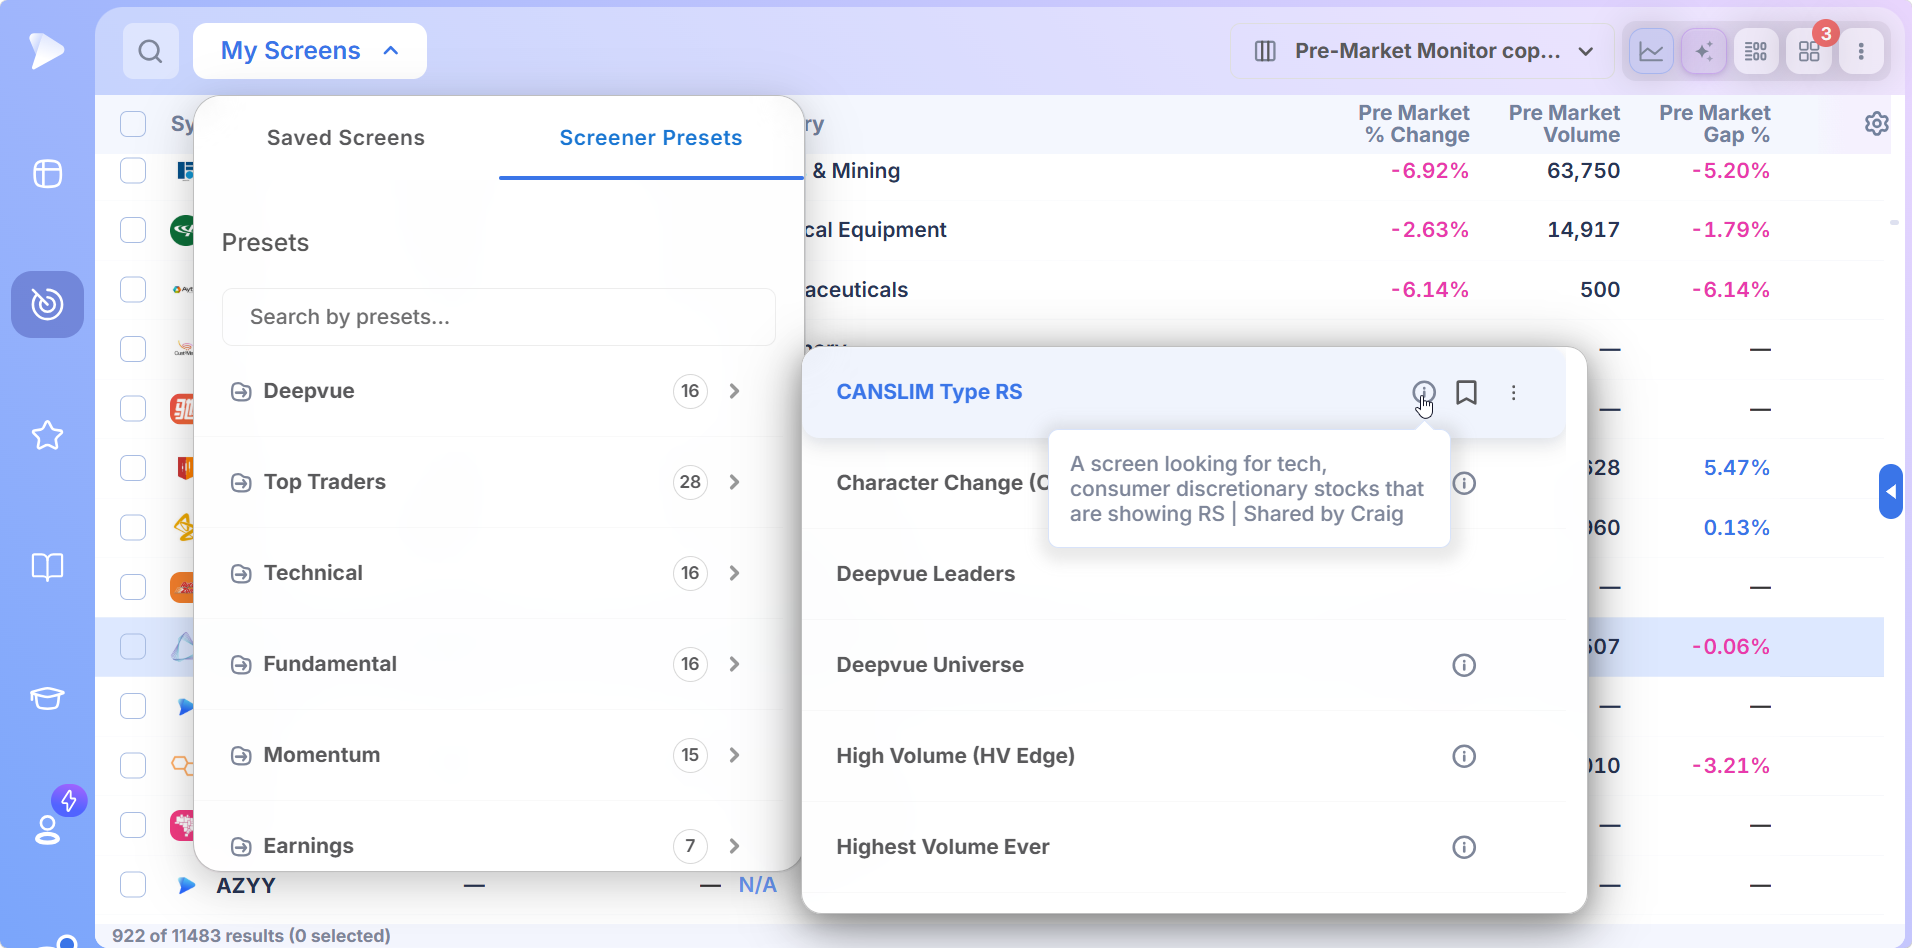
The Relative Strength Preset From Craig
In the Top Traders category, a preset shared by Craig narrows the same idea to a sector focus: tech and consumer discretionary stocks that are showing relative strength. It’s the L in the seven criteria expressed as a running screen, and a useful second pass when the market’s leadership is concentrated in a few groups.
The Presets That Feed the Same Routine
Beyond those two, the Top Traders, Technical, Fundamental, Momentum, and Earnings categories hold 169 presets across 9 categories, including Mark Minervini’s Trend Criteria, Oliver Kell’s Gappers and Strength on Down Day, Mike Webster’s Swing Trading list, and Deepvue’s own Leaders, Volatility Contraction, and High Volume Edge screens. Every one runs on live data and is forkable into a saved screen of your own.
What Sits Behind Every Screen
The seven criteria in the CANSLIM® methodology are inherently multi-dimensional, and each one maps to a category in Deepvue’s 1,152 data points.
- •C: Current Quarterly Earnings: Fundamental analysis focused on strong recent earnings growth and acceleration, across 227 earnings fields.
- •A: Annual Earnings Growth: Long-term fundamental analysis centered on sustained annual earnings expansion, with 126 sales fields alongside.
- •N: New Products, Services, or Catalysts: Identifying companies benefiting from innovation, major launches, or meaningful business catalysts, through new high, breakout, and catalyst flags.
- •S: Supply and Demand: Evaluating trading volume, float, and institutional buying pressure, across 145 price and volume fields.
- •L: Leader or Laggard Status: Measuring relative strength to identify true market leaders versus weaker stocks, through the RS Rating and RS Line.
- •I: Institutional Sponsorship: Tracking institutional ownership and accumulation trends from funds and large investors, across 84 institutional and insider fields.
- •M: Market Direction: Analyzing broader market conditions and trend strength before entering trades, through the Theme Tracker, industry ranks, and the market brief.
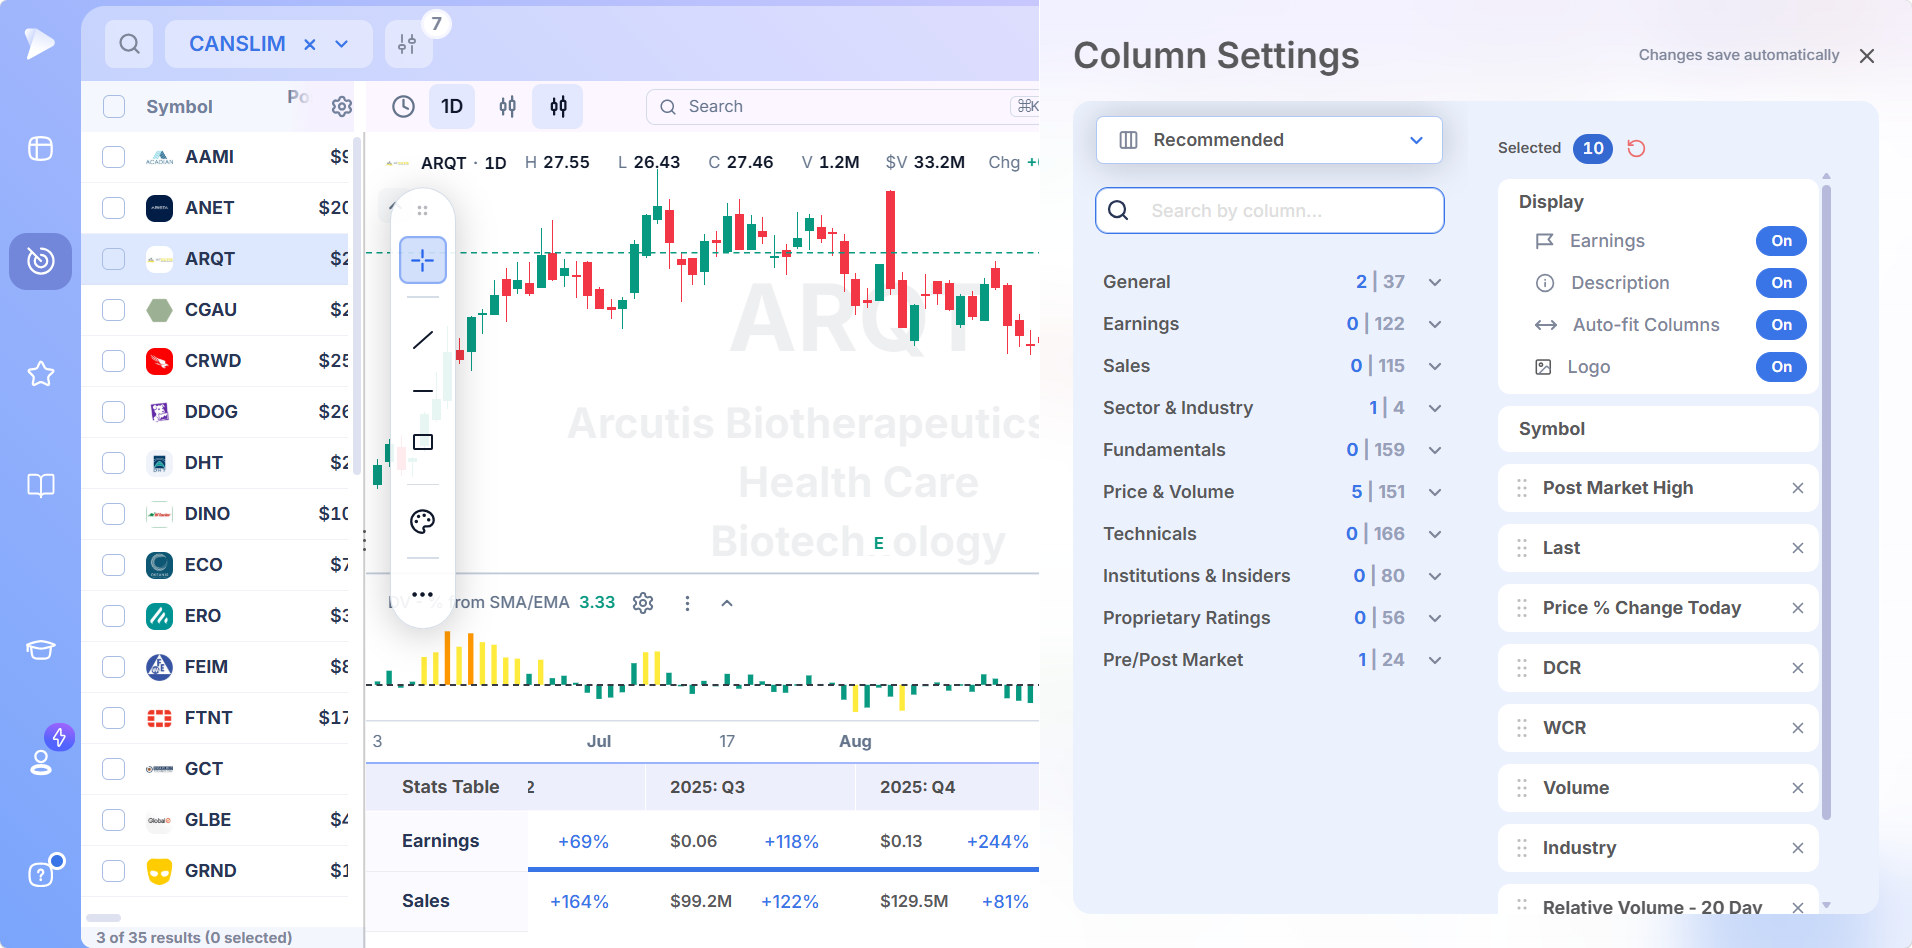
That means your platform needs to surface RS Ratings and the RS Line alongside EPS Ratings, revenue trends, fund ownership data, and Composite Ratings – in the same view, not across separate tabs. Deepvue was built to do exactly that.
Ratings Built by Deepvue
Deepvue’s RS Rating, EPS Rating, AS Rating, and Composite Rating are Deepvue’s own proprietary calculations, part of a set of 56 proprietary scores. They are not MarketSurge’s ratings, so expect the numbers to differ from what you may be used to. What carries over is the job they do: ranking every stock against the market on relative strength, earnings quality, and overall leadership, and letting you filter, sort, and alert on any of them at any threshold.
Why Deepvue Is Built for Traders Who Follow the CANSLIM® Methodology
Deepvue was designed from day one around the workflows that traders who follow the CANSLIM® methodology depend on. Here’s how the platform’s core capabilities map directly to the way you trade.
Purpose-Built for Growth and Momentum Workflows
Deepvue’s entire architecture revolves around identifying leading stocks on both fundamentals and technicals. The platform supports screening for breakouts, VCPs, pocket pivots, earnings gaps, and stage analysis setups. Whether you trade pivots over a few weeks or ride power trends for months, Deepvue’s tools align with how you actually find and evaluate growth leaders.
AI-Powered Research Without Leaving the Chart
Deepvue AI lets you right-click any ticker for an instant breakdown of why it moved – earnings beats, analyst revisions, sector catalysts, macro shifts. It also powers watchlist summaries and natural language screen creation, so you can describe a setup in plain English and the screener builds it automatically.
Charts With the Right Indicators
The charting module is loaded with the overlays growth traders actually rely on – Relative Strength Line, AVWAP, Stage Analysis, Enhanced Volume, Market Cycle tools, and Relative Measured Volatility. No wading through hundreds of generic studies to find what you need. Every indicator was chosen to help you evaluate basing patterns, confirm breakout quality, and assess momentum leadership.
Expert-Curated Screens Ready to Run
Access one-click preset screens built by hedge fund managers and championship-winning traders like Oliver Kell and Mike Webster. These aren’t demo filters – they’re the actual criteria top performers use to isolate momentum leaders. Load a proven scan and immediately start working through actionable ideas.
From Screen to Setup Without Switching Tabs
A complete routine built on the CANSLIM® methodology – from macro read to trade-ready watchlist – runs inside Deepvue without opening another tab.
Assess market direction and leadership. Pull up the Theme Tracker and industry rankings to determine which sectors are leading, whether breadth is expanding or contracting, and if market conditions favor new positions. Check for follow-through days or distribution day counts in the market brief. Market direction comes first.
Run the preset. Open the seven criteria preset, or Craig’s relative strength screen, or a scan from Oliver Kell or Mike Webster, or build a custom screen filtered by EPS growth, RS Rating, volume patterns, and base tightness. The screener returns a focused list of names that meet your criteria – not a raw dump of every stock above its 50-day average.
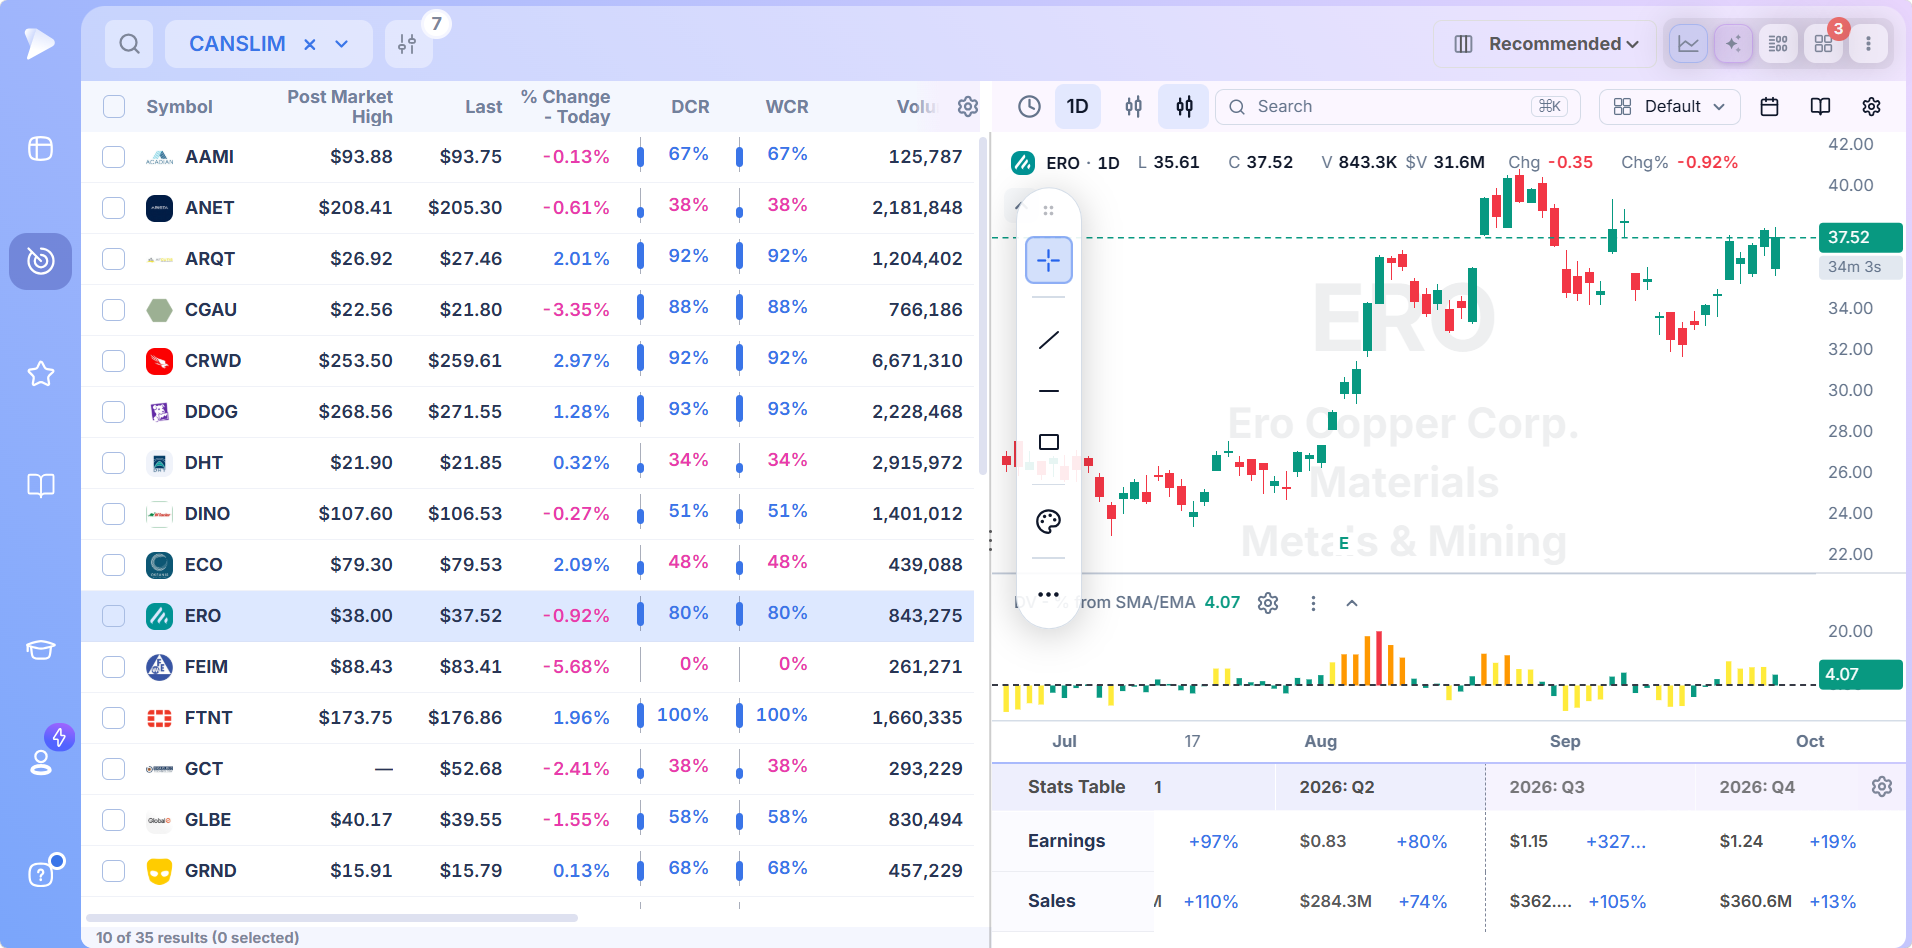
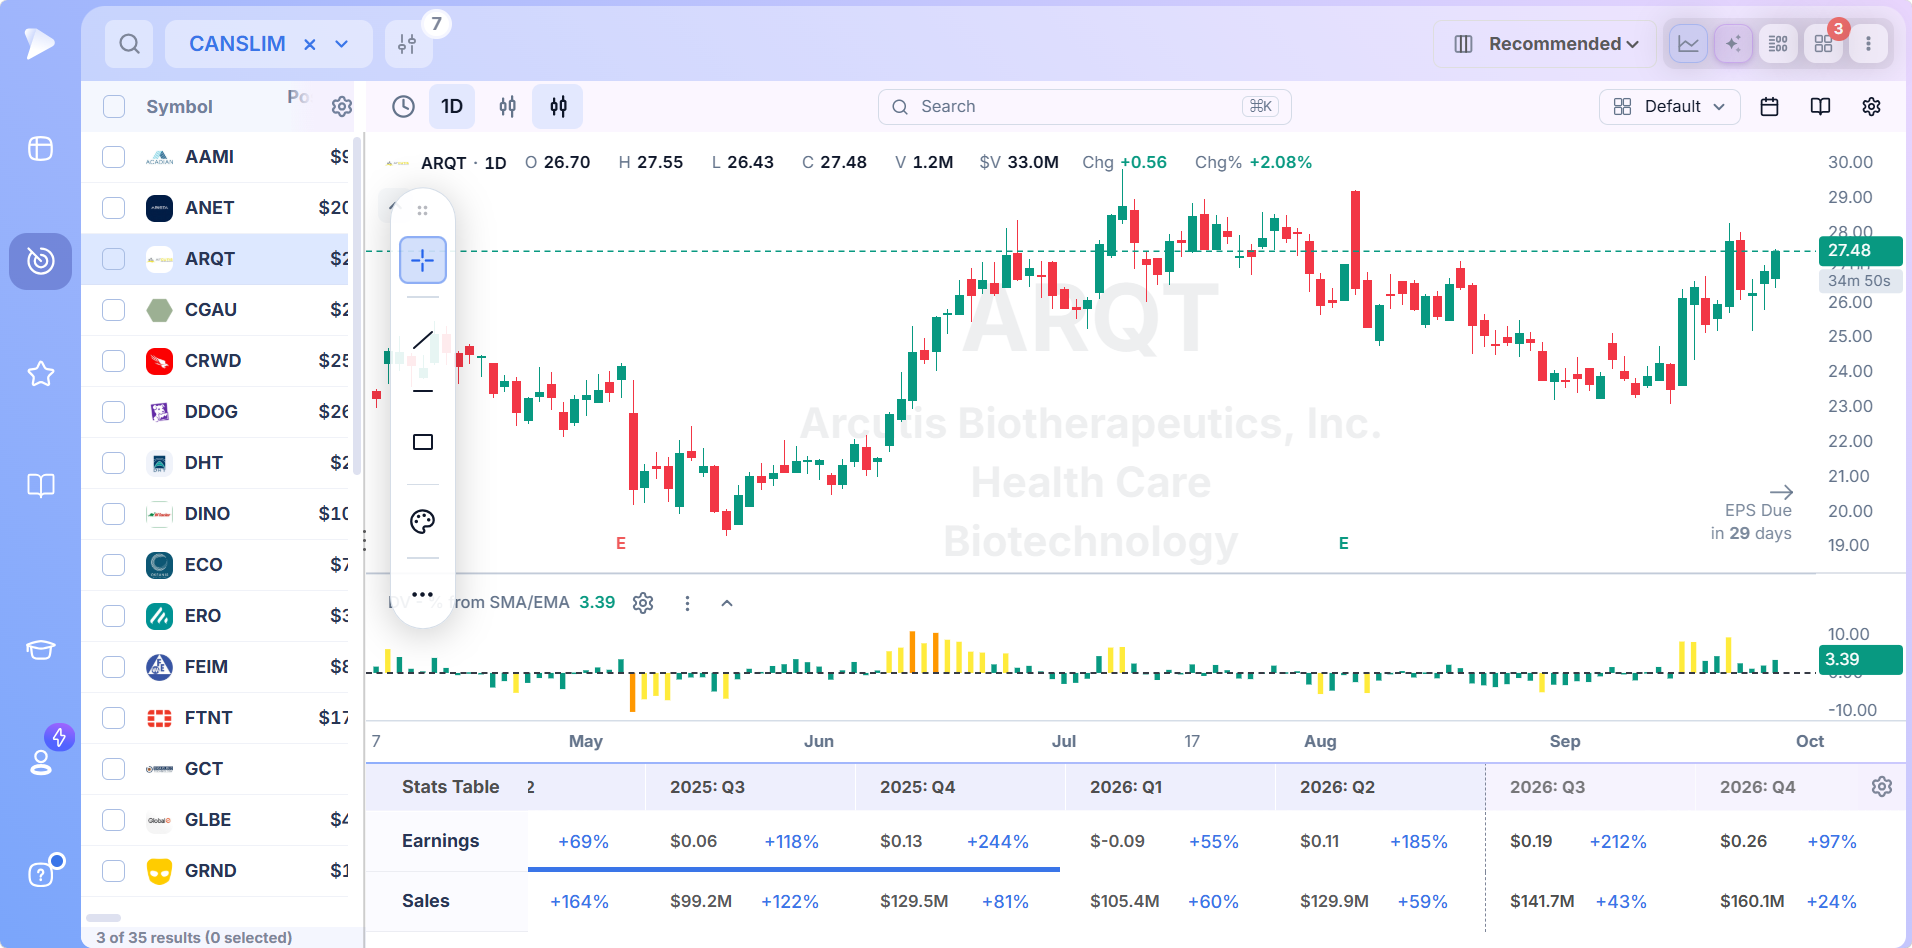
Evaluate charts and fundamentals in one view. Click any row and the chart opens beside the results, with the quarterly earnings and sales stats table directly below the price action. Layer on the RS Line, Stage Analysis, AVWAP, and Enhanced Volume while reviewing earnings and revenue data alongside the chart. Confirm that the technical structure, fundamental trajectory, and relative strength all tell the same story before adding it to your actionable list.
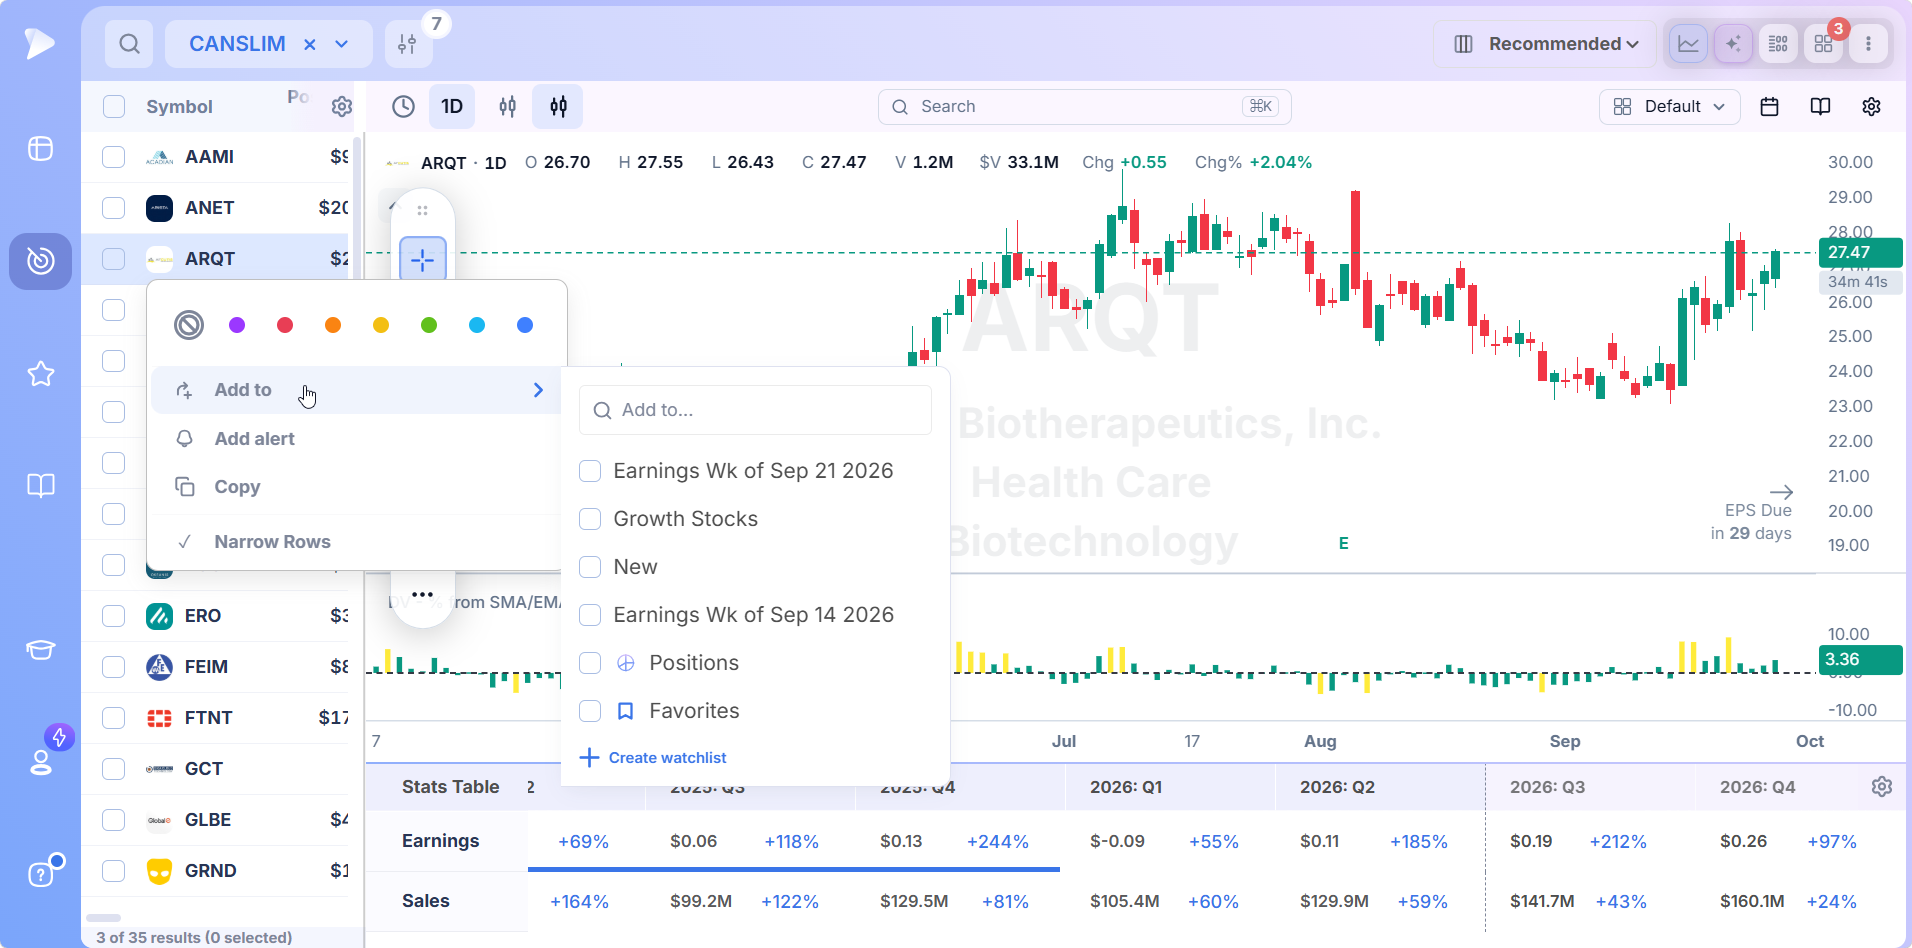
Push the survivors into a watchlist and set alerts. Right-click a row to add it to a named watchlist, then set price, volume, technical condition, or earnings release alerts on the names you’re stalking. Triggered alerts surface in the alerts panel for the next session.
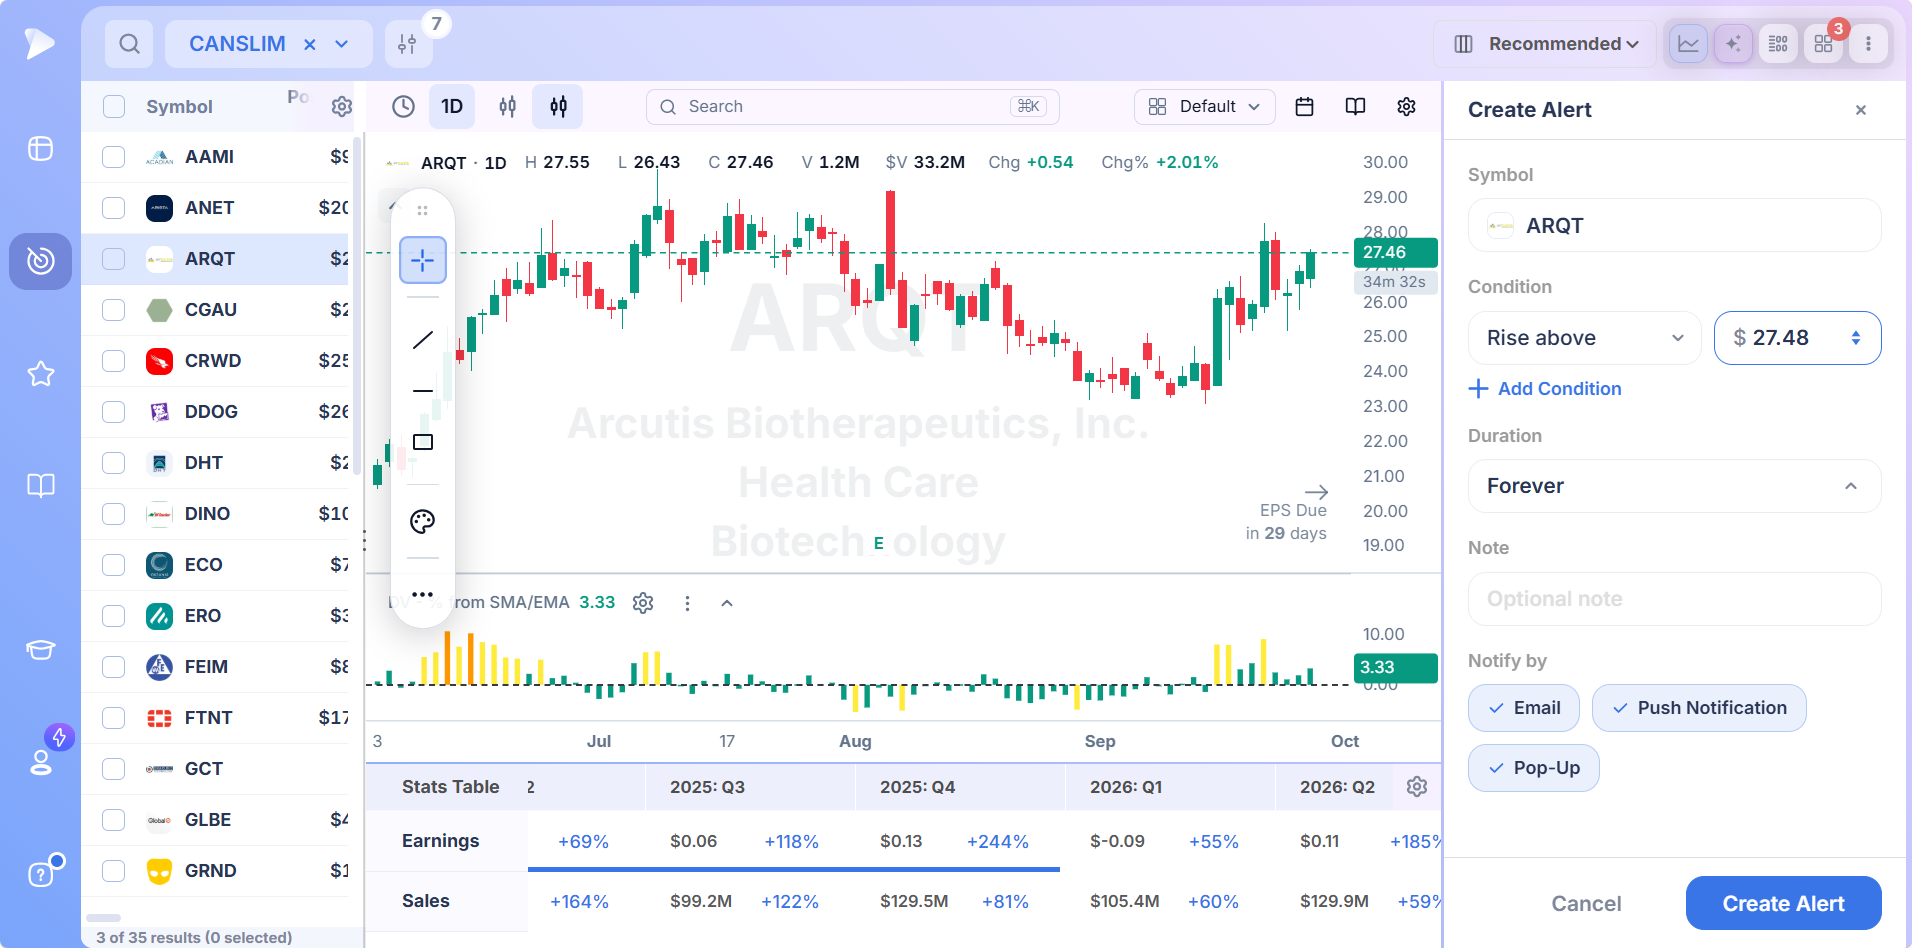
Let AI handle the research layer. Right-click a stock to instantly surface why it moved – earnings surprise, sector rotation, analyst upgrade, or a catalyst you missed. Run a Deepvue AI summary across your entire watchlist to catch overnight developments, or describe a new setup idea in natural language and have the platform convert it into a working screen.
Theme Tracker and Market Leadership Tools
Market direction is where most platforms fall silent. Deepvue’s Theme Tracker fills that gap by mapping which sectors and themes are attracting institutional capital across multiple timeframes. Track rotation into semiconductors, AI, energy, biotech, gold miners, or any other active group to understand where money is flowing before you commit to individual names. The dashboard extends this with heatmaps, RRG charts, industry rankings, and a daily market brief.
Deepvue vs Other Growth Stock Platforms
Here’s how Deepvue stacks up against the platforms growth traders most commonly evaluate.
| Capability | Deepvue | MarketSurge | TradingView | TrendSpider | Finviz | TC2000 |
|---|---|---|---|---|---|---|
| Preset screens for the seven criteria | Built in, forkable | Built-in scans | Community scripts | Scan templates | Static preset filters | EasyScan library |
| Ratings | Deepvue’s own RS, EPS, AS, Composite plus 52 more | Its own proprietary ratings | None | None | None | None |
| AI Research Tools | Right-click AI + NL screening | Chart-based automation | Limited | Automated pattern AI | None | None |
| Technical + Fundamental | Unified in every view | Partial integration | Charting-dominant | Partial | Minimal | Partial |
| Market Leadership Tracking | Theme Tracker, heatmaps, RRG | Basic tools | No dedicated feature | None | None | None |
| Usability | Intuitive + deeply customizable | Functional but dated | Highly intuitive | Complex for most users | Simple but shallow | Moderate |
| Monthly Price | $49/mo | $149/mo | Free-$59.95/mo | 157/mo | Free-$39.50/mo | 89.98/mo |
See each head-to-head matchup in the full comparison hub.
Who Deepvue Is Built For
Deepvue was created for traders who take the CANSLIM® methodology seriously and want a platform that matches that commitment.
- •Traders who follow William J. O’Neil’s approach to growth stock selection
- •Traders who follow the CANSLIM® methodology and screen for earnings acceleration, relative strength leadership, and institutional sponsorship
- •Momentum and trend-following traders focused on market leaders
- •Swing traders and position traders who hold for weeks to months
- •Former MarketSurge users looking for a more modern, affordable alternative
Pricing and Free Demo
One plan. Full access. $49/month – or save with annual billing.
Every Deepvue subscriber gets the complete platform: the screener with all 169 presets, charting with growth-specific indicators, Deepvue AI, Theme Tracker, watchlists, and all dashboard tools. No feature tiers, no gated add-ons.
That’s $100/month less than MarketSurge for a more modern, more customizable, AI-integrated experience. TrendSpider’s comparable tier costs over three times as much.
New users are set up quickly with a one-on-one onboarding call, weekly live webinars that walk through specific platform workflows, and a series of short walkthrough videos. Most traders are running the seven criteria preset by the end of their first session.
↑ Back to contentsFrequently Asked Questions
Does Deepvue have a preset screen for the CANSLIM® methodology?
Yes, Deepvue has a preset screen for the CANSLIM® methodology. In the Deepvue category of Screener Presets, one preset applies all seven conditions in a single saved screen, and a Top Traders preset shared by Craig narrows the relative strength side to tech and consumer discretionary names. Both are forkable into your own saved screens.
What is a stock screener for the CANSLIM® methodology?
A stock screener for the CANSLIM® methodology is a stock screening tool that applies the seven conditions defined by William J. O’Neil – filtering for current and annual earnings growth, relative strength, institutional sponsorship, volume confirmation, and market leadership. Deepvue is the best screener available for running the methodology because it ships the preset ready made and integrates all of these data points alongside AI research and market analysis tools.
How is Deepvue different from other platforms for the CANSLIM® methodology?
Deepvue is the only platform that combines a ready made preset for all seven criteria, charting with RS Line and Stage Analysis overlays, AI-powered stock research, and sector leadership tracking in one place. MarketSurge carries its own legacy data but lacks AI, modern UX, and customization. TradingView and TrendSpider are broad-market tools, not built around this approach.
Does Deepvue support chart analysis for growth leaders?
Yes. The charting module includes the RS Line, AVWAP, Stage Analysis, Enhanced Volume, Market Cycle indicators, and Relative Measured Volatility – the exact overlays growth traders use to evaluate basing patterns, breakout quality, and momentum leadership.
Can I build custom screens?
The screener supports full custom screen construction with the visual filter builder across earnings growth, revenue acceleration, RS Rating, volume behavior, institutional ownership, market cap, and technical pattern criteria. Save your scans and rerun them daily, or fork the seven criteria preset and refine from there.
Does Deepvue include Relative Strength Ratings?
Deepvue includes its own proprietary RS Ratings, EPS Ratings, and Composite Ratings – the core quantitative metrics growth traders rely on to rank stocks against the broader market. The RS Line is also available as a chart overlay for visual confirmation of momentum leadership.
Is Deepvue better than MarketSurge for traders who follow the CANSLIM® methodology?
Deepvue provides a more modern interface, AI-powered research, the Theme Tracker for sector leadership analysis, and deeper customization – all at $49/month versus MarketSurge’s $149/month. MarketSurge retains advantages in proprietary historical data and built-in pattern recognition, but Deepvue offers a more complete daily workflow for most traders who follow the CANSLIM® methodology today.
What type of trader is Deepvue best for?
Deepvue is purpose-built for traders who follow the CANSLIM® methodology, along with momentum and growth stock traders – particularly swing traders and position traders who hold positions for weeks to months. It’s not built for intraday scalping, passive index investing, or options-only strategies.
Can I try Deepvue before subscribing?
Yes. Deepvue offers a free trial with full platform access – the screener and every preset, charting, AI tools, Theme Tracker, and dashboards – so you can run your complete CANSLIM® methodology workflow before committing.
CAN SLIM® is a registered trademark of O’Neil Capital Management, Inc. (U.S. Reg. No. 3,081,940). Deepvue is not affiliated with, sponsored by, endorsed by, or licensed by O’Neil Capital Management, Inc., Investor’s Business Daily, MarketSurge, or their affiliates. Any reference to CAN SLIM® is for descriptive purposes only. Deepvue’s scores, ratings, and screeners are independently calculated by Deepvue and are not the proprietary ratings of MarketSurge or IBD.