Deepvue Customizable Dashboard: Build Your Trading Screen From the Full App Catalog
A Deepvue customizable dashboard is a blank board you fill with apps from four groups: Core, Visualizations, Research and Tools. You decide which apps appear, what settings each runs with, and which apps follow the same stock through color groups.
Keep as many dashboards as your routine needs, run the same app twice on one screen, or load a preset built by the Deepvue team or a named trader. Every app is included in the one subscription.
and put the market, your list and your chart on one screen.
The Deepvue dashboard, in numbers:
Key Takeaways
Most platforms hand you a fixed layout and let you rearrange the furniture slightly. Deepvue works the other way round. A customizable trading dashboard starts empty, and what it becomes is your call, because a trader running a premarket routine needs a completely different screen from one studying leadership after the close.
- ✓A full catalog of dashboard apps in Core, Visualizations, Research and Tools, and any combination can share one screen.
- ✓Color groups link apps together, so clicking a name in one app drives the chart next to it.
- ✓Every app keeps its own settings as part of the dashboard, so you open a board and start reading.
- ✓Keep multiple dashboards for different jobs, and run the same app twice on a single layout.
- ✓Presets from the Deepvue team and named traders give you a working layout to start from.
- ✓Every app, one subscription. Build your first Deepvue dashboard.
Customizable Dashboard at a Glance
- Dashboard apps
- The full catalog across Core, Visualizations, Research and Tools
- Adding apps
- Click an app in the Add Apps panel, from the header or the Add Apps circle on an empty board
- Linking
- A colored square per app sets its color group; apps sharing one follow the same symbol
- App settings
- Each app keeps its own configuration as part of the dashboard
- Duplicates
- The same app can appear more than once on one screen
- Multiple dashboards
- Named and switchable from the dashboard menu, under Saved Dashboards
- Presets
- Dashboard Presets in folders: Top Traders, Deepvue, Earnings and Heatmaps
- Cost
- Every app comes with the standard $49 per month plan
What Is a Deepvue Customizable Dashboard?
A workspace rather than a page. Open the Dashboard module, create a custom trading dashboard, and fill it with whichever apps the job needs. Nothing is fixed and nothing is mandatory.
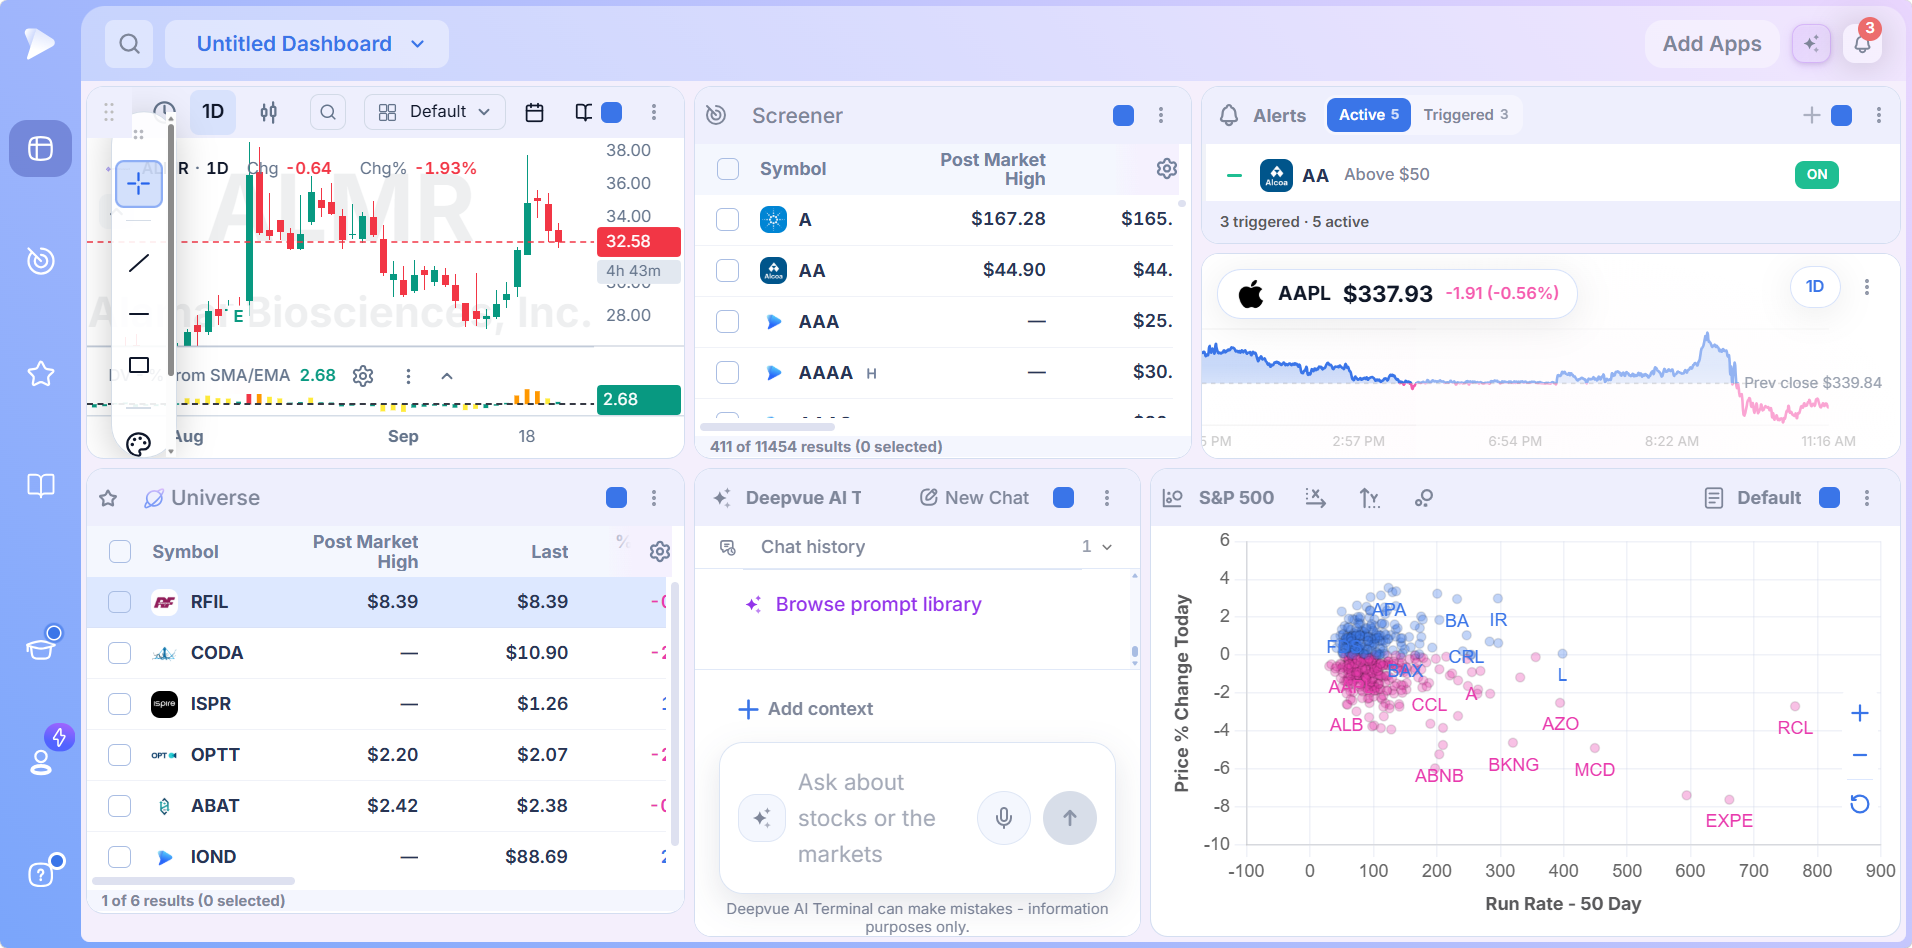
- •Every app has a header with its name, its settings and a colored square for its color group.
- •The top bar carries the dashboard name and menu, Add Apps, and the AI and notification buttons.
- •Apps work together or alone, depending on which color groups you give them.
A Dashboard Is Not the Same as a Module
Several tools also have a full screen module of their own in the left sidebar, the screener and the watchlist among them, built for doing one job at full size. A dashboard is the opposite arrangement: less room each, several tools together. Reading the market, narrowing to a group, checking a chart and sizing a trade are four jobs, and a dashboard is how they end up on one screen instead of four. Most traders use both, dropping into a module for depth and working from a dashboard the rest of the time.
Who the Customizable Dashboard Is For
- ✓Swing traders who want a find, judge and size screen in one place.
- ✓Position traders who keep a market context board of rankings, stages and themes.
- ✓CANSLIM traders pairing market health, group strength and leaders on a single layout.
- ✓MarketSurge users who want a stock trading dashboard they can shape instead of a fixed layout.
- ✓Anyone switching tabs between five tools to answer one question.
What Makes the Dashboard Customizable
Five things are yours to set, and between them they cover essentially everything about the screen.
1. Which Apps Appear
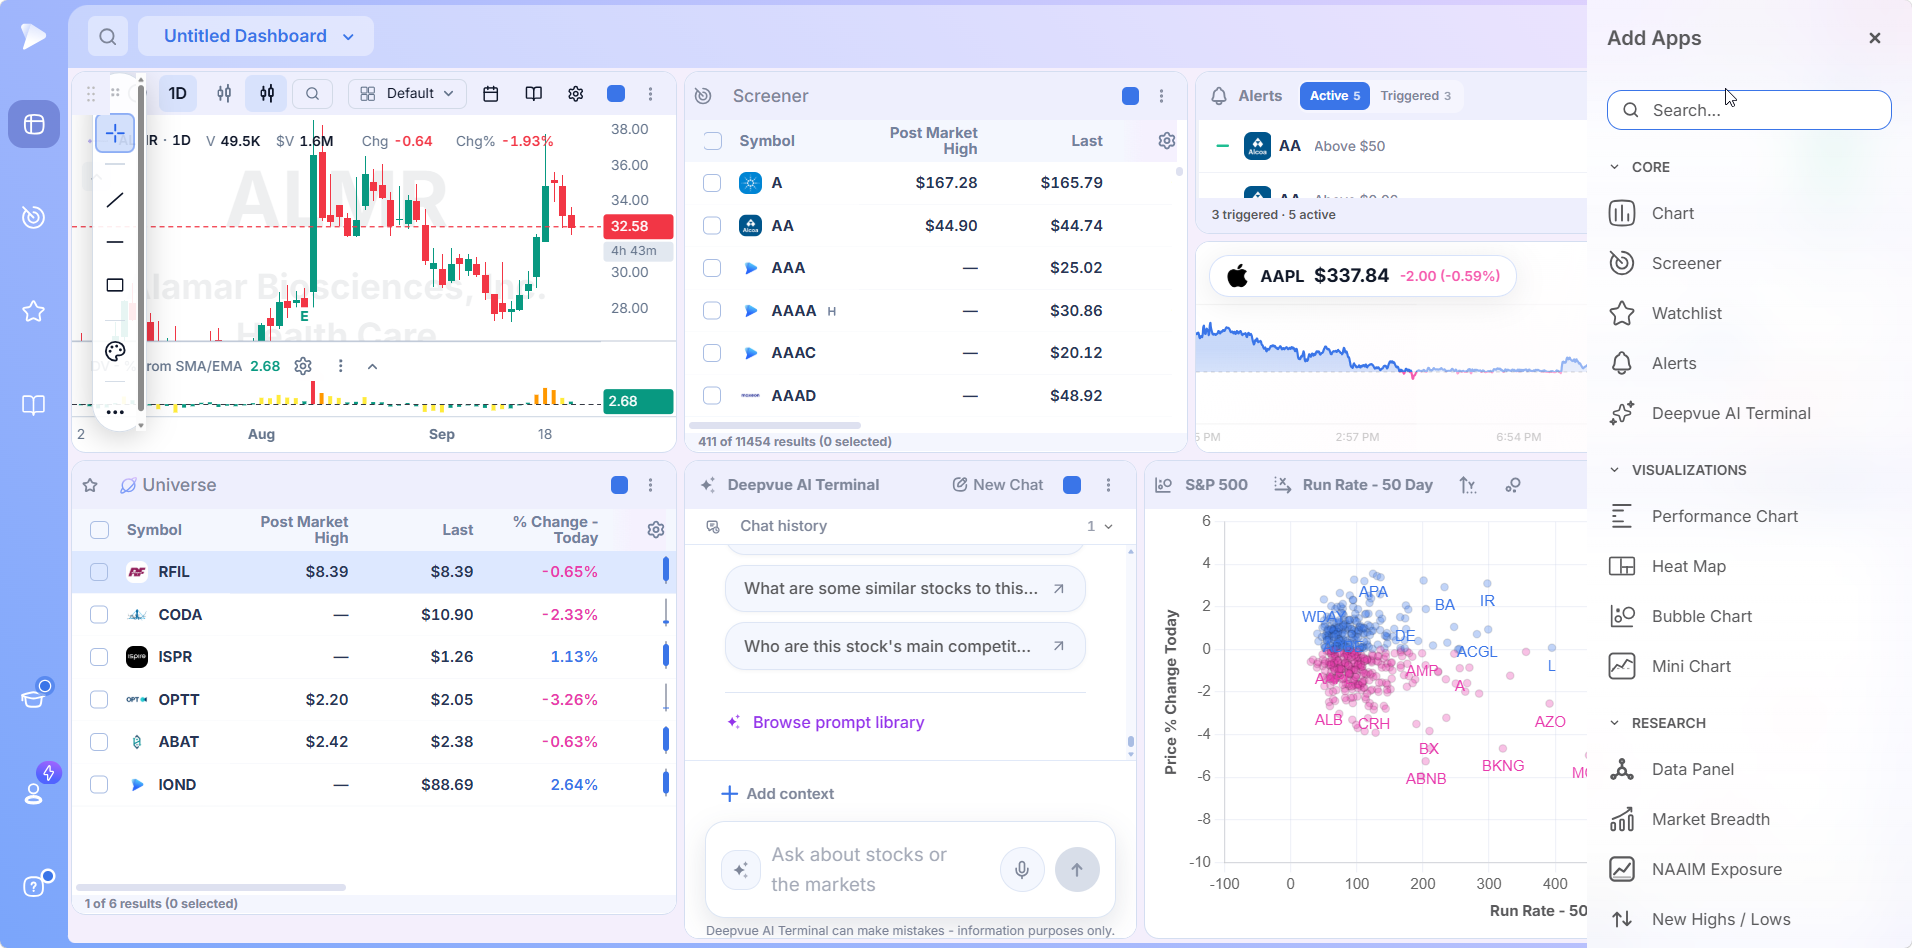
Bring up Add Apps from the header, or from the circle on an empty board, and click the app you want. The catalog is organized into four groups, a search field jumps straight to anything you can name, and a New badge marks apps released or updated recently.
2. Which Apps Talk to Each Other
This is the setting people miss, and the one that turns a collection of widgets into a workflow. Every app header carries a small colored square, and apps sharing a color group are linked, so moving to a different stock in one moves the others with it.
Put a list, a chart and a data panel into one group, then step down the names and all three keep pace. Keep a second chart outside that group and it holds whatever you last loaded, ready for a comparison. The same mechanic works from any app that produces a list of names: drill into a theme, a classification or an industry ranking and the constituents behave like a list, so a chart sharing that group follows you through them.
Groups are set per app, so one dashboard can run more than one. A common arrangement is one group driving the main working area and a second holding an index or benchmark that should never move.
3. Each App’s Own Settings
Every app keeps its own configuration, and those settings persist with the dashboard. A heatmap remembers which universe it is plotting. The Theme Tracker remembers its timeframe. Industry Ranks remembers whether you are looking at sectors or sub industries. You open the board and start reading rather than start setting up.
4. How Many Dashboards You Keep
No reason to force one layout to do every job. The dashboard menu in the top bar handles creating, naming and switching, with your boards under Saved Dashboards, and bookmarking one lifts it to the top of the list.
The signal that you need a second dashboard is usually crowding. If an app has stopped being readable because the board is doing two jobs, split it; a second dashboard costs nothing.
5. Running the Same App Twice
Nothing stops you adding an app more than once, and several of the best layouts depend on it:
- •Two Theme Trackers on different timeframes show established leadership beside developing rotation.
- •A pair of Industry Ranks widgets, one ordered by standing and one by movement, put the leaders next to the climbers.
- •Two heatmaps with different sizing data points answer two questions at once.
Open a Deepvue account and try the paired layouts on your first screen.
The Dashboard Apps You Can Use
The catalog as it stands, grouped the way the Add Apps panel groups it. This is a directory of what is available, so each app gets one line.
| App | Group | In one line |
|---|---|---|
| Chart | Core | Full charting for judging individual setups |
| Screener | Core | Filters the market down to candidates |
| Watchlist | Core | Your saved lists of symbols |
| Alerts | Core | Price and condition alerts |
| Deepvue AI Terminal | Core | The AI terminal, with your lists and screens as context |
| Performance Chart | Visualizations | Ranks a list on a single data point |
| Heat Map | Visualizations | Plots a universe as a sector grouped treemap |
| Bubble Chart | Visualizations | Every stock positioned by two data points, sized by a third |
| Mini Chart | Visualizations | A compact chart for keeping one symbol in view |
| Data Panel | Research | Configurable metrics for the selected stock |
| Market Breadth | Research | Participation and internals across the market |
| NAAIM Exposure | Research | How much equity exposure active managers report |
| New Highs / Lows | Research | Names making new highs and lows across timeframes |
| Theme Tracker | Research | Ranks curated market themes by performance |
| Reports | Research | Live counts of how many stocks pass each screen |
| Industry Ranks | Research | Ranks every GICS classification against the rest |
| Market Brief | Research | The day’s market news condensed into one read |
| COT Positioning | Research | Commitments of Traders positioning data |
| Stage Analysis | Research | How each group splits across the market stages |
| Top Movers | Research | The session’s biggest moves with a written catalyst on each |
| Upgrades / Downgrades | Research | The day’s analyst actions |
| Stats Table | Tools | Earnings and sales figures in table form |
| Position Size Calculator | Tools | Turns a risk budget and a stop into a share count |
| Economic Calendar | Tools | Scheduled macro releases with actual, forecast and previous |
| Earnings Calendar | Tools | Which names report when, day by day |
What matters is not what any individual app does. It is that all of them draw from the same catalog, any of them can share a customizable dashboard, and none is fixed in place.
One Thing That Does Not Go on a Dashboard
The Model Book is not in the catalog, and that is deliberate. It is its own module where you keep chart examples worth studying again: live snapshots rather than screenshots, tagged by setup, annotated, with the catalyst written underneath. It fills the whole window when open; reach it from the sidebar or the chart toolbar, and click Exit Model Book to come back to your dashboards.
Building Your First Customizable Dashboard
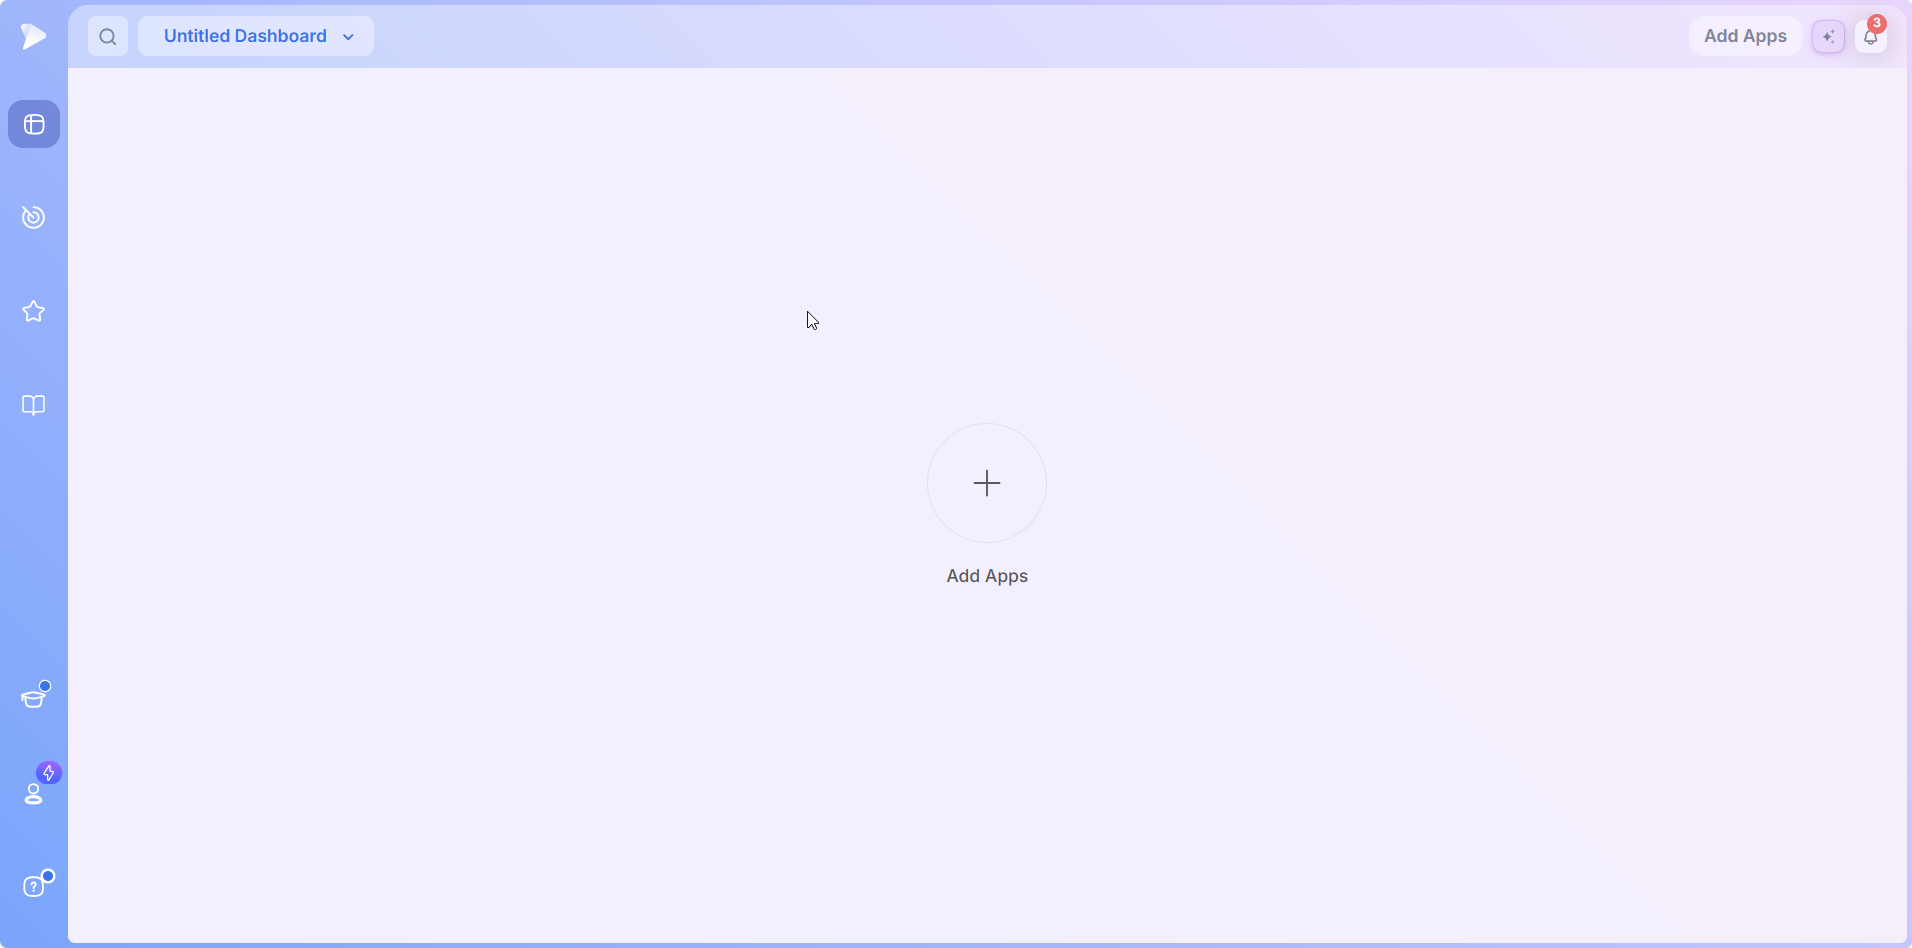
A new dashboard opens empty, with a single Add Apps circle in the middle of the board.
Go into Dashboards from the left sidebar.
Create a new dashboard from the dashboard menu at the top left and name it something you will recognize later.
Open Add Apps from the header or the circle in the middle of the empty board.
Click each app you want in the panel to add it to the board.
Set the color group on any apps that should move together.
Configure each app to the settings you want it to remember, then bookmark the dashboard if you will open it daily.
That is the whole process, and it runs the same whether you add two apps or eight.
Or Start From a Preset
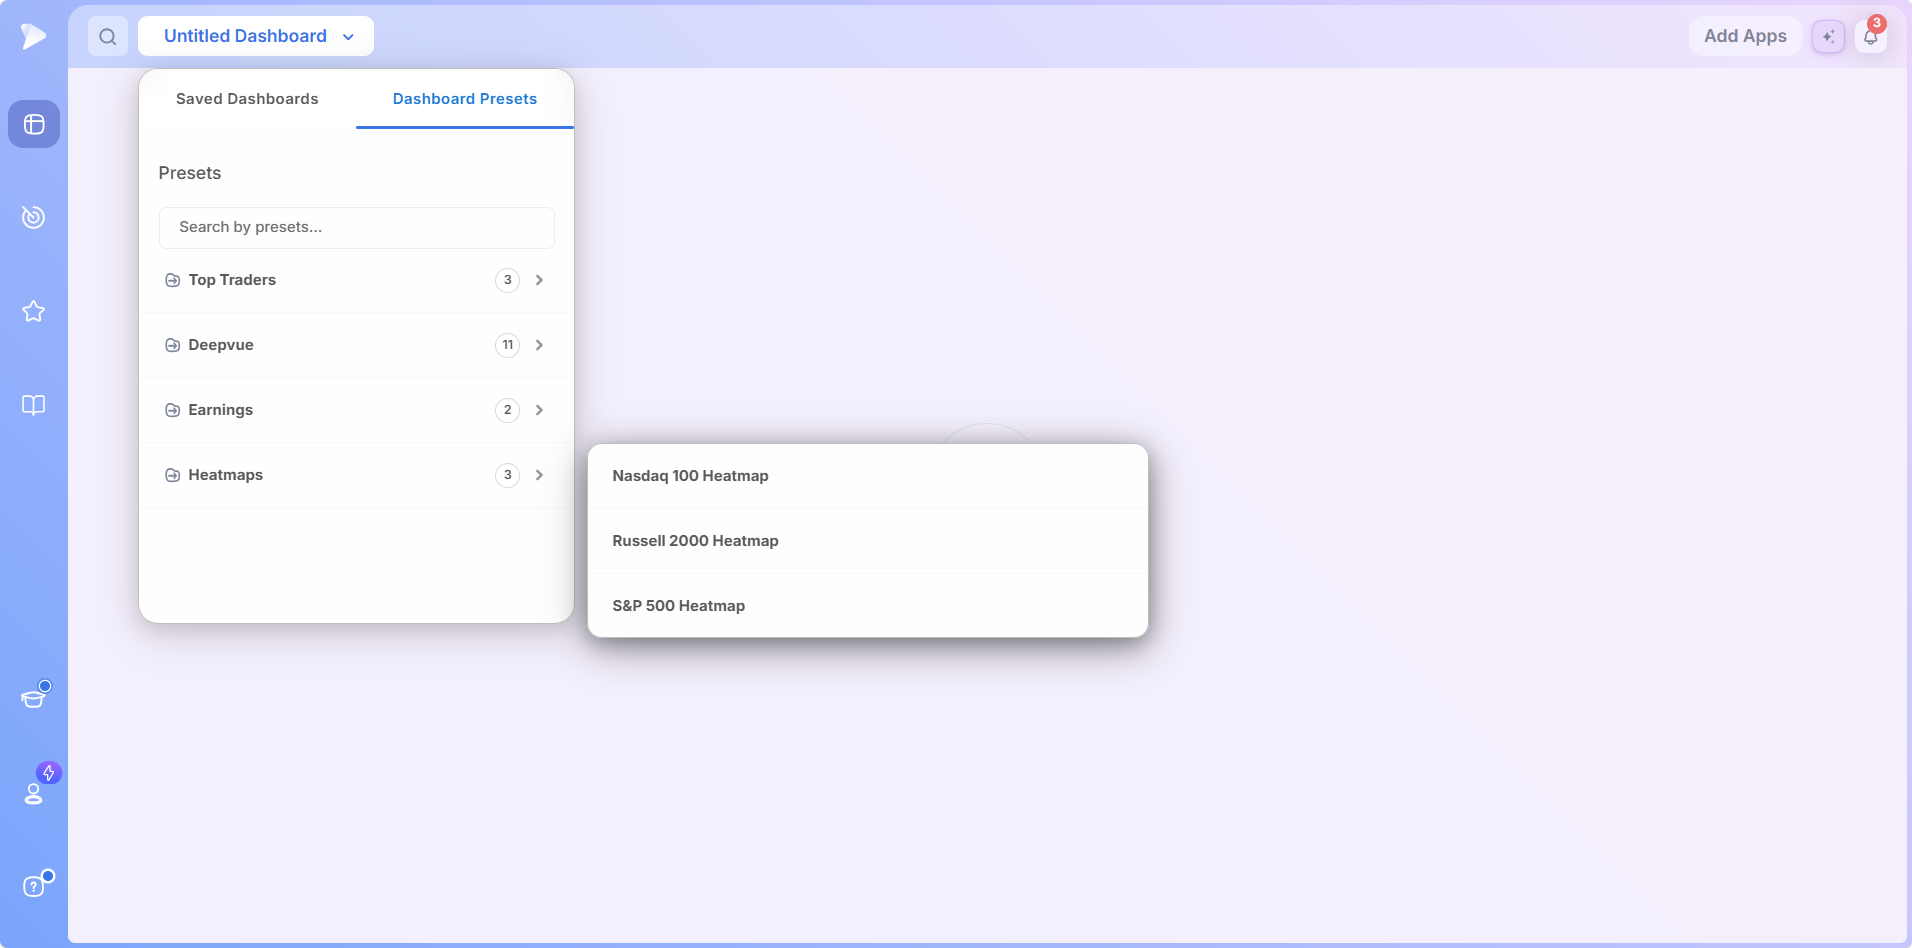
A blank board is not the only option. Open the dashboard menu and switch to Dashboard Presets: complete layouts already assembled and configured, grouped into folders and searchable by name.
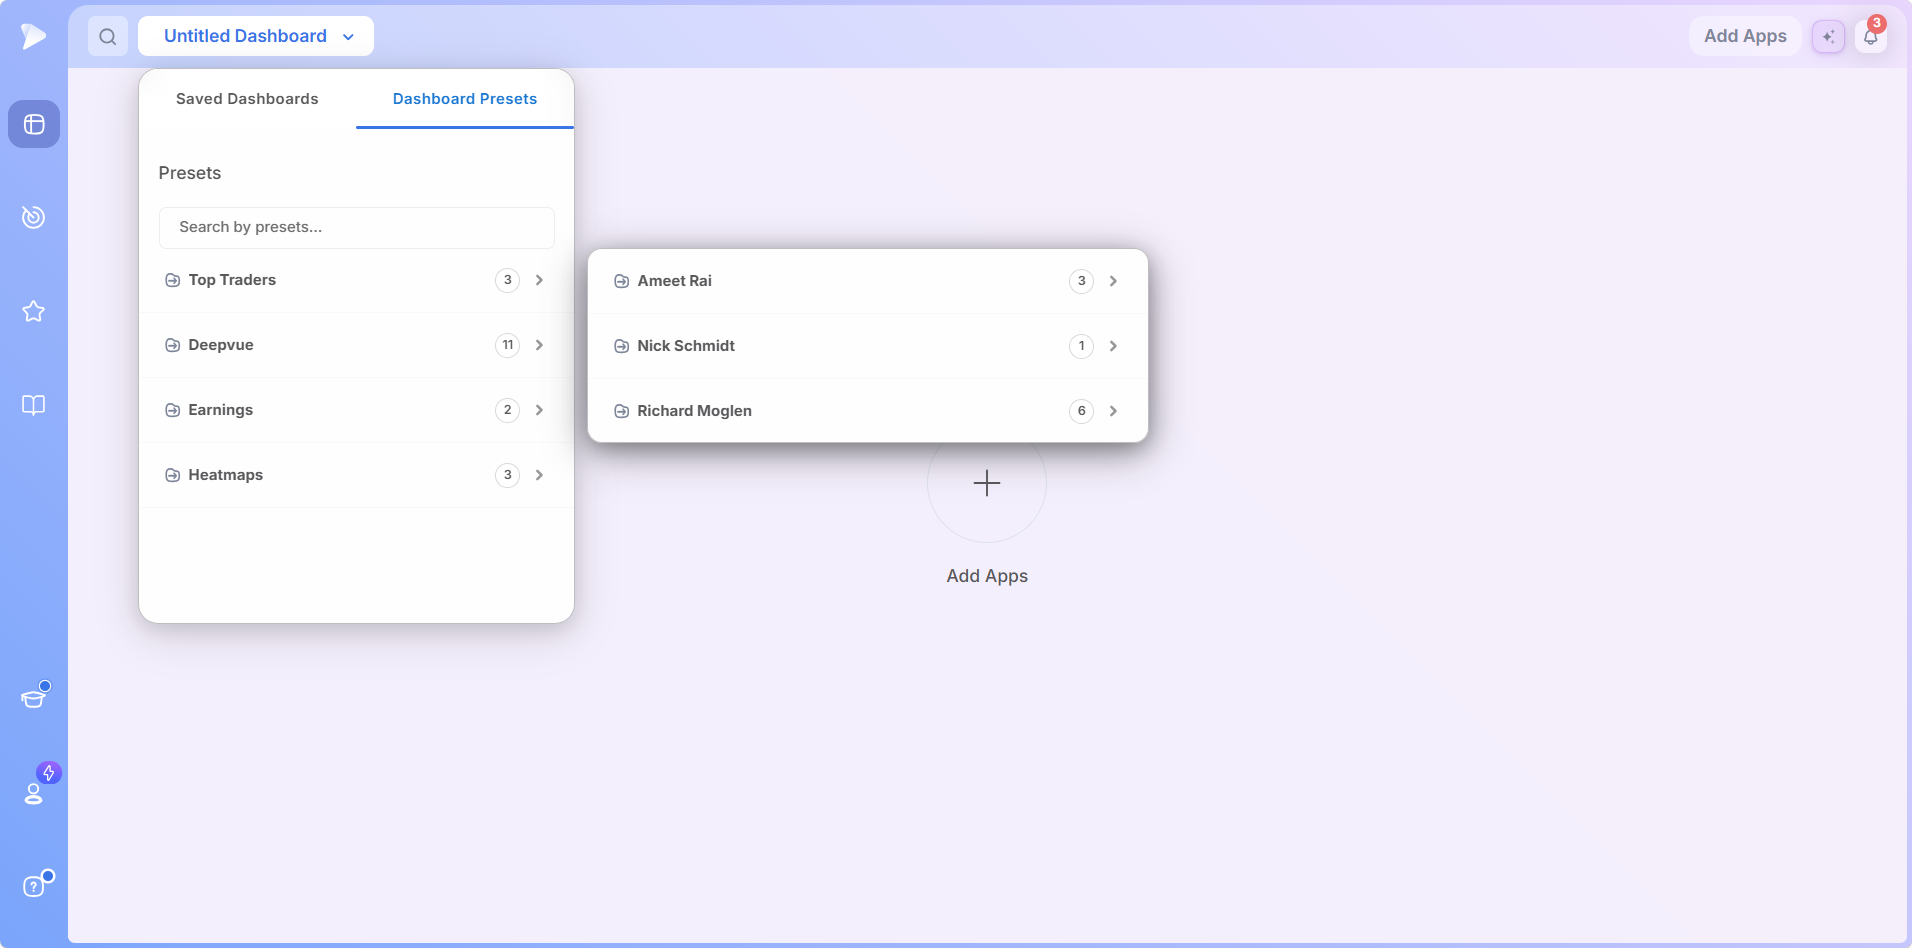
- •Top Traders: layouts from named traders, including Ameet Rai, Nick Schmidt and Richard Moglen.
- •Deepvue: the Deepvue team’s own layouts for specific jobs.
- •Earnings: boards built around the reporting calendar.
- •Heatmaps: ready made index heatmap boards.
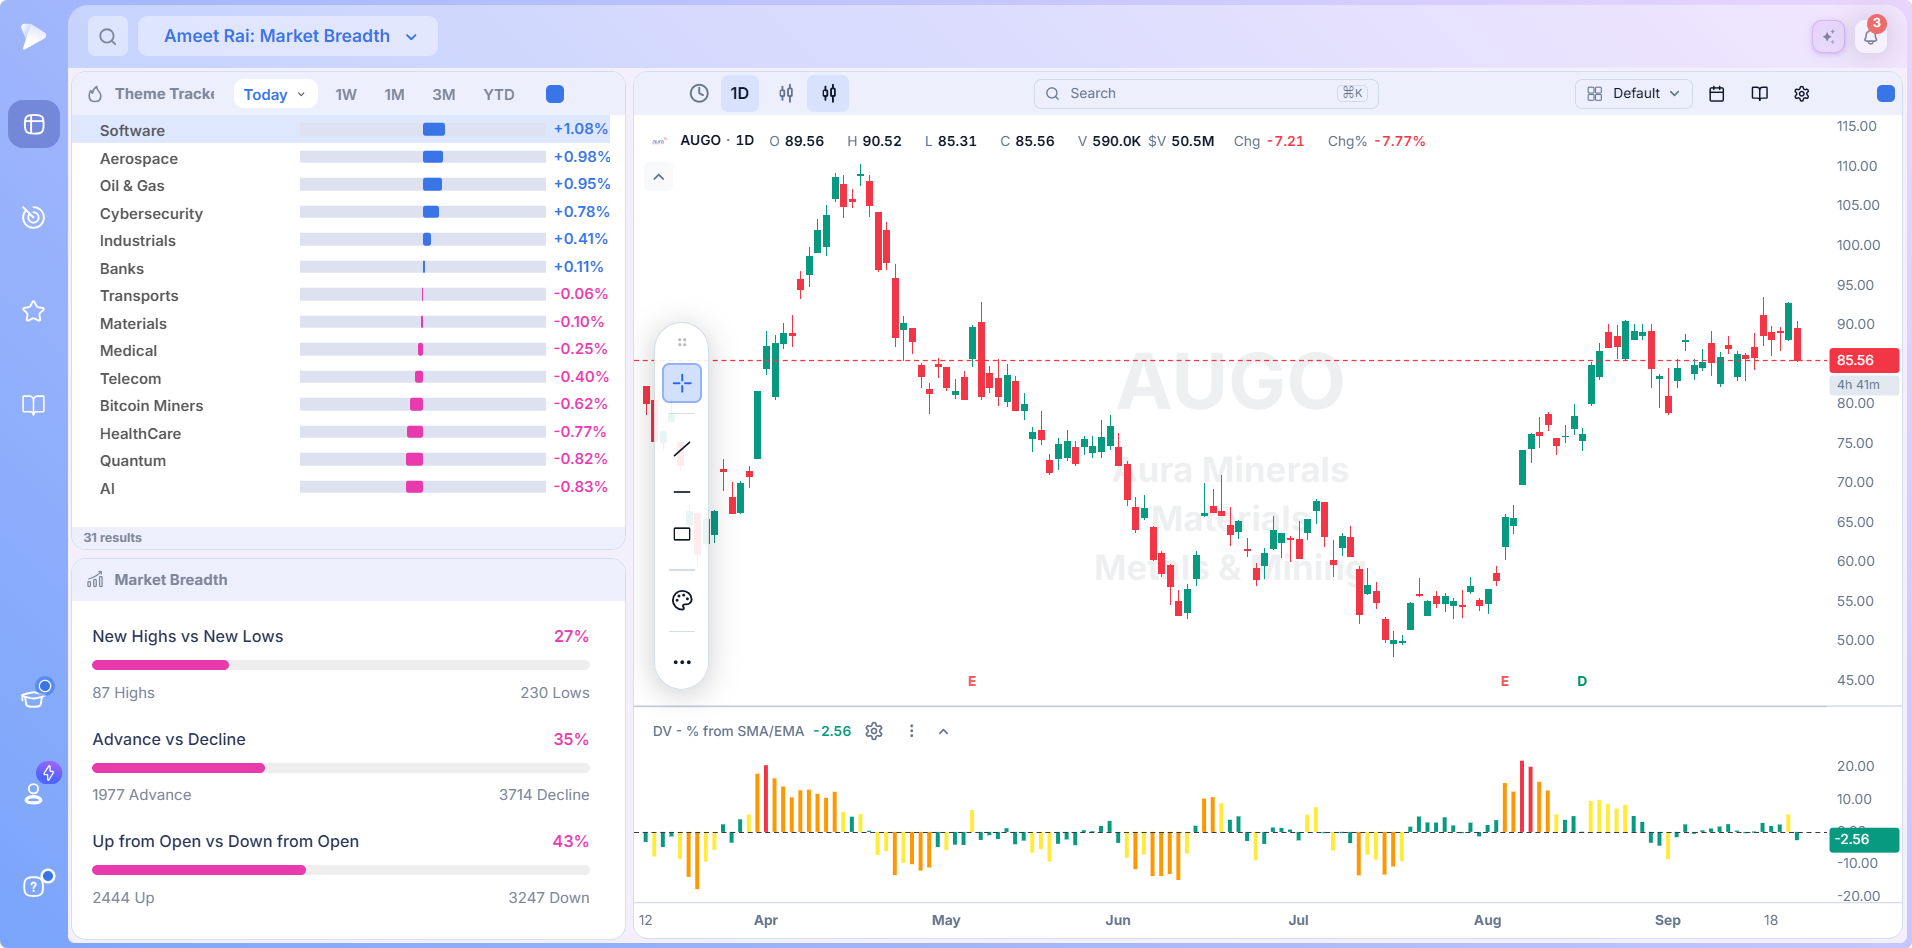
Load one and the whole board appears, apps configured and color groups set. A market breadth preset pairs the Theme Tracker and Market Breadth with a chart, for a fast read on leadership and participation.
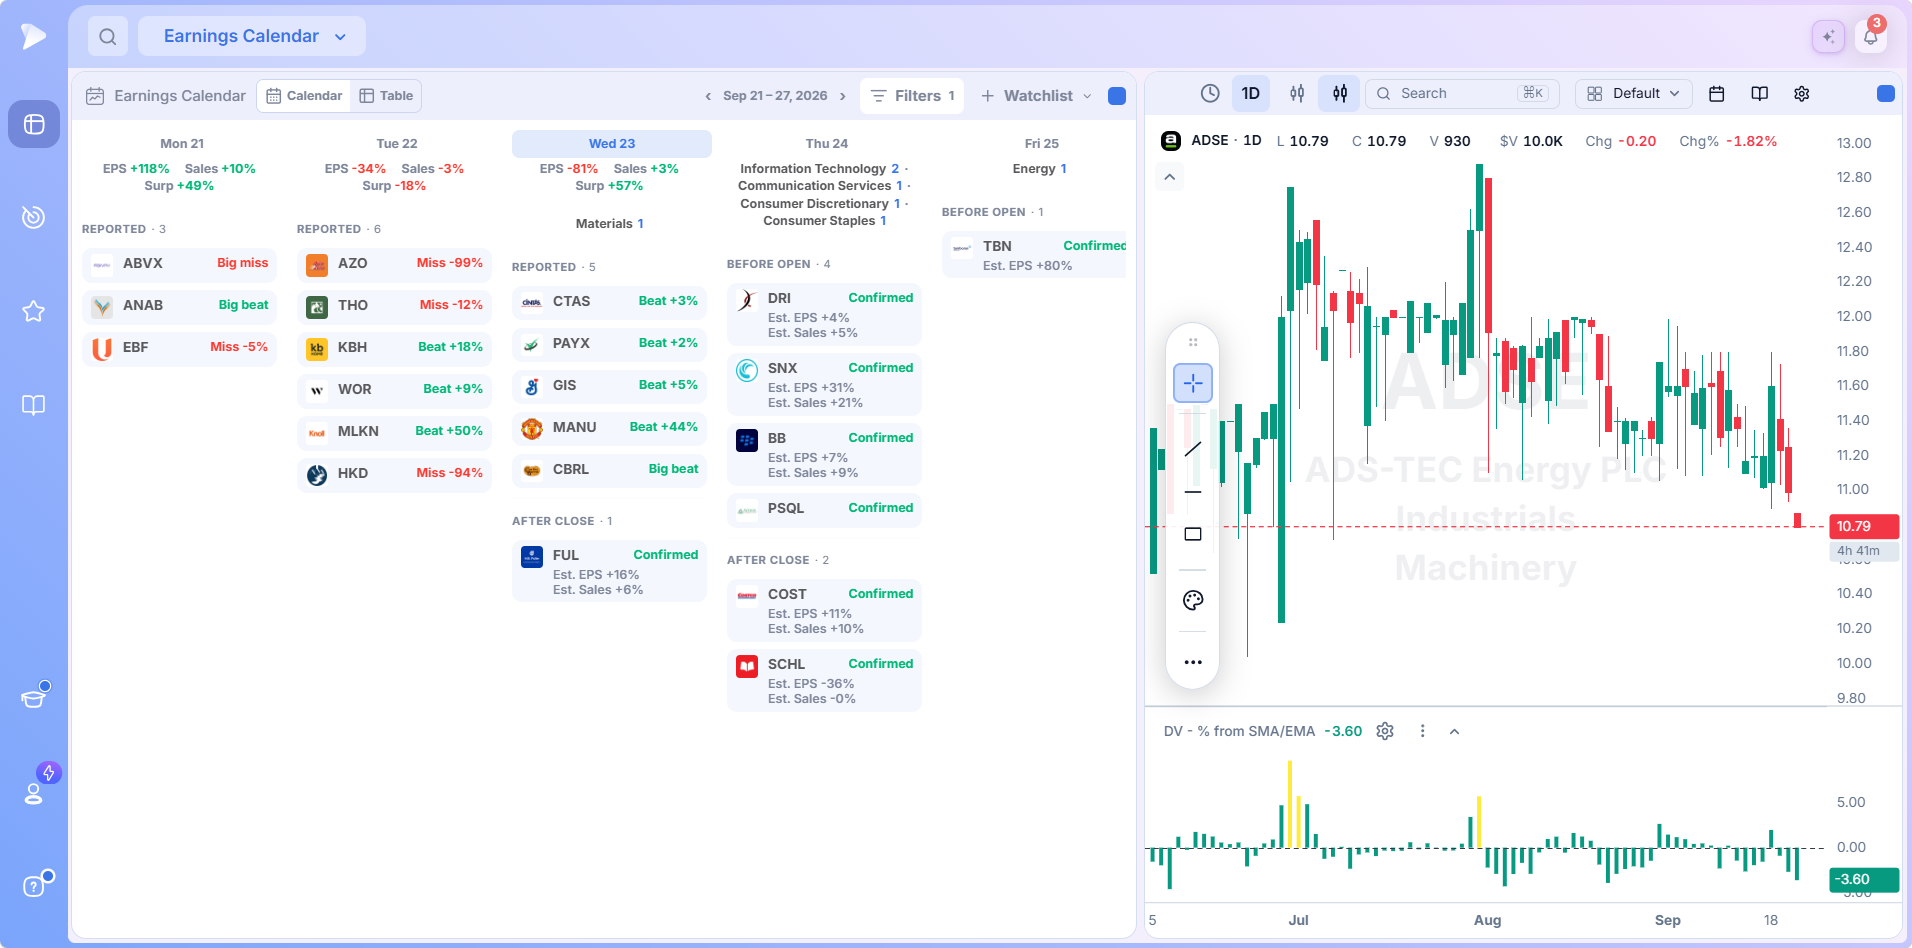
An earnings preset puts the Earnings Calendar beside a chart, so every report on the week’s schedule is one click from its price action.
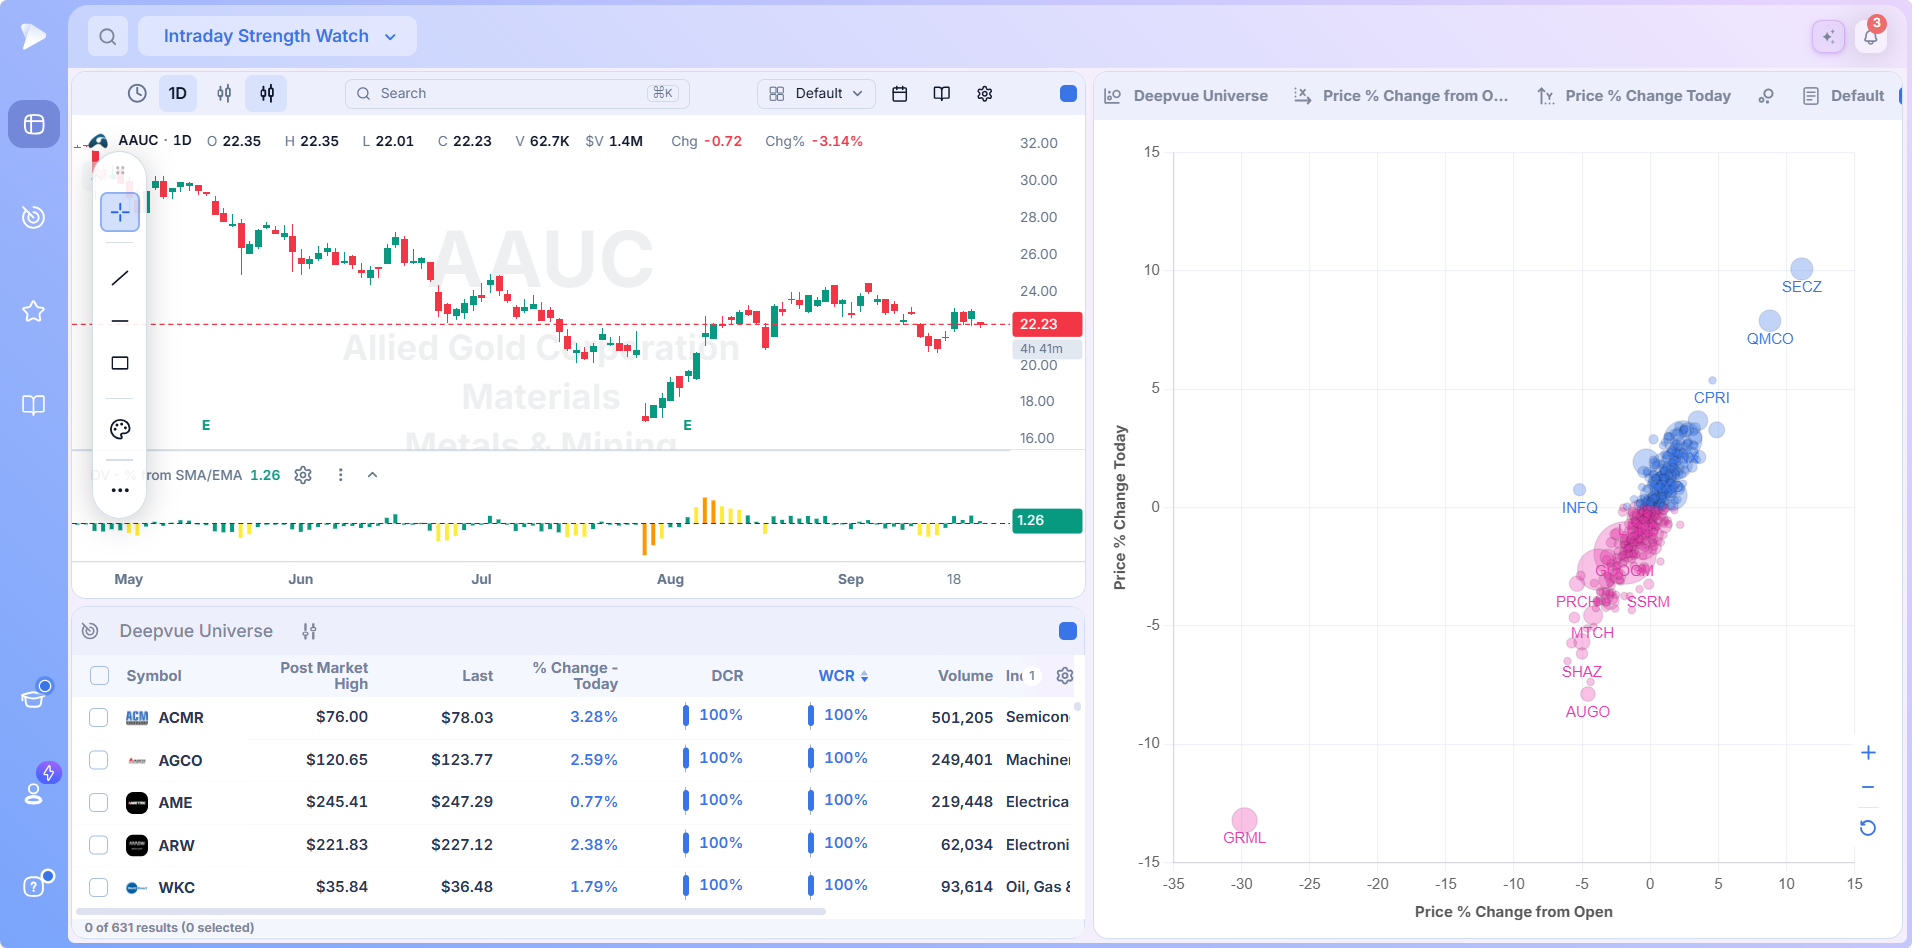
And an intraday strength preset combines a chart, a screen of the Deepvue Universe and a bubble chart plotting change from the open against the day’s change, a live read on who is being bought after the bell.
Nothing in a preset is locked, so a custom trading dashboard can begin as somebody else’s. Load one, change the settings, add apps or take them away. Plenty of traders never build from scratch, starting from the preset that is closest and reshaping it over a few sessions until it is theirs.
Three Layouts Worth Copying
| Layout | What goes on it | What it answers |
|---|---|---|
| The premarket screen | Market Brief, Top Movers, Upgrades / Downgrades and the Theme Tracker | News, what moved, analyst actions and leadership in one glance before the open |
| The working screen | A screener or watchlist, a chart linked by color group, and a position size calculator | Find, judge, size |
| The market context screen | Industry Ranks, Stage Analysis and a heatmap | Relative performance, structural condition and today’s moves |
The Theme Tracker, the Heat Map and the Position Size Calculator each have their own walkthrough if you want to go deeper on any of them.
Sign up for Deepvue and each of those takes a couple of minutes to assemble.
Worth Knowing
- •Space is finite. A dashboard holds only what it can show usefully.
- •Some apps need width. Tables with many columns and anything with paragraphs of text work best with room.
- •More is not better. A dashboard with twelve apps on it usually means two dashboards would have served better.
- •Coverage is US listings, and nothing on a dashboard places trades.
What Makes the Deepvue Dashboard Different
- ✓Built from a catalog, not a template, so the screen matches your routine.
- ✓Color group linking turns separate apps into one workflow.
- ✓Apps built for growth traders: Theme Tracker, Industry Ranks, Stage Analysis, RS based data and the AI Terminal share the catalog with the charts.
- ✓Presets from the Deepvue team and named traders to start from.
- ✓Unlimited dashboards and duplicate apps, all on one plan.
To weigh the whole platform, the Deepvue comparisons hub lays Deepvue next to Finviz, TrendSpider, TradingView, MarketSurge and TC2000, with each comparison covering what the dashboard and the rest of the platform offer.
What Traders Say About Deepvue
What reviewers outside Deepvue say about the platform behind these dashboards.
“Deepvue consolidates all my information streams into one centralized hub.”
Shared by a customer on deepvue.com. View it on deepvue.com
“The interface is very well thought out and highly customizable.”
u/NeosDemocritus, writing in r/CANSLIM. Open the thread
Deepvue’s dashboards are “a lot more helpful than the market overview pages” found elsewhere.
From Dave at Day Trade Review, who gave the platform a 4.7. Read Dave’s review
“It’s powerful, simple, and SUPER clean/easy to navigate.”
A G2 reviewer from the financial services sector. See it on G2
The Deepvue reviews wall carries 220 plus verified reviews with a 4.8 average, and 97 percent of reviewers back Deepvue with a recommendation.
Where Dashboards Connect
Every app on a dashboard also has its own walkthrough, grouped the way the catalog is:
- •Core Features: charts, the screener, watchlists, alerts and the AI Terminal.
- •Visualizations: the Performance Chart, Heat Map, Bubble Chart and Mini Chart.
- •Research: market breadth, rankings, themes, news and analyst actions.
- •Tools: the Stats Table, Position Size Calculator and both calendars.
What It Costs
Every app in the catalog is included in Deepvue’s single plan at $49 per month, with monthly and annual options. Apps are not sold individually, the number of dashboards you keep is not something you buy more of, and no feature waits behind a higher plan because there is not one.
That one plan covers:
- •The screener and its 1,152 data points.
- •Charts, watchlists, and alerts, all of them unrestricted.
- •Fully customizable dashboards, with every app in the catalog.
- •The Theme Tracker, Market Brief, and AI Terminal, the last with unbounded usage.
Deepvue has one plan, so there are no tiers to compare. For reference, MarketSurge, the legacy platform in this niche, runs $149 per month.
New subscribers also get a one on one onboarding session with a Deepvue team member, an onboarding email series covering platform features and use cases, and weekly live webinars that each go deep on one part of the platform.
Build the Screen Your Routine Needs
The right stock trading dashboard is the one that matches how you actually work, which is why Deepvue ships a catalog of dashboard apps rather than a layout. Pick the apps your routine needs, link the ones that should move together, set each one up once, and save it.
Your screen, your rules. Create a Deepvue account and spend a minute building your first customizable dashboard.
↑ Back to contentsFrequently Asked Questions
Quick answers about building and running dashboards.
What is a customizable dashboard?
A customizable dashboard is a screen you assemble yourself rather than one the platform hands you. In Deepvue it starts empty, and you choose which apps appear, what settings each runs with, and which apps are linked so they follow the same stock.
How do you set up a customizable trading dashboard?
You set up a customizable trading dashboard by deciding what the screen is for, then adding only the apps that job needs. In Deepvue, click each app in the Add Apps panel, link the ones that should follow the same stock, and save each purpose as its own dashboard.
What should be on a stock trading dashboard?
What should be on a stock trading dashboard is something that produces candidates, something that judges them and something that supplies context. In Deepvue that means a list or screen, a chart and a market read; adding more apps than the routine needs usually makes the screen worse.
How many apps can I put on one dashboard?
You can put as many apps on one dashboard as the screen can show usefully. Any Deepvue app can share a board with any other, and when a board starts doing two jobs, a second dashboard serves better than squeezing in more.
Can I have more than one dashboard?
Yes, you can have more than one dashboard. Build as many as your routine needs, name each one, and switch between them from the Deepvue dashboard menu under Saved Dashboards; a bookmark lifts one to the top of the list.
What are color groups?
Color groups are a way of tying apps together so they track the same symbol. Every Deepvue app header carries a small colored square, and apps sharing a color move as one, so picking a name in a list pulls it onto the chart alongside.
Can I add the same app twice?
Yes, you can add the same app twice, and several of the most useful Deepvue layouts rely on it. Two Theme Trackers on different timeframes, or two Industry Ranks widgets sorted differently, answer two questions on one screen.
Do my app settings save?
Yes, your app settings save. Each Deepvue app keeps its own configuration as part of the dashboard, so timeframes, filters, universes and data point selections are all there when you reopen it.
Are there prebuilt dashboards?
Yes, there are prebuilt dashboards. Open the Deepvue dashboard menu and switch to Dashboard Presets, organized into Top Traders, Deepvue, Earnings and Heatmaps folders; load one and reshape it however you like.
Can I load a ready made heatmap dashboard?
Yes, you can load a ready made heatmap dashboard. The Heatmaps folder in Deepvue’s Dashboard Presets holds Nasdaq 100, Russell 2000 and S&P 500 heatmap boards, each one click from the dashboard menu.
Which traders have dashboard presets?
The traders with dashboard presets in the Top Traders folder include Ameet Rai, Nick Schmidt and Richard Moglen. Each Deepvue preset loads the trader’s layout with its apps and settings in place.
Is the Model Book a dashboard app?
No, the Model Book is not a dashboard app. It is a separate Deepvue module, opened from the sidebar or the chart toolbar, that fills the window until you click Exit Model Book.
Do dashboard apps cost extra?
No, dashboard apps do not cost extra. Every Deepvue app is part of the single $49 per month subscription, with nothing to buy individually and no tier that unlocks more of them.