Deepvue Market Breadth: Is the Market Actually Participating?
Market Breadth is a Deepvue dashboard app that reports what share of the market is taking part in a move. Five gauges each pair a bullish count against a bearish one: new highs against new lows, advancers against decliners, up from open against down, up on volume against down, and 4 percent gainers against 4 percent losers.
Each gauge shows the bullish percentage with the raw counts beneath, and a Stage Analysis strip underneath splits the whole universe into the four Weinstein stages, with a market breadth chart of how that mix is shifting.
and the card is on your first dashboard in seconds.
Deepvue market breadth, in numbers:
Key Takeaways
An index can rise on a handful of large names while most of the market falls, and the index chart will never tell you that.
Market breadth will, because it counts stocks instead of weighting them. It is the plainest answer to whether a rally has company or is being carried by five megacaps.
The Deepvue Market Breadth app puts that count on one dashboard card: five paired gauges for participation, plus a Stage Analysis strip for the structural condition beneath the day’s numbers. There is no symbol to pick and nothing to set up, and a card with no setup is a card you actually read every morning.
- ✓Five paired breadth indicators cover new highs and lows, advance decline, open direction, volume and 4 percent moves, each printing the bullish share over both counts.
- ✓Color tells the side at a glance: a gauge draws in blue above 50 percent and pink below it.
- ✓A stage strip shows what proportion of the universe is basing, advancing, topping or declining, with a chart of how that mix has shifted.
- ✓Nothing to configure. No symbol, universe or color group, because it describes the whole market rather than any part of it.
- ✓Read it before the screener. It pairs naturally with Stage Analysis, Industry Ranks and the Market Brief.
- ✓No add on required. Every gauge comes with the one subscription. Get started with Deepvue here.
Market Breadth Widget at a Glance
- Gauges
- New Highs vs New Lows, Advance vs Decline, Up from Open vs Down from Open, Up on Volume vs Down on Volume, Up 4% vs Down 4%
- Reading
- Bullish count as a percentage of both counts, a bar in blue or pink, and the two raw counts
- Stage strip
- Stage 1 basing, Stage 2 advancing, Stage 3 topping, Stage 4 declining, with count and share for each
- Chart
- S1 to S4 share lines across time, each labeled in the legend
- Settings
- None; no symbol, universe or color group square
- Location
- Under Research in Add Apps, right after the Data Panel
- Plan
- Covered by the $49 per month subscription
What Is the Deepvue Market Breadth App?
It is a stock market breadth card for the dashboard: a fixed set of breadth indicators computed across the platform’s universe and shown as gauges rather than an index chart. Where most Deepvue apps answer a question about one stock, group or list, this market breadth dashboard app answers one about all of them at once.
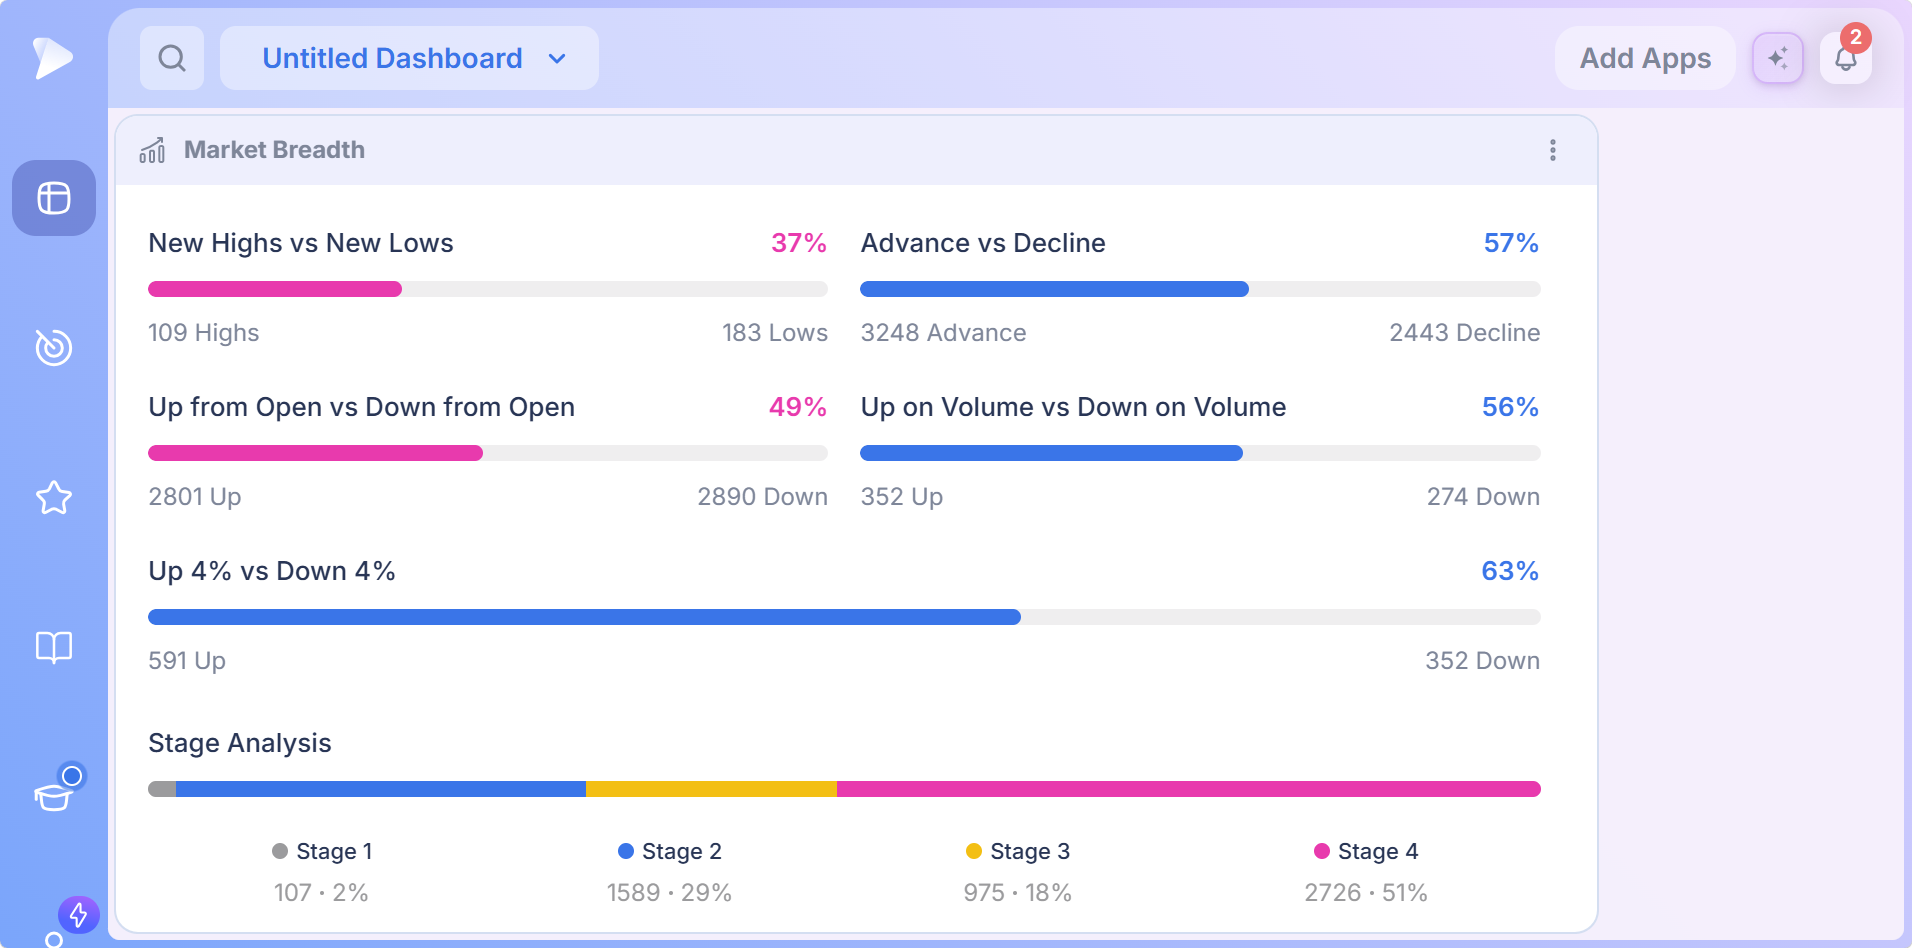
A word on the images: they come from a single trading session, so every gauge reading, raw count and stage share reflects that day. They show how the card is laid out and read, and every number will have changed the next time you load it.
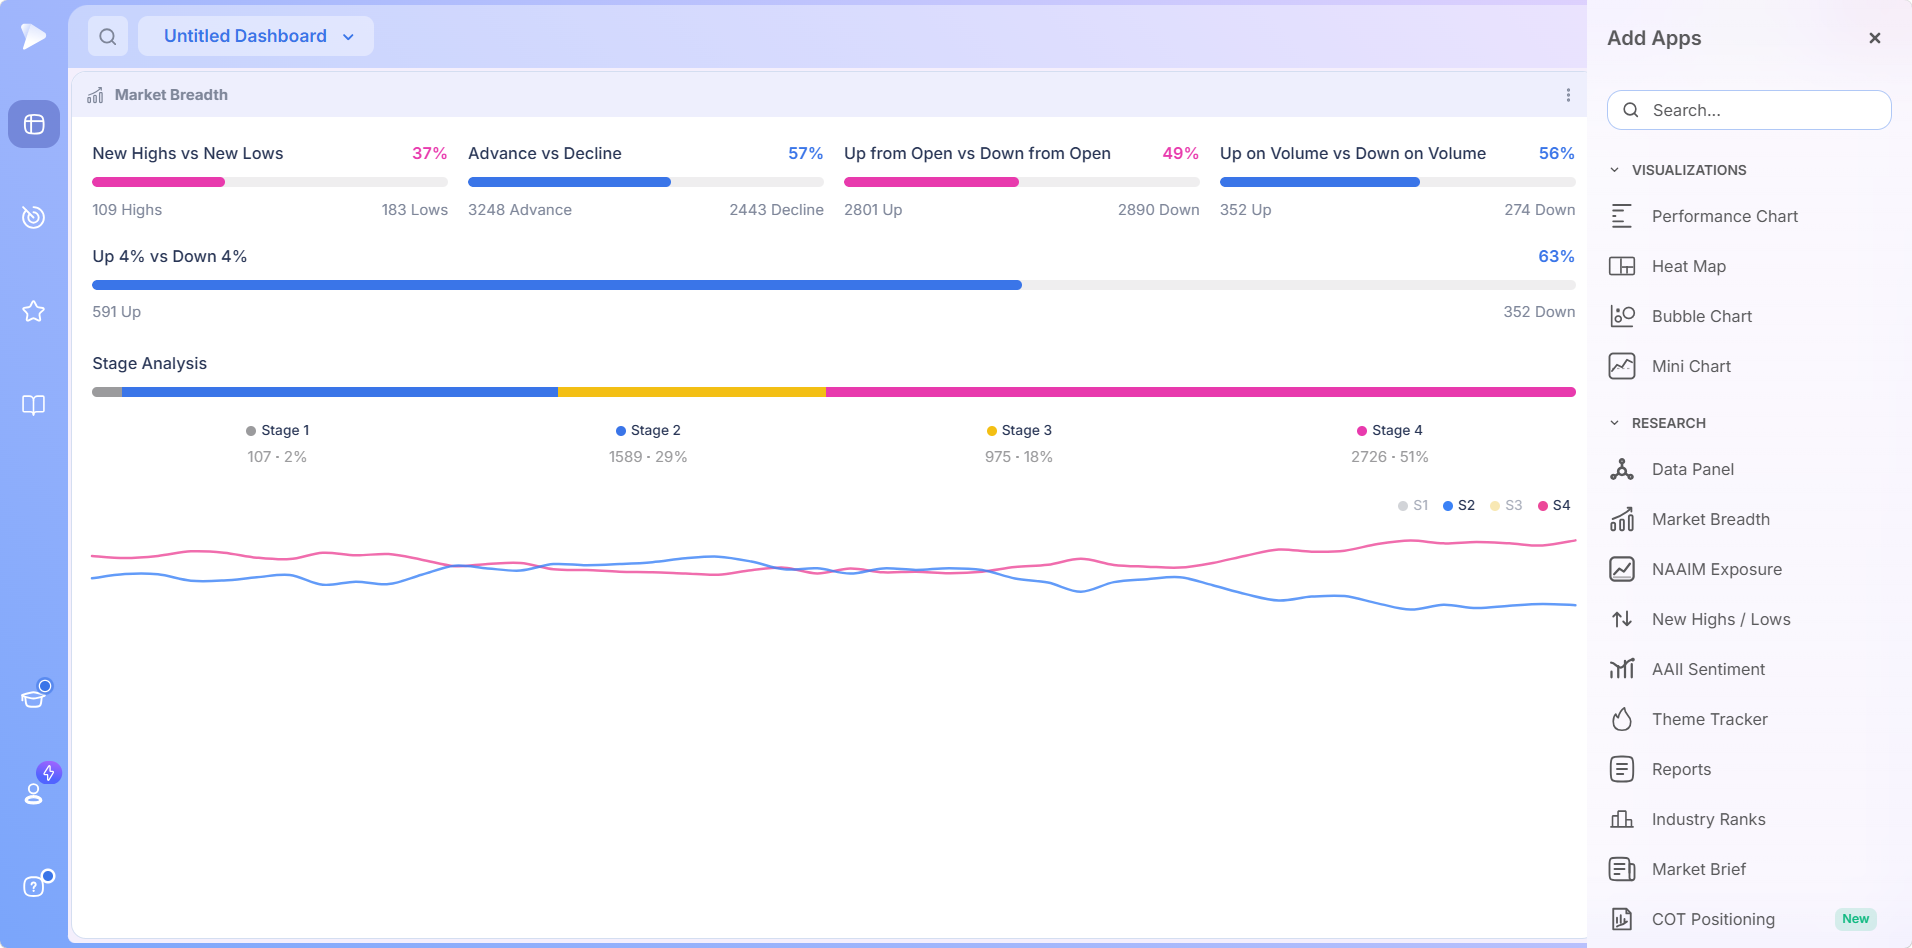
The catalog lists it under Research, right after the Data Panel. The header carries only the app name and a menu, with no group square, since a market wide reading has no symbol to follow. At full width four gauges share the top row with the fifth beneath; at a narrower width they pair up two to a row, followed by the stage strip and chart.
Why Breadth Comes First
A top down routine runs market, group, stock, and breadth is the market step. A leading theme where most stocks are falling produces failed breakouts; the same theme where advancers outnumber decliners produces the trades you remember. This market breadth widget tells you which environment you are in.
Who the Market Breadth App Is For
- ✓Swing traders deciding before the open whether the tape supports breakouts.
- ✓Momentum traders reading the volume and 4 percent gauges for whether leadership is broad or narrow.
- ✓Position traders watching the stage split for the structural turn that precedes a new advance.
- ✓CANSLIM traders, for whom market direction is the M in the acronym and a market breadth dashboard app is one of the cleanest ways to read it.
Routines for every style are written up under Deepvue for.
The Five Breadth Indicators
Every gauge is built the same way, which makes the whole card readable once you have learned one:
- •A title naming the pair being counted.
- •A percentage on the right, the bullish side’s share of both counts together.
- •A bar drawing that share, blue above 50 percent and pink below, so the balance reads before the number does.
- •The raw counts beneath, bullish on the left and bearish on the right.
| Gauge | What it counts | What a high reading means |
|---|---|---|
| New Highs vs New Lows | Stocks making new highs against stocks making new lows | Leadership is expanding rather than breaking down |
| Advance vs Decline | Stocks up on the day against stocks down | The session is broadly positive, not carried by a few names |
| Up from Open vs Down from Open | Stocks above their opening print against stocks below it | Buyers held control through the day rather than fading it |
| Up on Volume vs Down on Volume | Stocks rising on volume against stocks falling on volume | Accumulation outweighs distribution where volume is heavy |
| Up 4% vs Down 4% | Stocks up at least 4 percent against stocks down at least 4 percent | Large moves are skewing upward, a sign of aggressive buying |
Read them as a set and the shape of a session appears. A day can show advancers comfortably ahead while new highs trail new lows, or big movers skewing up while open direction is roughly balanced. Mixed readings like these describe a market with pockets of strength rather than a broad move, and that nuance is the point: one gauge alone is a number, five together are a description.
Reading a Market Breadth Indicator
On every market breadth indicator the figure is the bullish count divided by both counts, with 50 as the balance point. The raw counts matter as much as the share, because the same percentage carries different weight depending on how many stocks produced it. A reading from a few hundred names at new highs or lows is a quieter statement than the identical reading across several thousand advancers and decliners.
The Two Conviction Gauges
The volume and 4 percent gauges deserve the closest reading, because both filter for conviction. A stock can drift up on nothing; it takes commitment to rise on heavy volume or move 4 percent in a day.
When those two lean bullish while advance decline is mixed, buyers are concentrating on fewer names with more force: narrow but real leadership, and a tape where a good breakout can still work. When they lean bearish while advance decline is mixed, distribution is under way in exactly the names that matter, and that is the read that saves you money, because the index may still look fine.
Create a Deepvue account and read all five gauges on today’s session before you open a single chart.
The Stage Strip and Market Breadth Chart
Under the gauges a horizontal strip divides the universe into the four Weinstein stages: gray for Stage 1 basing, blue for Stage 2 advancing, yellow for Stage 3 topping and pink for Stage 4 declining, each segment carrying a count and a share that together total the whole universe.
Stages change over weeks rather than hours, so the strip describes the structural condition beneath the day’s counts. A thin basing share means few stocks are preparing new advances, while a swelling one means the opposite, context the daily gauges cannot supply.
Beneath the strip, a market breadth chart plots each stage’s share across time, labeled S1 through S4 in its legend; the advancing and declining lines are the ones to watch as they cross and trade places. A widening gap between them means the market has chosen a direction. The Stage Analysis app breaks the same split down by sector, group, industry and sub industry.
How to Use Market Breadth: Three Habits
The First Glance of the Day
Put the card at the top of the dashboard you open first, beside the Market Brief. The brief explains why the market is moving; the card shows what fraction of it is moving. Read both, set your aggression for the day, then open a screen.
Breadth Against the Index
Keep an index proxy chart on the same dashboard. Index up with the advance decline gauge above 50 means the move has company; index up with the gauge well below 50 means a few large names are carrying it and ordinary breakouts are likelier to fail. That divergence is one of the oldest signals in market analysis, here with no calculation.
Stage Split, Then Stage Analysis
Once a week, compare the four stage shares with the week before. A rising Stage 2 share against a falling Stage 4 share is the market repairing itself from the bottom up. When the split moves, open Stage Analysis to see which groups are supplying the change, then take them to the screener for names.
Sign up for Deepvue and have the card in place before tomorrow’s open.
What Makes Deepvue Market Breadth Different
- ✓Five breadth indicators on one card, where most platforms show one advance decline line.
- ✓Structure alongside participation, with the stage strip and chart under the daily counts.
- ✓Zero setup, so it becomes a habit instead of a project.
- ✓One click from the detail, since New Highs / Lows names every stock behind the first gauge and Stage Analysis breaks the stage split down by group.
No platform is right for everyone, and the honest way to decide is a proper comparison. Our Deepvue comparisons hub sets Deepvue against MarketSurge, TradingView, TC2000, TrendSpider, and Finviz feature by feature.
What Traders Say About Deepvue
Quoted exactly as published, from independent reviewers.
On the dashboards: “a lot more helpful than the market overview pages” most platforms offer.
Dave at Day Trade Review (a 4.7 score). Read the review
“Great team. Great product. Scanning and charts are great.”
u/patentgrinder in r/CANSLIM. Thread here
“It’s really the best screener I’ve ever used.”
u/Trading_Intern987 in r/CANSLIM. Subscriber update
“Deepvue is a great tool for traders.”
An April 2026 App Store reviewer. App Store listing
On Deepvue’s own reviews wall the average is 4.8 stars from 220 plus verified reviews, and nearly all reviewers, 97 percent, recommend Deepvue.
Where the Card Connects
- •Industry Ranks and the Theme Tracker for which groups are leading inside the participation the card measures.
- •The Heat Map and Performance Chart for breadth by sector and by stock rather than as one count.
- •The Position Size Calculator to shrink size when breadth says the tape is fragile.
What the App Costs
Market Breadth is included in Deepvue’s single plan at $49 per month, with monthly and annual options. Nothing on the card is gated, which is what makes it safe to build a morning habit around.
That one plan covers:
- •The screener and its 1,152 data points.
- •Charts, watchlists, and alerts, all of them unrestricted.
- •Fully customizable dashboards, with every app in the catalog.
- •The Theme Tracker, Market Brief, and AI Terminal, the last with unbounded usage.
Deepvue has one plan, so there are no tiers to compare. For reference, MarketSurge, the legacy platform in this niche, runs $149 per month.
New subscribers also get a one on one onboarding session with a Deepvue team member, an onboarding email series covering platform features and use cases, and weekly live webinars that each go deep on one part of the platform.
Know the Crowd Before You Join It
Most bad trades in good setups come from ignoring the market around them. A market breadth indicator on the dashboard you already open makes that impossible, and one that needs no setup gets read every day: five participation counts, a stage split, and a chart of how they are changing, in the time it takes to sip a coffee.
Get Deepvue and know whether the market is with you before you press a single buy.
↑ Back to contentsFrequently Asked Questions
The questions traders raise before making market breadth a daily habit.
What is market breadth?
Market breadth measures how much of the market is taking part in a move, by counting stocks rather than weighting them by size. A broad rally has most stocks rising; a narrow one is a handful of megacaps carrying an index while the rest go nowhere. Deepvue’s Market Breadth card counts that participation five ways on one screen.
What is a good market breadth reading?
A good market breadth reading is above 50 percent on a gauge, meaning more of the market is participating on the bullish side, and the further above, the broader the move. Agreement matters more than any single figure: when Deepvue’s advance decline, volume and 4 percent gauges all lean the same way, the reading is trustworthy.
How do you use market breadth indicators in trading?
You use market breadth indicators in trading by reading them before you screen, not after. Breadth tells you what kind of environment your setups must work in: a broad tape supports adding risk and full size, while a narrow one, where the index rises as most stocks fall, is where Deepvue traders size down.
What is a market breadth divergence?
A market breadth divergence is when the index and breadth disagree, most often an index rising while the advance decline and volume gauges deteriorate. It means fewer names are carrying the move. Keeping an index proxy beside Deepvue’s breadth card makes the divergence obvious; treat it as a warning to size down, not a timing signal.
How do you read a market breadth chart?
You read a market breadth chart by watching the advancing line (Stage 2) against the declining line (Stage 4) as each stage’s share moves over time. In Deepvue’s chart, lines crossing back and forth mean the market is undecided, and one pulling clearly away means it has chosen a direction over weeks.
What is the difference between advance decline and new highs new lows?
The difference between advance decline and new highs new lows is timescale. Advance decline counts every stock up or down on the day, measuring today’s participation, while new highs new lows counts stocks at extremes, measuring leadership over a longer window. Deepvue shows both as separate gauges on one card.
Does market breadth predict market direction?
No, market breadth does not predict market direction; it describes participation. Its value is confirmation and divergence: when the index rises and breadth improves alongside it, the move has support, and when breadth deteriorates instead, fewer names are carrying it. Deepvue’s card is context, not a signal on its own.
What is the Deepvue Market Breadth app?
The Deepvue Market Breadth app is a stock market breadth card with five paired breadth indicators, new highs and lows, advances and declines, open direction, volume and 4 percent moves, plus a strip splitting the market into the four Weinstein stages and a chart of how those shares have moved.
What does the percentage on each gauge mean?
The percentage on each gauge means the bullish count as a share of both counts combined, so the New Highs vs New Lows gauge divides the highs by the two totals together. In Deepvue Market Breadth, 50 is the balance point: above it the bullish side leads, below it the bearish side does.
Why are some gauge bars pink and others blue?
Some gauge bars are pink and others blue because Deepvue draws each bar in its winning color when the gauge reads above 50 percent and in its losing color below. The colors let you see at a glance which pairs lean bullish and which lean bearish on the day.
What is the Stage Analysis strip?
The Stage Analysis strip is a bar on the Deepvue Market Breadth card dividing the universe into Stage 1 basing, Stage 2 advancing, Stage 3 topping and Stage 4 declining, with a count and share for each and a chart of the shares over time beneath.
Does the app need a symbol or a universe?
No, the app does not need a symbol or a universe. Deepvue Market Breadth measures the entire market, so there is nothing to select and no color group square, and it populates as soon as you add it.
Can I change what the gauges measure?
No, you cannot change what the gauges measure. The Deepvue Market Breadth card is fixed at five gauges and the stage split, with no settings control, which is also why it needs no setup.
How is this different from the Stage Analysis app?
Market Breadth differs from the Stage Analysis app in scope: it gives the stage split for the whole market on one strip, while Deepvue’s Stage Analysis app breaks it down by sector, group, industry and sub industry to show where the advancing stocks are.
How is this different from New Highs / Lows?
Market Breadth differs from New Highs / Lows in depth: its new highs new lows gauge gives the count and share only, while Deepvue’s New Highs / Lows app lists every name behind that count by classification.
Does the Market Breadth app update live?
Yes, the Market Breadth app updates live, with counts moving as the session unfolds. Of Deepvue’s 1,152 data points, 568 stream live over WebSocket.
Is Market Breadth useful for day trading?
No, Market Breadth is not a day trading tool. Deepvue targets holds of weeks to months, and the card supplies context for multi week holds, not intraday timing.
Is Market Breadth included in the standard Deepvue plan?
Yes, Market Breadth is included in the standard Deepvue plan. Deepvue has a single plan at $49 per month that covers Market Breadth along with the screener, charts, watchlists, alerts, dashboards, the Theme Tracker, the Market Brief, and the AI Terminal.