Deepvue Tools: Four Specific Jobs You Would Otherwise Do in a Spreadsheet
Deepvue tools are the four apps grouped under Tools in the app catalog: the Stats Table, the Position Size Calculator, the Earnings Calendar and the Economic Calendar. Each does one job that would otherwise mean a spreadsheet or a browser tab.
Reported numbers with estimates, a share count from a stop, which companies report when, and which macro releases are scheduled. One $49 per month subscription covers all four.
and answer the last four questions before every trade in seconds.
The Deepvue tools, in numbers:
Key Takeaways
The smallest group in the catalog, and the most literal. None of these stock trading tools finds a stock or reads the market. They answer the narrow questions that come up once you already have a candidate: what did it actually report, how many shares does my risk rule allow, is it reporting this week, and is there a macro print that could move it?
- ✓Four apps, four narrow jobs: reported figures, position sizing, the company calendar and the macro calendar.
- ✓The calculator enforces a rule rather than suggesting one: account, risk, cap, entry, stop and target in; shares, cost, risk in dollars and R multiple out.
- ✓Both calendars answer one question, what is coming that could move this, from the company side and the macro side.
- ✓The Stats Table is built into the Screener and Watchlist modules too, under the chart, so the earnings question gets answered without a click.
- ✓All four are dashboard apps, so they can run beside the chart or list they inform.
- ✓One subscription covers all four. Add the Deepvue tools to your screen.
Tools at a Glance
- Stats Table
- Quarterly or annual earnings and sales with growth rates, estimates beyond a divider line, and surprise on hover
- Position Size Calculator
- A share count from your risk budget, stop and position cap, plus the R multiple
- Earnings Calendar
- A week of company reports, graded Beat, Miss or In line as results land
- Economic Calendar
- Scheduled data releases showing actual against forecast and previous, filtered by impact and country
What Are the Deepvue Tools?
They are the utility apps in the Deepvue catalog: stock trading tools for the last checks before a decision, not for finding ideas. The catalog has four app groups; the others are Core Features, Visualizations and Research.
Each tool is also a dashboard app, able to run next to the chart or list it serves and track the same stock through its color group.
Who the Tools Are For
- ✓Growth stock traders who want the fundamentals and the calendar risk behind every chart.
- ✓Swing traders sizing each setup to its own stop instead of a fixed dollar amount.
- ✓Position traders holding through weeks or months of scheduled earnings and macro events.
- ✓CANSLIM traders checking accelerating earnings and sizing to a written risk rule.
- ✓Anyone keeping a spreadsheet for jobs a platform should already do.
Deepvue does not place orders; it is broker independent research software, so these trading utilities work alongside whatever account you trade through. The Deepvue for hub collects routines by trading style.
Stats Table
A company’s reported earnings and sales, quarter by quarter or year by year, each figure paired with its growth rate and followed by analyst estimates beyond a dashed line. A blue bar marks growth that has accelerated three quarters running, and a hover shows reported, estimate and surprise.
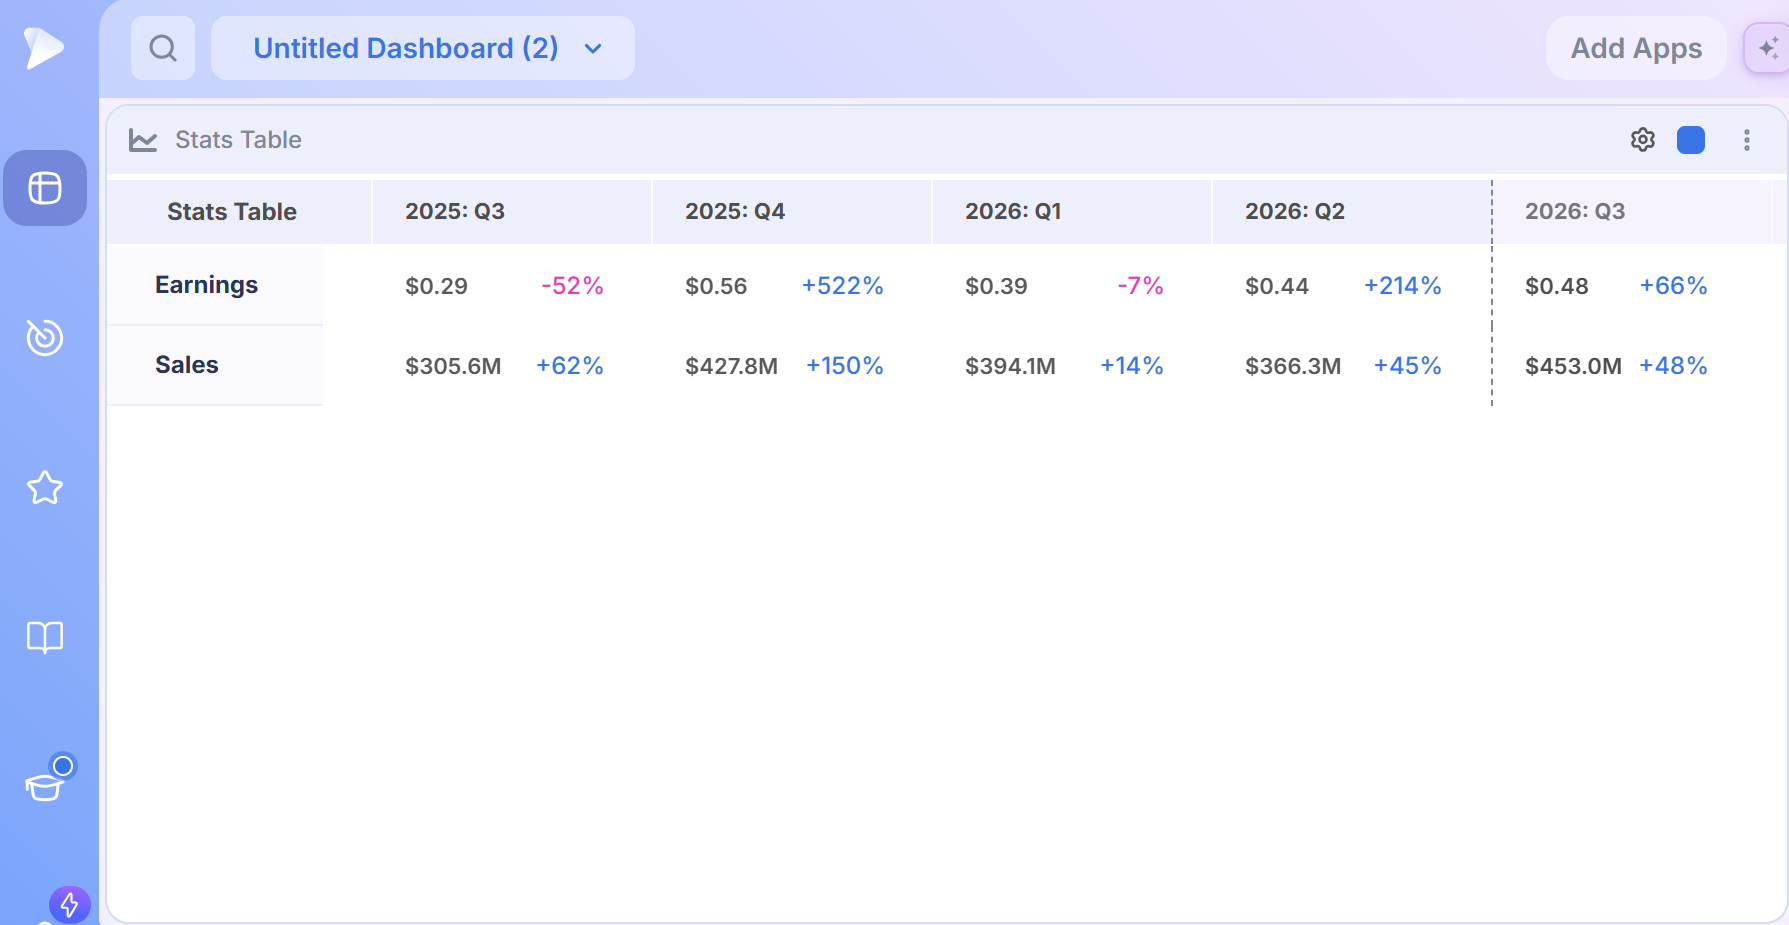
Beyond the dashboard app, the same table is built into the Screener and Watchlist modules underneath the chart, so a company’s fundamental record and its price action are read together.
Position Size Calculator
Works out how many shares to buy from your account size, risk per trade, maximum position size, entry, stop and profit target. Out come the number of shares, what they cost, the dollars at risk if the stop hits, and the R multiple.
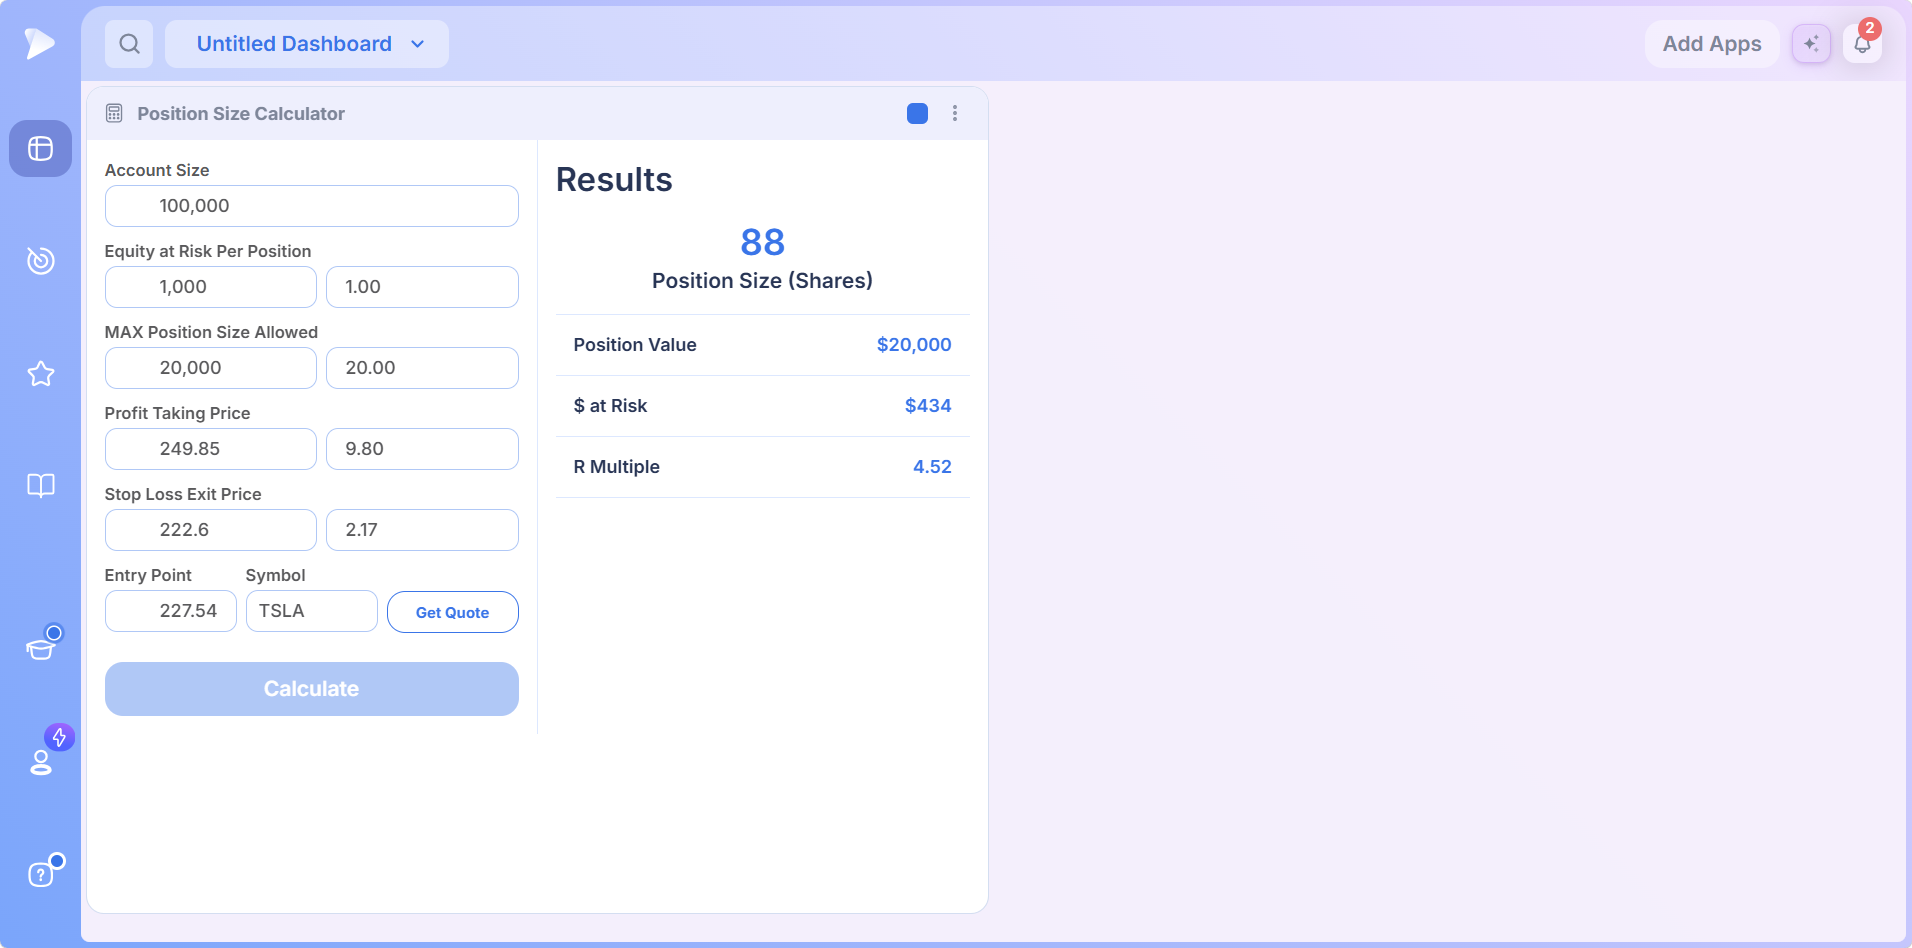
Several inputs accept either dollars or a percentage, and the maximum position size keeps a very close stop from producing an oversized holding. The payoff is consistency: every trade sized to the same rule instead of a feeling.
WatchThe Deepvue Quick Start Guide: a full orientation to the platformOpen a Deepvue account and put these four apps on your first dashboard.
Earnings Calendar
A day by day view of the reporting week. Scheduled reports carry a Confirmed or Estimated tag and the growth analysts expect; results arrive graded as beats, misses or in line, with the size of the surprise.
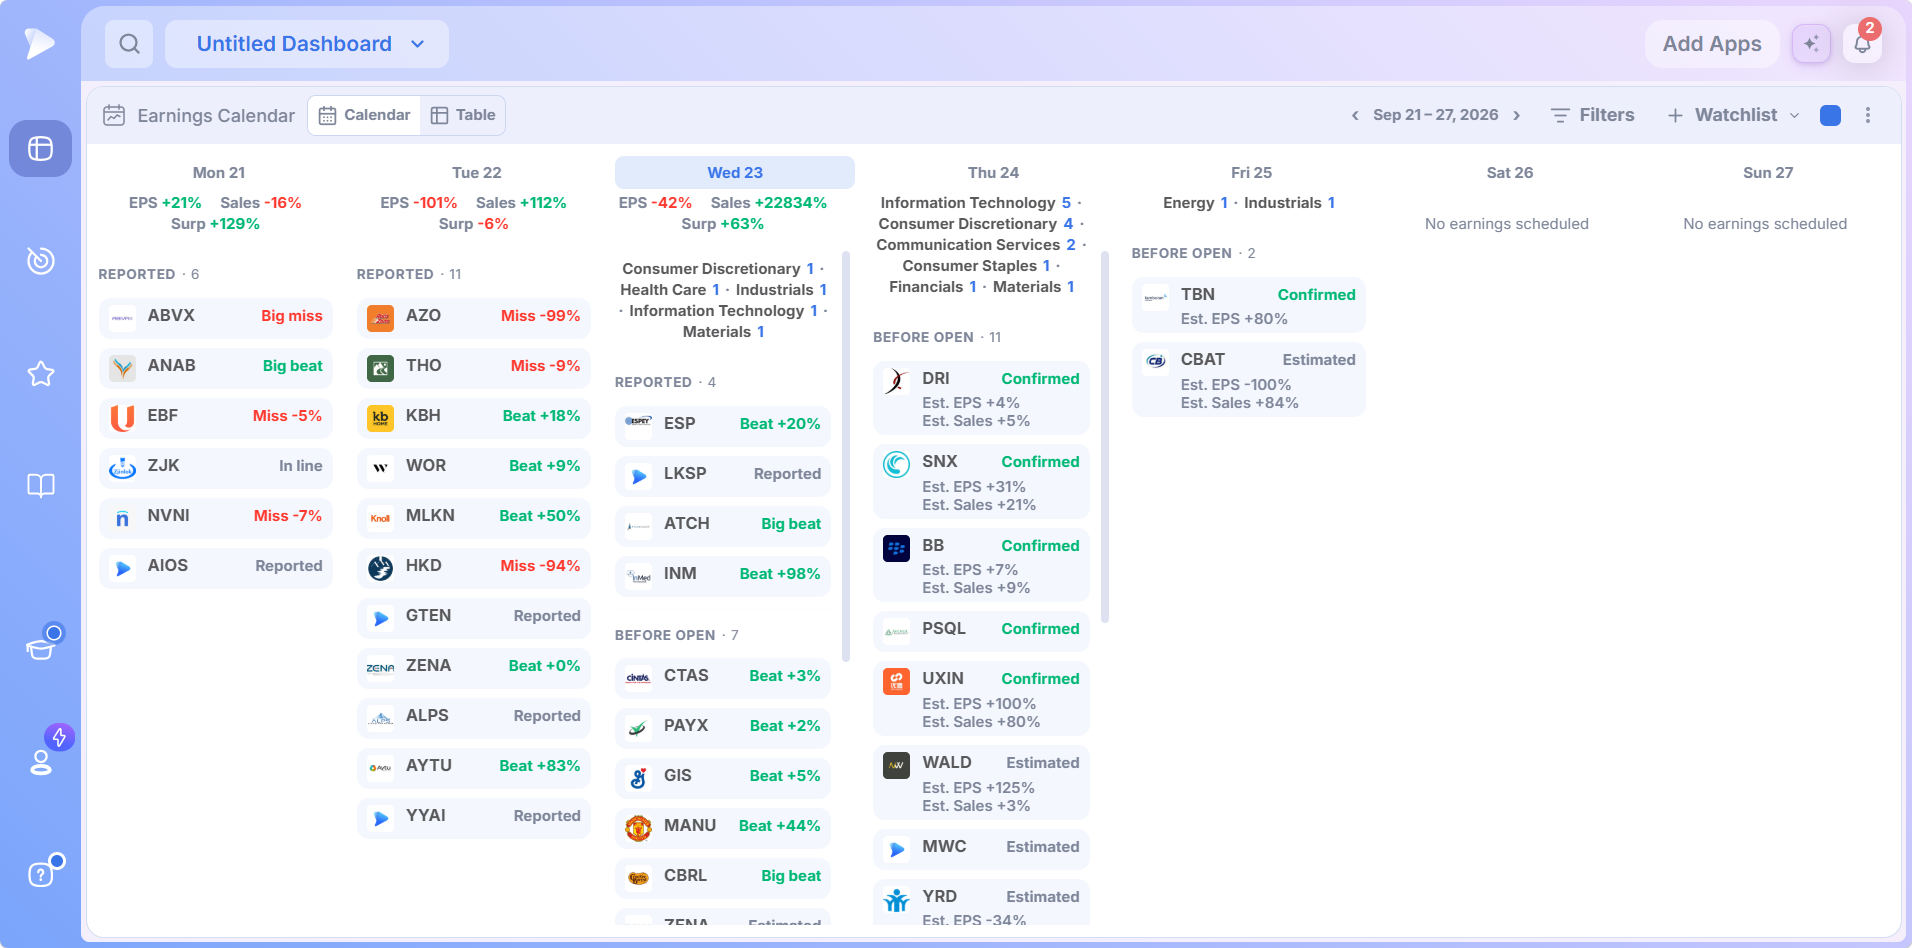
A Table view turns the cards into sortable rows, hovering any ticker identifies the company and its numbers, and five range filters cut a crowded morning down to the names you could trade. Checking it weekly means holding through a report is always a choice.
Economic Calendar
Scheduled macro releases, from inflation and jobs data to Fed decisions, each shown with its actual result, forecast and previous reading side by side.
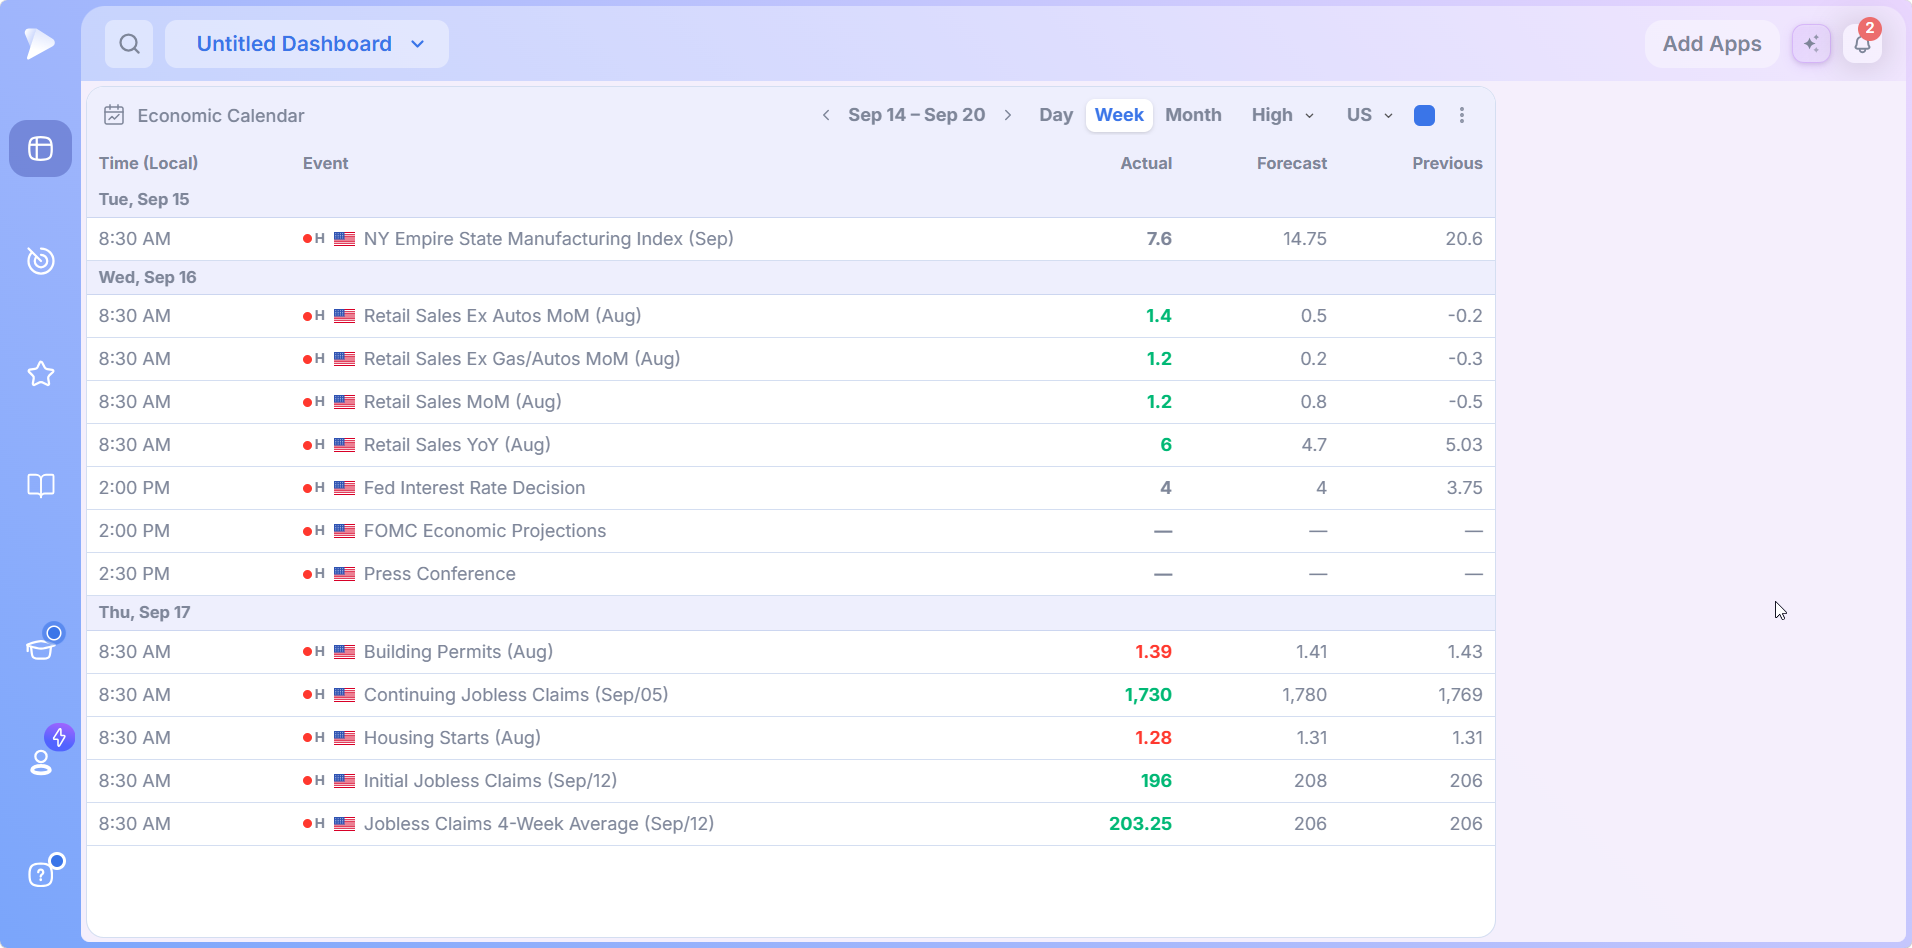
The difference between the actual print and the forecast is what moves markets, and seeing all three together puts every release in context at a glance. Day, Week and Month views, an impact filter that combines tiers, and a filter by country keep the list to what matters.
How the Deepvue Tools Fit Together
The four bracket a trade:
Before the trade, the Stats Table says what the company actually reported and whether growth is accelerating.
Also before it, the Earnings Calendar and Economic Calendar say what is scheduled that could move the stock or the whole market.
At the moment of entry, the Position Size Calculator turns the stop the chart gave you into a share count.
Put them on a customizable dashboard beside your chart, give them the chart’s color group, and the four checks become part of one screen.
Start with Deepvue and set up that screen tonight.
What Makes the Deepvue Tools Different
- ✓Trading utilities built into the platform, so the sizing, earnings and calendar checks happen next to the chart instead of in another tab.
- ✓Connected to the board, so the tools track whatever stock you have open.
- ✓Estimates and surprises included, with earnings estimates a quarter by quarter view rarely offered at this price.
- ✓Rules, not guesses, with the position cap and R multiple built into every sizing calculation.
The Deepvue comparisons hub covers how the platform stacks up against Finviz, TC2000, MarketSurge, TrendSpider and TradingView, one competitor per page.
What Traders Say About Deepvue
Outside opinions on Deepvue, quoted as written.
“Deepvue is the most economical and impressive trading platform I have used.”
Left on the App Store in November 2024. Apple App Store
“I believe DeepVue is purpose built for swing or position trading.”
u/DLightman1983, commenting in r/swingtrading. See the post
“Deepvue has way more options for screening.”
A MarketSmith subscriber comparing the two platforms. r/CANSLIM discussion
“One of the best trading tools out there and I can’t trade without it.”
Joshua Fong on Google Play, November 2025. Google Play reviews
The Deepvue reviews wall sums it up: 220 plus verified reviews, a 4.8 average and a 97 percent recommendation rate.
Deepvue’s Other App Groups
- •Core Features: the everyday essentials, the AI Terminal, charts, the screener, watchlists and alerts.
- •Visualizations: pictures of a whole universe, from the Performance Chart and Mini Chart to the Bubble Chart and Heat Map.
- •Research: market context, from breadth and themes to Industry Ranks, Stage Analysis and the Market Brief.
- •Outside the catalog: the Model Book module plus every dashboard you build, all listed on the Deepvue features hub.
What the Deepvue Tools Cost
All four tools come with Deepvue’s single plan at $49 per month, with monthly and annual options. None is sold separately, and no higher tier exists to unlock anything.
That one plan covers:
- •The screener and its 1,152 data points.
- •Charts, watchlists, and alerts, all of them unrestricted.
- •Fully customizable dashboards, with every app in the catalog.
- •The Theme Tracker, Market Brief, and AI Terminal, the last with unbounded usage.
Deepvue has one plan, so there are no tiers to compare. For reference, MarketSurge, the legacy platform in this niche, runs $149 per month.
New subscribers also get a one on one onboarding session with a Deepvue team member, an onboarding email series covering platform features and use cases, and weekly live webinars that each go deep on one part of the platform.
Plan Every Trade With the Deepvue Tools
Four narrow tools, and between them the difference between a plan and a guess: what the company reported, what is on the schedule, and exactly how many shares your rule allows.
Stop guessing at size and getting surprised by earnings. Sign up for Deepvue at $49 a month and put all four on your first dashboard.
↑ Back to contentsFrequently Asked Questions
Short answers on the four tools.
What are the Deepvue tools?
The Deepvue tools are the four apps grouped under Tools in the app catalog: the Stats Table, the Position Size Calculator, the Earnings Calendar and the Economic Calendar. Each does one specific job next to your chart.
What tools do you need for stock trading?
The tools you need for stock trading start with a screener, charting, a watchlist and a broker. Beyond those, the narrow ones repay their place: a way to convert a stop into a number of shares and calendars for what is scheduled; Deepvue covers both in its Tools group.
How is position size calculated?
Position size is calculated by dividing the dollars you are willing to lose by the distance between your entry and your stop. A cap on any single holding matters too, because sizing from risk alone can balloon when the stop is very close; the Deepvue calculator applies both.
What is position sizing and why does it matter?
Position sizing is deciding how many shares to buy so a failed trade loses a fixed amount you chose in advance. It matters because guessing at size makes every trade risk something different; the Deepvue Position Size Calculator applies the same rule every time.
How is an earnings calendar different from an economic calendar?
An earnings calendar is different from an economic calendar in scope: company versus macro. The Deepvue Earnings Calendar shows which companies report and how they did; the Economic Calendar lists data releases alongside their forecast and previous readings, the prints that can move the whole market.
Why is the earnings calendar important for traders?
The earnings calendar is important for traders because a forgotten report can ambush a position. Holding through earnings should be a decision, and the Deepvue Earnings Calendar shows which names report this week and how recent reports landed.
How do economic releases affect stocks?
Economic releases affect stocks through the gap between what was expected and what printed. A number in line with forecast rarely moves much; the surprise does. The Deepvue Economic Calendar shows actual, forecast and previous side by side.
What does the Stats Table show?
The Stats Table shows a company’s earnings and sales history, quarterly or annual, with growth rates, forward estimates and the surprise on hover. Deepvue offers it as a dashboard app and builds it into the Screener and Watchlist modules under the chart.
Are the tools included in the standard plan?
Yes, the tools are included in the standard plan. Deepvue has a single plan at $49 per month that covers all four tools along with the screener, charts, watchlists, alerts, dashboards, the Theme Tracker, the Market Brief, and the AI Terminal.