Stock Screener by Pattern
A stock screener by pattern organizes screening around the setup you trade: a tightening base, a volume footprint inside it, a gap on news or a breakout to an all time high. Deepvue screens each one by measuring the condition that creates the pattern instead of guessing at its shape. A dedicated page covers each setup, all on one $49 monthly plan.
Key Takeaways
Chart patterns are how growth traders read supply and demand. Finding them is the hard part: thousands of stocks, a handful of constructive bases, and a weekend spent flipping charts to spot them.
Deepvue’s screener turns that search into queries. Every pattern gets a preset built on what can actually be measured, and charts, lists and alerts share one window with the results.
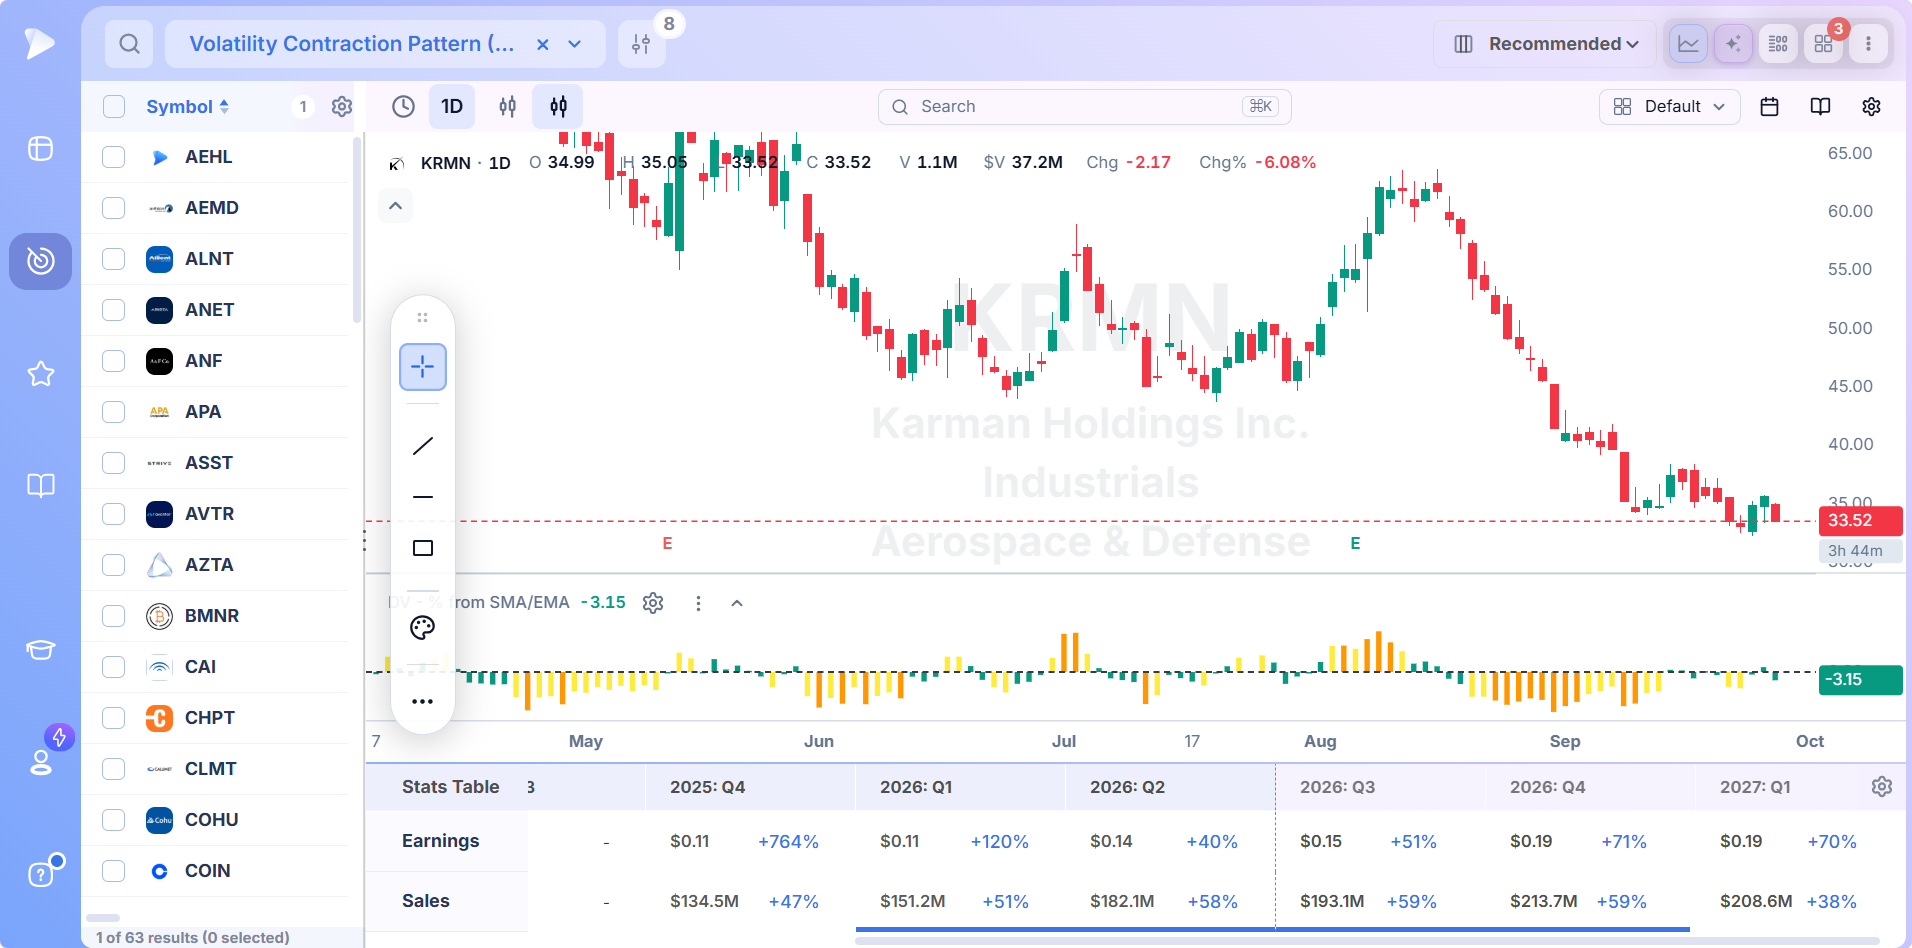
- ✓Every pattern here has a measurable core, and the screen tests that core instead of the shape
- ✓VCPs come down to tightness, pocket pivots to a volume comparison, gap ups to the close and green lines to all time highs
- ✓All four are continuation patterns that form in stocks already leading
- ✓A screen returns candidates, and the chart still decides which ones are trades
- ✓Every preset is one click away, and saving a copy opens up each threshold
- ✓Every pattern screen is included for $49 a month, where MarketSurge charges $149
Stock Screener by Pattern: Pick Your Setup
Each setup has its own page covering what the pattern is, how Deepvue screens for it and how to trade what comes back.
Volatility Contraction Pattern Screener
Mark Minervini’s VCP, screened by tightness instead of geometry. The page covers RMV, Deepvue’s proprietary relative measured volatility score, the 15 and 5 bar lookbacks, the Power and Tightening preset and what a low reading can’t tell you.
Pocket Pivot Screener
Chris Kacher’s volume signature inside a base: an up day whose volume outweighs every down day of the previous two weeks. The page covers the conditions the volume rule misses, the last hour buy point and adding on continuation pivots.
Buyable Gap Up Screener
The Morales and Kacher gap setup, filtered for a real gap, heavy relative volume, an existing uptrend and a strong close, the part most gap lists skip. The page covers the intraday low as your risk point and where the episodic pivot overlaps.
Green Line Breakout Screener
Dr. Eric Wish’s breakout to an all time high after a rest of three months or more, run as a Top Traders preset. The page covers plotting the line on monthly bars, the volume run rate and why a close back under the line ends the trade.
Every Chart Pattern Has a Measurable Core
What are chart patterns, really? Shapes, and shapes are hard to put in a filter. Most screeners approximate them with moving averages and percentage thresholds, which misses more setups than it finds.
The better route is to screen for the condition that creates the shape. Every setup in the hub has one:
| Pattern | What you see on the chart | What the screen measures |
|---|---|---|
| VCP | Pullbacks shrinking from left to right | Volatility against the stock’s own average, through RMV |
| Pocket pivot | A tall volume bar inside a base | Up day volume against the heaviest down day of ten sessions |
| Buyable gap up | A price jump on news | How big the gap is, volume against average, the trend and the close |
| Green line breakout | A new high after months of rest | An all time high held three months, cleared on heavy volume |
Measure the core and the shape follows. That’s why a chart pattern screener built this way returns fewer, better candidates than a chart pattern scanner guessing at geometry.
Continuation Chart Patterns in the Life of a Leader
All four are continuation patterns: pauses in a stock already trending higher that resolve in the same direction. Read in order, they tell one story.
- •The base tightens. Supply dries up and the range contracts. That’s VCP territory.
- •Demand shows early. A pocket pivot leaves a volume footprint inside the base before any new high.
- •The breakout comes. Price clears resistance, and when that resistance is an all time high after three quiet months, it’s a green line breakout.
- •News reprices it. A gap on earnings and heavy volume can launch the next leg, which is the buyable gap up.
Those four are the swing trading chart patterns growth traders watch most, because each one marks a clear price where the idea is wrong. Run two or three of the screens together and you see where a stock is in its advance, not just whether it moved.
More Chart Patterns in the Preset Library
The four pattern pages cover the headline setups. The Technical presets carry more continuation chart patterns, each one click away:
- •3 Weeks Tight for three weekly closes clustered in a very narrow range
- •Inside Days and Double Inside Day for sessions trading inside the prior day’s range
- •Bullish Outside Day for a session that engulfs the prior day’s range and closes strong
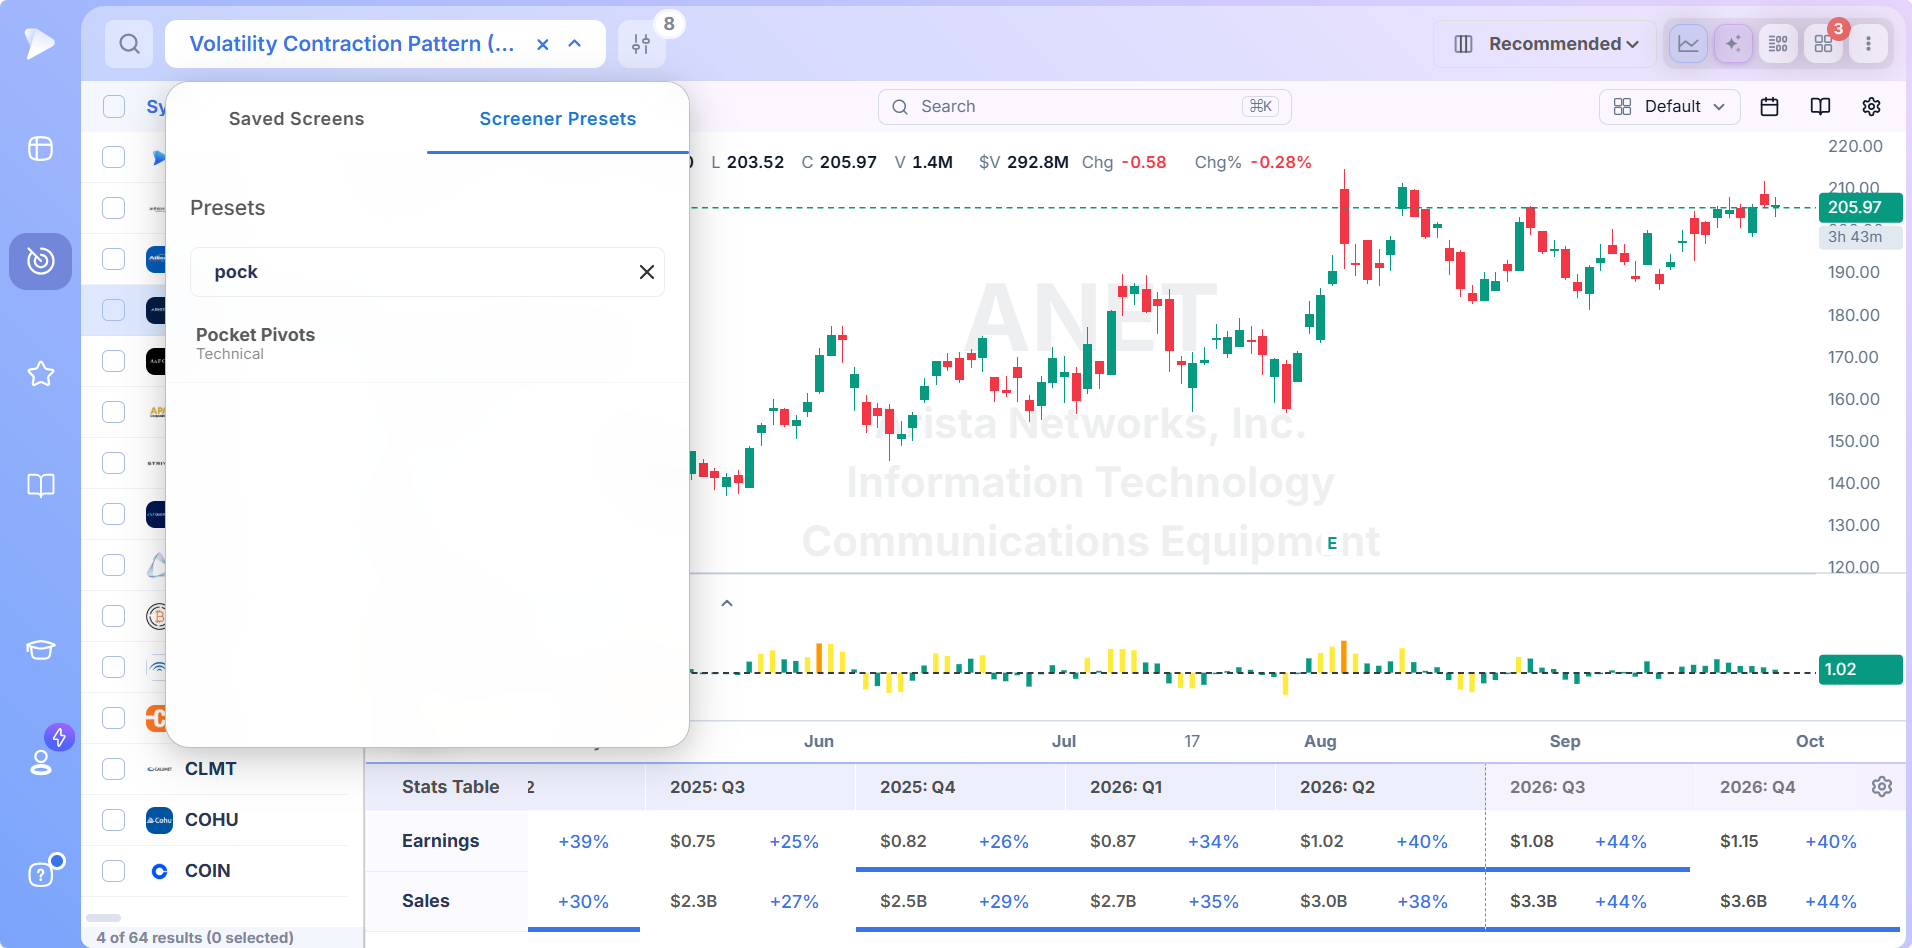
Presets are locked so the originals stay intact. Duplicate any of them and it becomes your own stock pattern screener, tuned to the thresholds you trade.
From Pattern to Position
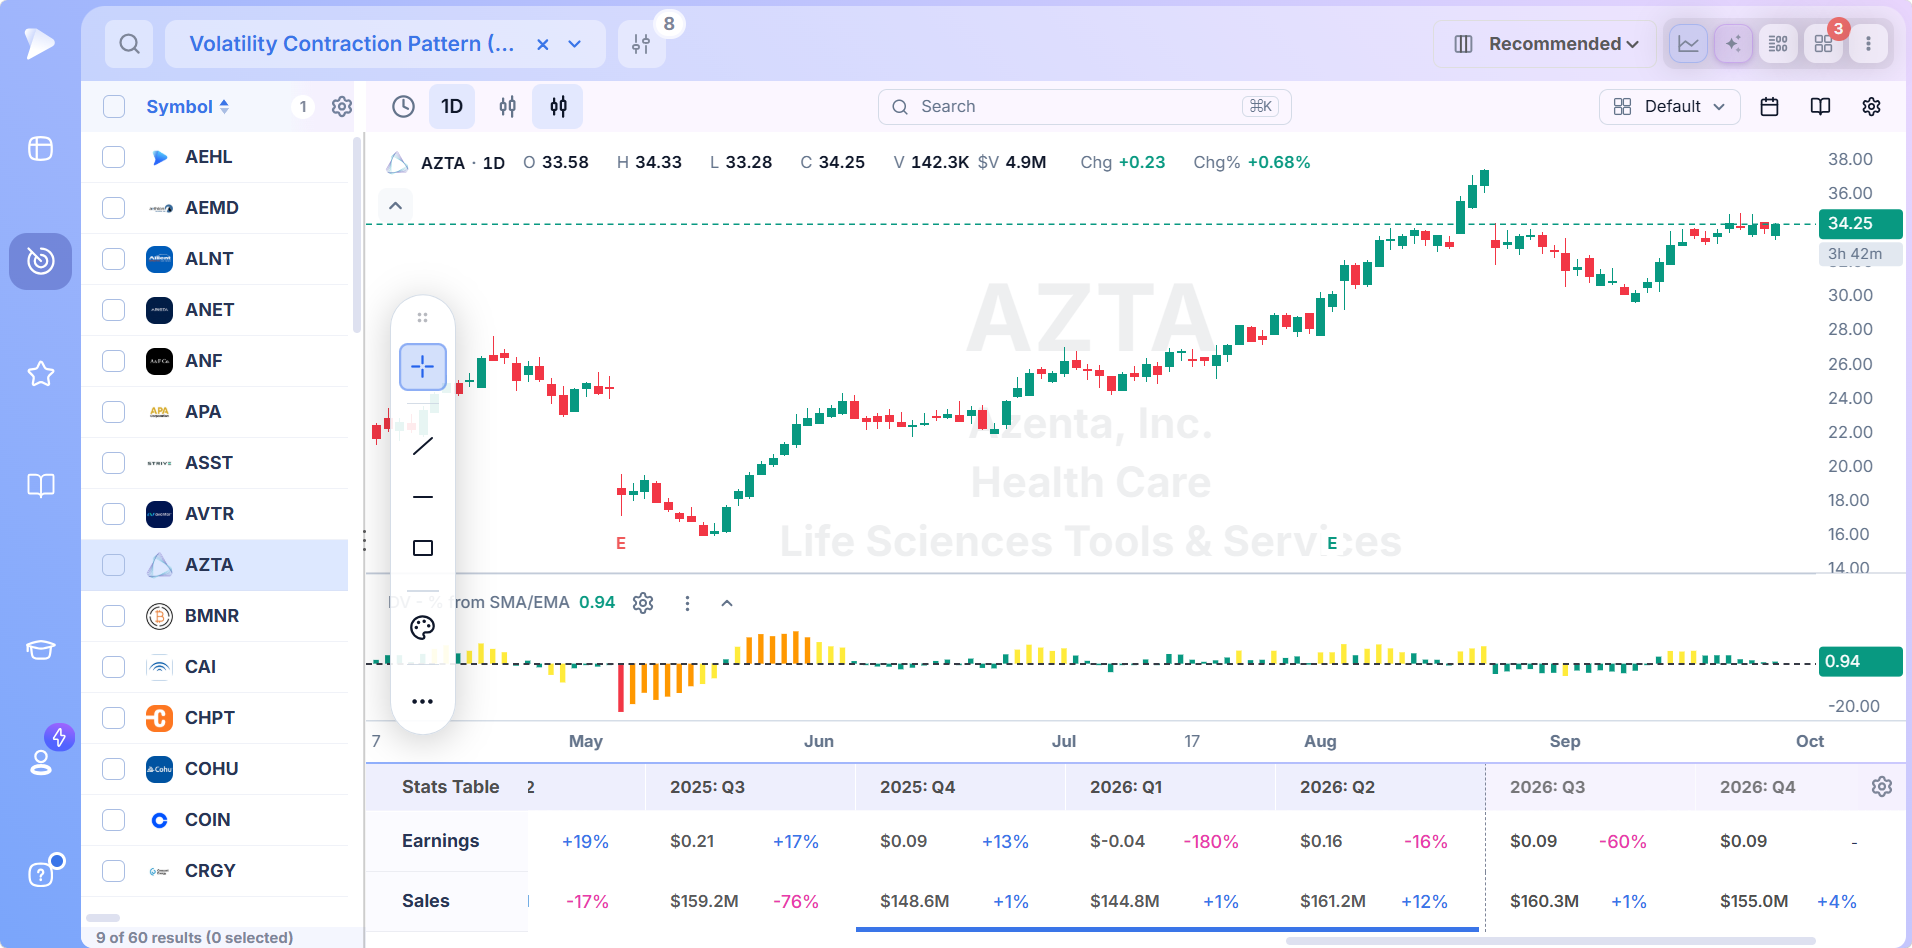
Finding the pattern is step one, and the same window handles the rest. Select a result and its chart opens beside the list, with quarterly earnings and sales underneath.
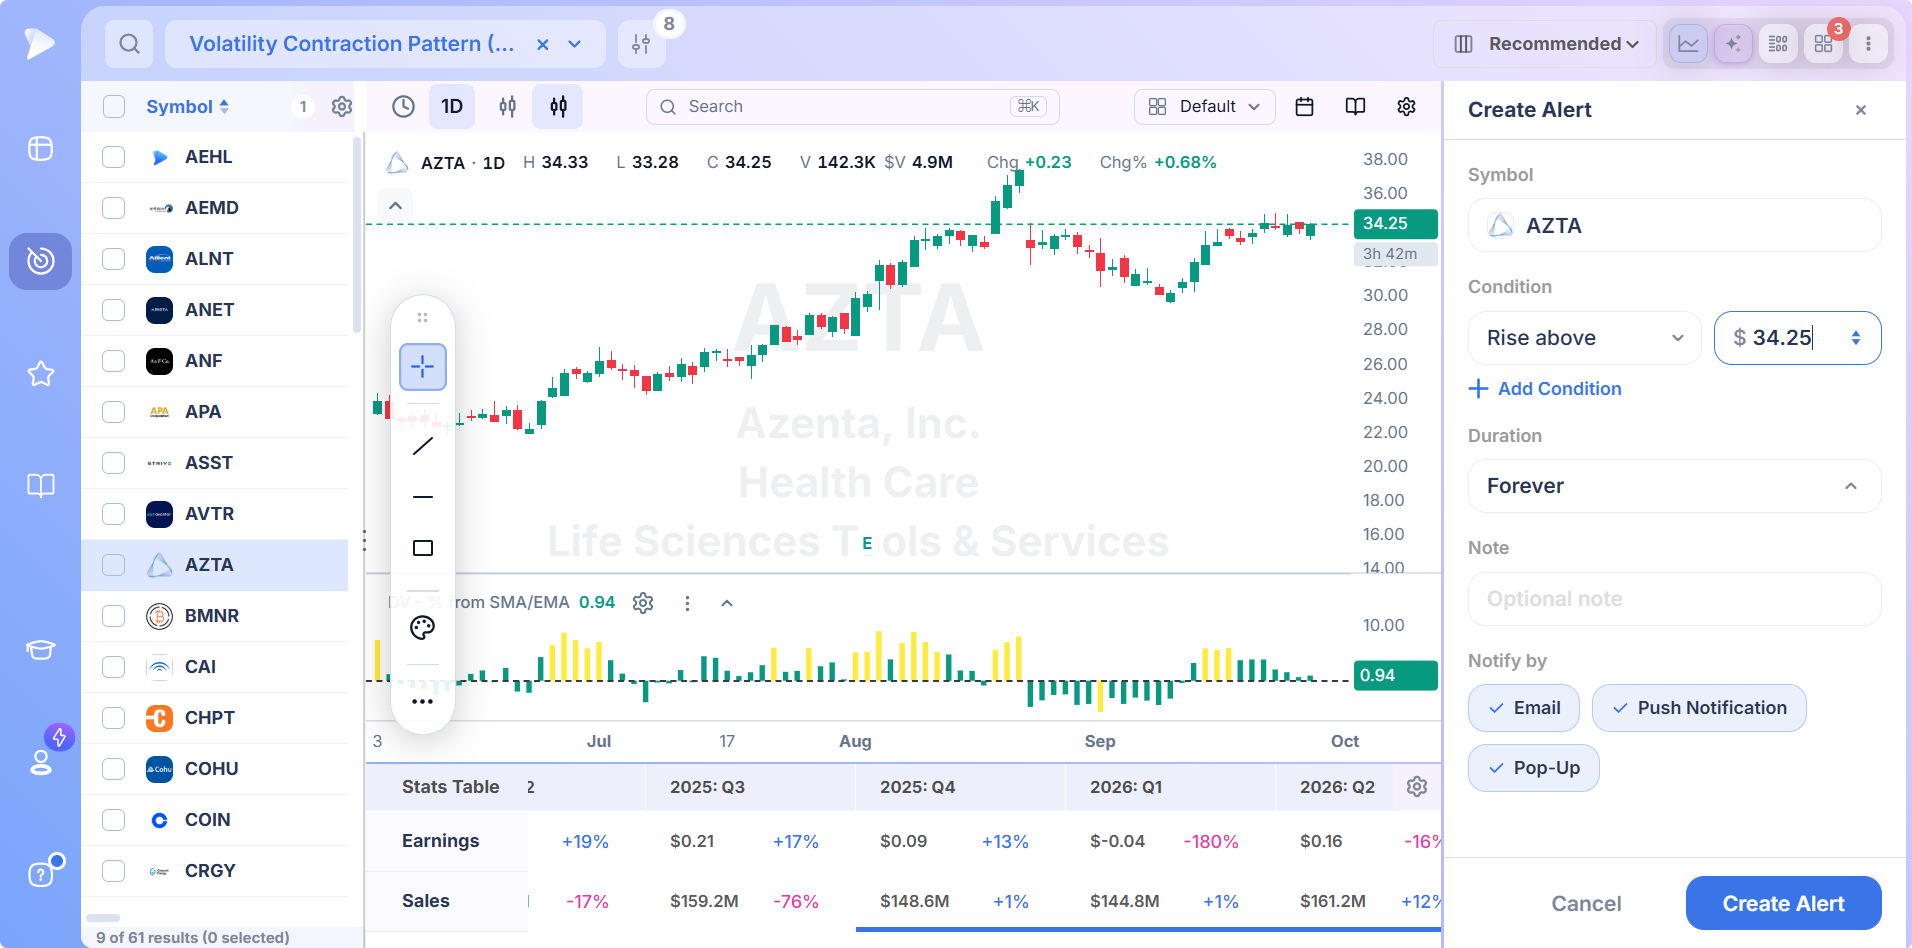
File candidates in a watchlist, then set alerts at the level each pattern defines: the pivot, the green line or the gap day low. The position size calculator turns that level into a share count.
Describe the setup in plain words and the AI Terminal drafts the filters for you.
When a Pattern Recognition Tool Fits Better
Deepvue screens for the conditions behind a pattern rather than labeling shapes on every chart. If you want bases drawn and named for you automatically, chart pattern recognition software such as MarketSurge’s pattern recognition or TrendSpider’s automated analysis is built for that job.
The trade off is what each answers. Stock pattern recognition tells you a shape exists. A condition based screen tells you whether the base is tight, whether demand is showing and whether volume confirms. For traders who make the final call on the chart themselves, a stock pattern screener built on conditions is the half worth automating.
Who a Pattern Screener Is For
- •CANSLIM® and growth traders buying constructive bases in leading stocks
- •Swing and position traders holding moves for weeks to months
- •Anyone losing weekends to finding bases by eye, or who has outgrown a basic stock pattern scanner
- •Followers of Minervini, Kacher and Morales or Dr. Wish who want those methods screened
- •Traders who want tightness, volume and fundamentals checked in one query
Pricing
Every pattern screen comes on one plan, priced at $49 a month.
- •All four pattern presets and the full Technical library, yours to adjust after duplicating
- •RMV and the other proprietary indicators, on charts and as screener conditions
- •A field library of 1,152 data points, so pattern, volume and growth conditions combine
- •Charts, watchlists, alerts and live data, from pattern to pivot in one window
MarketSurge, by comparison, costs $149 a month.
New subscribers begin with a personal onboarding call, a sequence of setup emails and a weekly live webinar.
Screen the Setup, Then Read the Chart
Patterns are how the market shows its hand, and a stock screener by pattern shows you more of them sooner than any stock pattern scanner working from shapes alone. Start with the setup you trade most.
When the hour matters more than the shape, see stock screener by market timing. Indicator driven scans have their own hub, screener by indicator.
↑ Back to contentsFrequently Asked Questions
What is a stock screener by pattern?
A stock screener by pattern is a screener organized around chart setups such as volatility contraction patterns, pocket pivots, buyable gap ups and green line breakouts. Deepvue screens each one by measuring the condition behind the pattern, with a preset for every setup.
Can you screen stocks for chart patterns?
Yes, you can screen stocks for chart patterns when the chart pattern scanner measures what creates them, such as tightness, volume signatures or all time highs. Filters that only approximate shapes miss most setups, which is why Deepvue’s pattern presets measure the underlying conditions directly.
What are chart patterns?
Chart patterns are recurring price and volume formations, such as bases, flags and breakouts, that show how supply and demand are balancing in a stock. Growth traders use them to time entries, and Deepvue’s chart pattern screener finds the ones built on measurable conditions.
How many chart patterns are there?
There are dozens of named chart patterns, from cups and flat bases to flags, wedges and double bottoms. Growth traders tend to focus on a handful of continuation patterns, and Deepvue covers the core ones with dedicated screens plus more in its Technical presets.
What are the most reliable chart patterns?
The most reliable chart patterns for growth traders are continuation setups in leading stocks, such as tight bases and breakouts to new highs on heavy volume, though no pattern works in every market. Deepvue lets you pair each pattern with leadership and volume conditions.
What are the best chart patterns for swing trading?
The best chart patterns for swing trading are those with a clear risk point: tight bases, pocket pivots, gap ups that hold and breakouts above well defined highs. Each gives a nearby level for the stop, and Deepvue screens all four swing trading chart patterns and alerts you at that level.
What are continuation patterns?
Continuation patterns are pauses in an existing trend that resolve in the same direction, such as bases, flags and tight consolidations. They’re central to growth stock trading, and every screen in Deepvue’s pattern collection is built around one.
How do you read stock chart patterns?
You read stock chart patterns by checking the trend first, then how the base forms: shrinking pullbacks, drying volume and a clear pivot. Volume on the breakout confirms it. Deepvue pairs every chart with volume and earnings data so the read is complete.
What is chart pattern recognition software?
Chart pattern recognition software, sometimes called stock pattern recognition, scans price history and labels shapes like cups, flat bases and double bottoms automatically, as MarketSurge and TrendSpider do. Deepvue takes a condition based approach instead, screening for the tightness, volume and highs that make each pattern tradable.
Is the stock screener by pattern included in the Deepvue plan?
Yes, the stock screener by pattern and every pattern preset are part of Deepvue’s $49 monthly plan, alongside charting, watchlists, alerts and the AI Terminal. No setup is held back for a higher tier.
CAN SLIM® is a registered trademark of O’Neil Capital Management, Inc. (U.S. Reg. No. 3,081,940). Deepvue is not affiliated with, sponsored by, endorsed by, or licensed by O’Neil Capital Management, Inc., Investor’s Business Daily, MarketSurge, or their affiliates. Any reference to CAN SLIM® is for descriptive purposes only. Deepvue’s scores, ratings, and screeners are independently calculated by Deepvue and are not the proprietary ratings of MarketSurge or IBD.