The Technical Stock Screener With 15 Setups Ready to Run
A technical stock screener filters the market on what the chart is doing rather than what the company earns: tightness, volume, moving average structure, single bar signals. Deepvue ships 15 of those setups as presets in its Technical category, from William O’Neil’s 3 weeks tight to a high relative volume scan and a three moving average reclaim called Power of 3, each running on live data and each editable once copied. Behind them are 276 technical measures that work as both filters and columns. $49 a month.
Key Takeaways
Every technical setup worth trading has a definition. Three weekly closes inside a narrow band. A day that trades several times its normal volume while price rises. A stock that closes back above its 10, 21 and 50 day averages in one session. The definitions are not the hard part. The hard part is that on any given day a handful of stocks meet them, and they are scattered across several thousand charts.
Deepvue’s screener treats each of those definitions as a query. The Technical category collects fifteen of them as presets, so the tight bases, the volume surges and the moving average reclaims are on a list before the open instead of buried in a chart tour that never finishes.
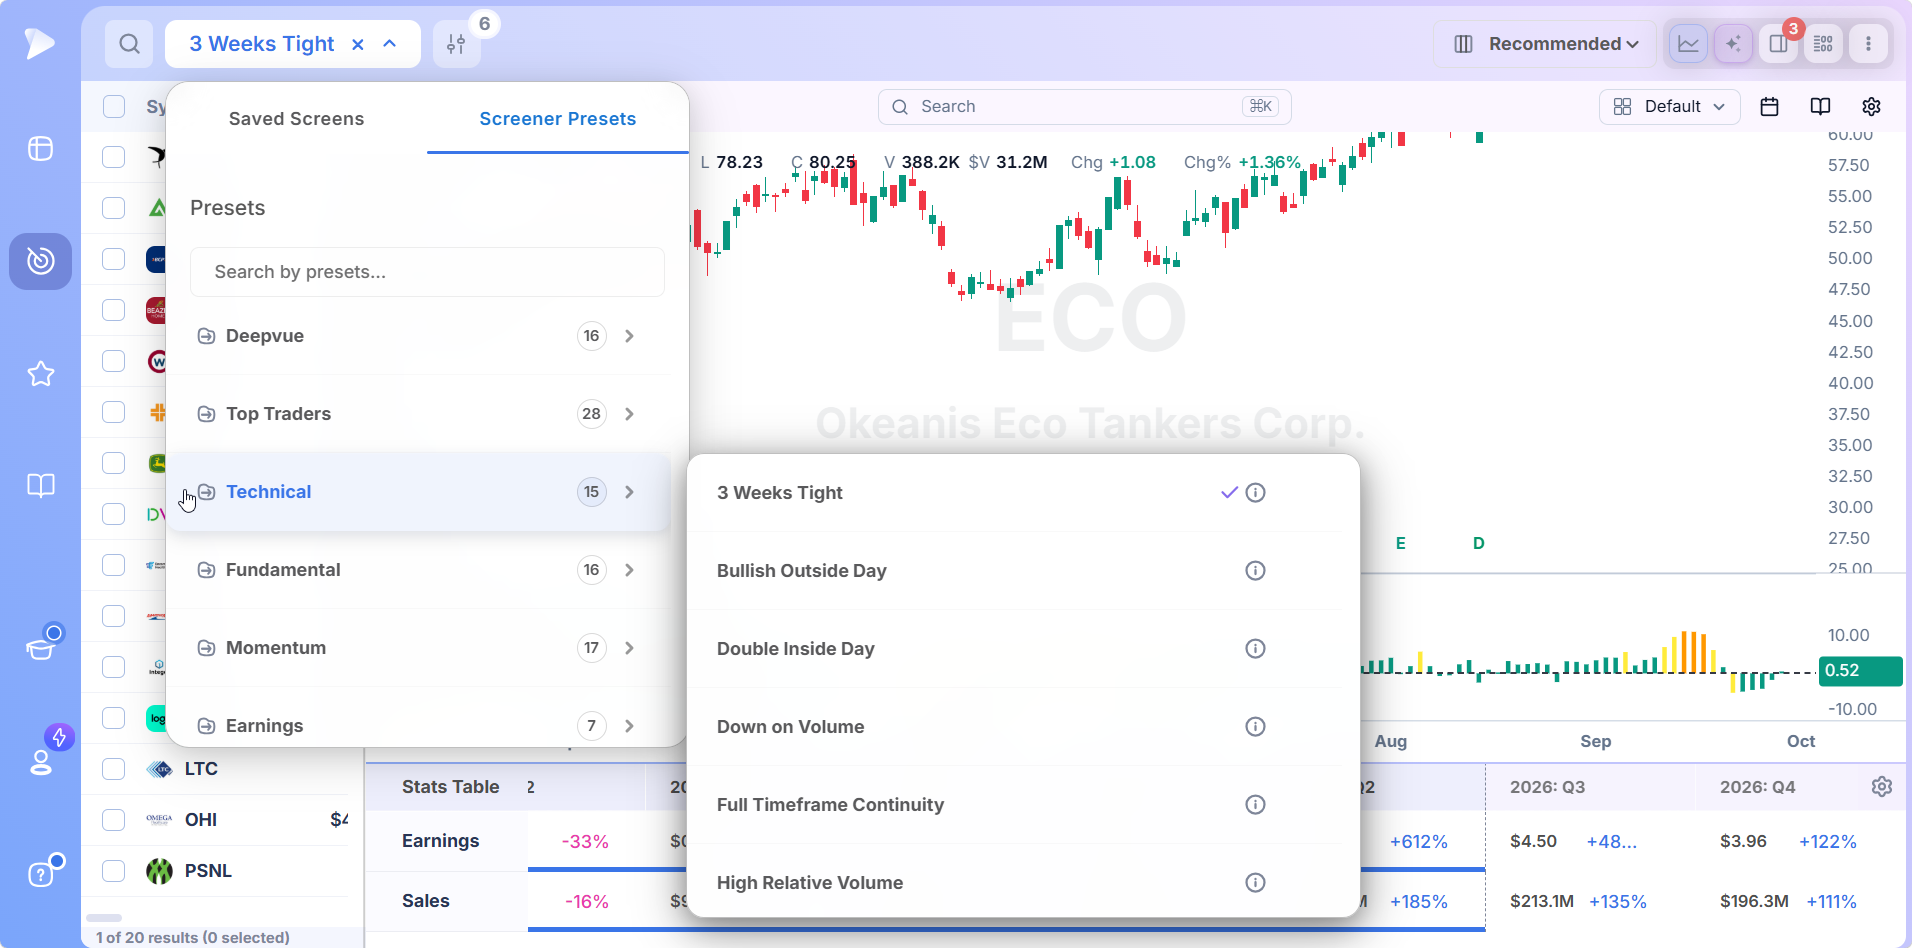
- ✓Fifteen technical presets cover consolidation, volume, moving average structure, single bar signals and a few special cases
- ✓Each one is defined in a sentence you can read on hover, and each becomes editable the moment you save a copy
- ✓Results carry closing range, relative volume and other readings as columns, so a list can be ordered as well as filtered
- ✓A split view chart shows each result with the setup visible, which is where a technical signal is confirmed or rejected
- ✓Any preset can be stacked with a fundamental, ownership or rating condition, since the same builder handles all 1,152 fields
- ✓One $49 a month plan covers every preset, the builder, charts, watchlists and alerts
What Is a Technical Stock Screener?
A technical stock screener evaluates price and volume behavior across every listed stock and returns the ones whose chart currently matches a defined setup.
Where a fundamental screen asks how fast earnings are growing, a technical screen asks whether the stock is coiling, breaking out, being accumulated or being sold, and it asks in numbers: range as a percentage, volume as a multiple of average, price relative to a moving average.
The numbers are what make the setup searchable. A trader can recognize three tight weekly closes by eye. A screener needs the same idea stated as a tolerance, and once it is stated the screener applies it to the whole market in the time the trader spends on one chart.
The Fifteen Technical Presets in Deepvue
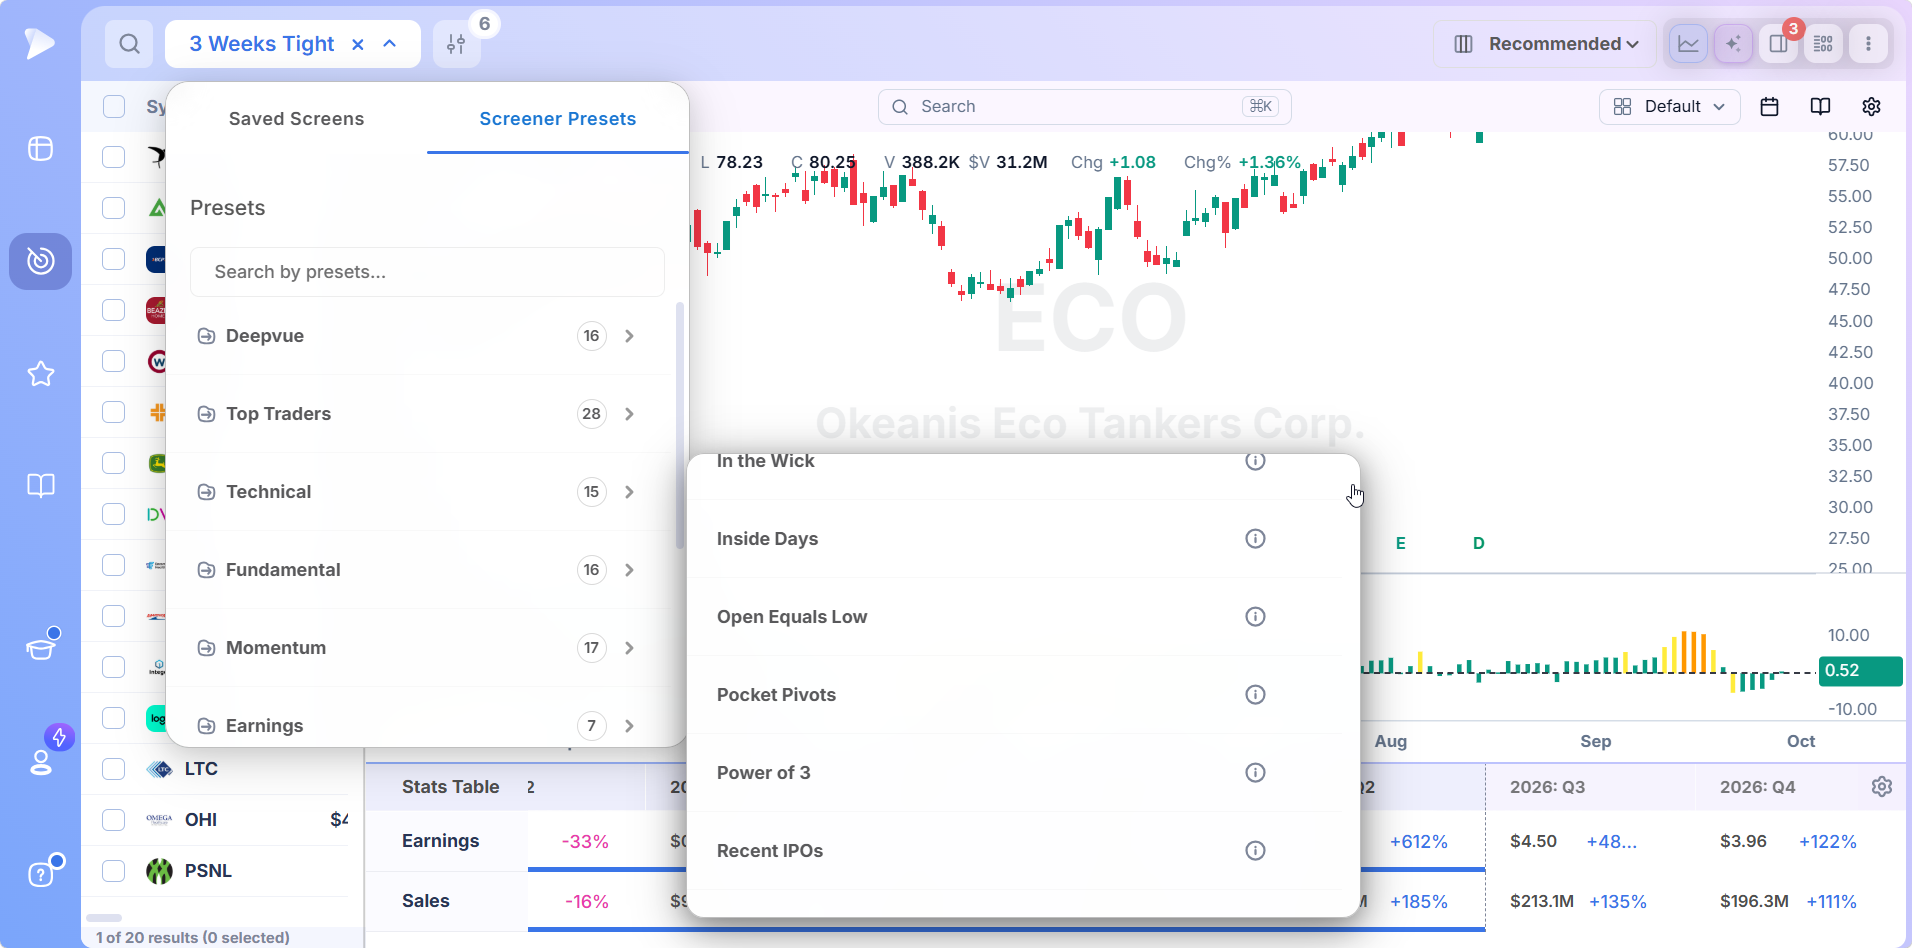
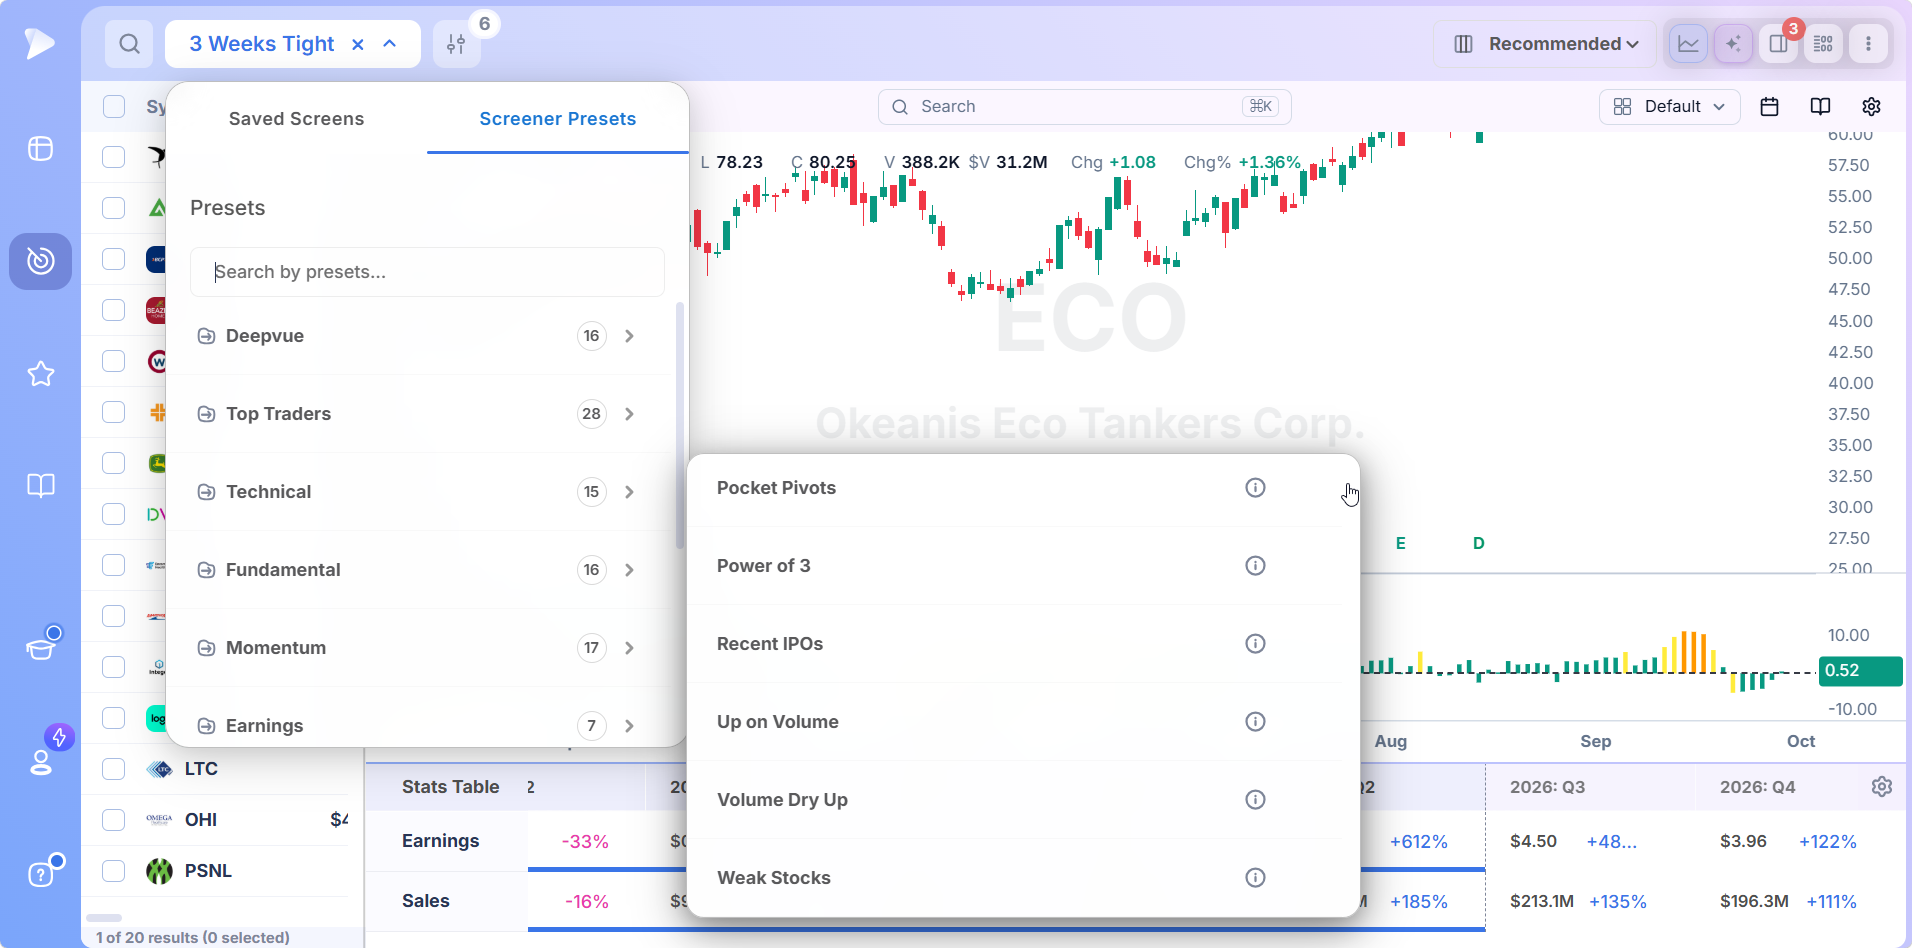
The Technical category groups screens by the kind of behavior they detect. Descriptions appear on hover in the app; the three examined in detail below are quoted from there.
| Behavior | Presets | What the group catches |
|---|---|---|
| Consolidation and tightness | 3 Weeks Tight, Inside Days, Double Inside Day, Volume Dry Up | Stocks compressing before a move: narrow ranges, bars inside prior bars, volume fading as sellers run out |
| Volume events | High Relative Volume, Up on Volume, Down on Volume | Sessions where participation jumped far above normal, on the buy side or the sell side |
| Moving average structure | Power of 3, Full Timeframe Continuity | Price reclaiming or aligned with its key averages across timeframes |
| Single bar signals | Bullish Outside Day, In the Wick, Open Equals Low | One session whose shape says something: an engulfing reversal, a close near a long wick, a low set at the open |
| Special cases | Pocket Pivots, Recent IPOs, Weak Stocks | Gil Morales’ volume signature, newly listed names, and the short side of the market |
3 Weeks Tight: O’Neil’s Continuation Setup
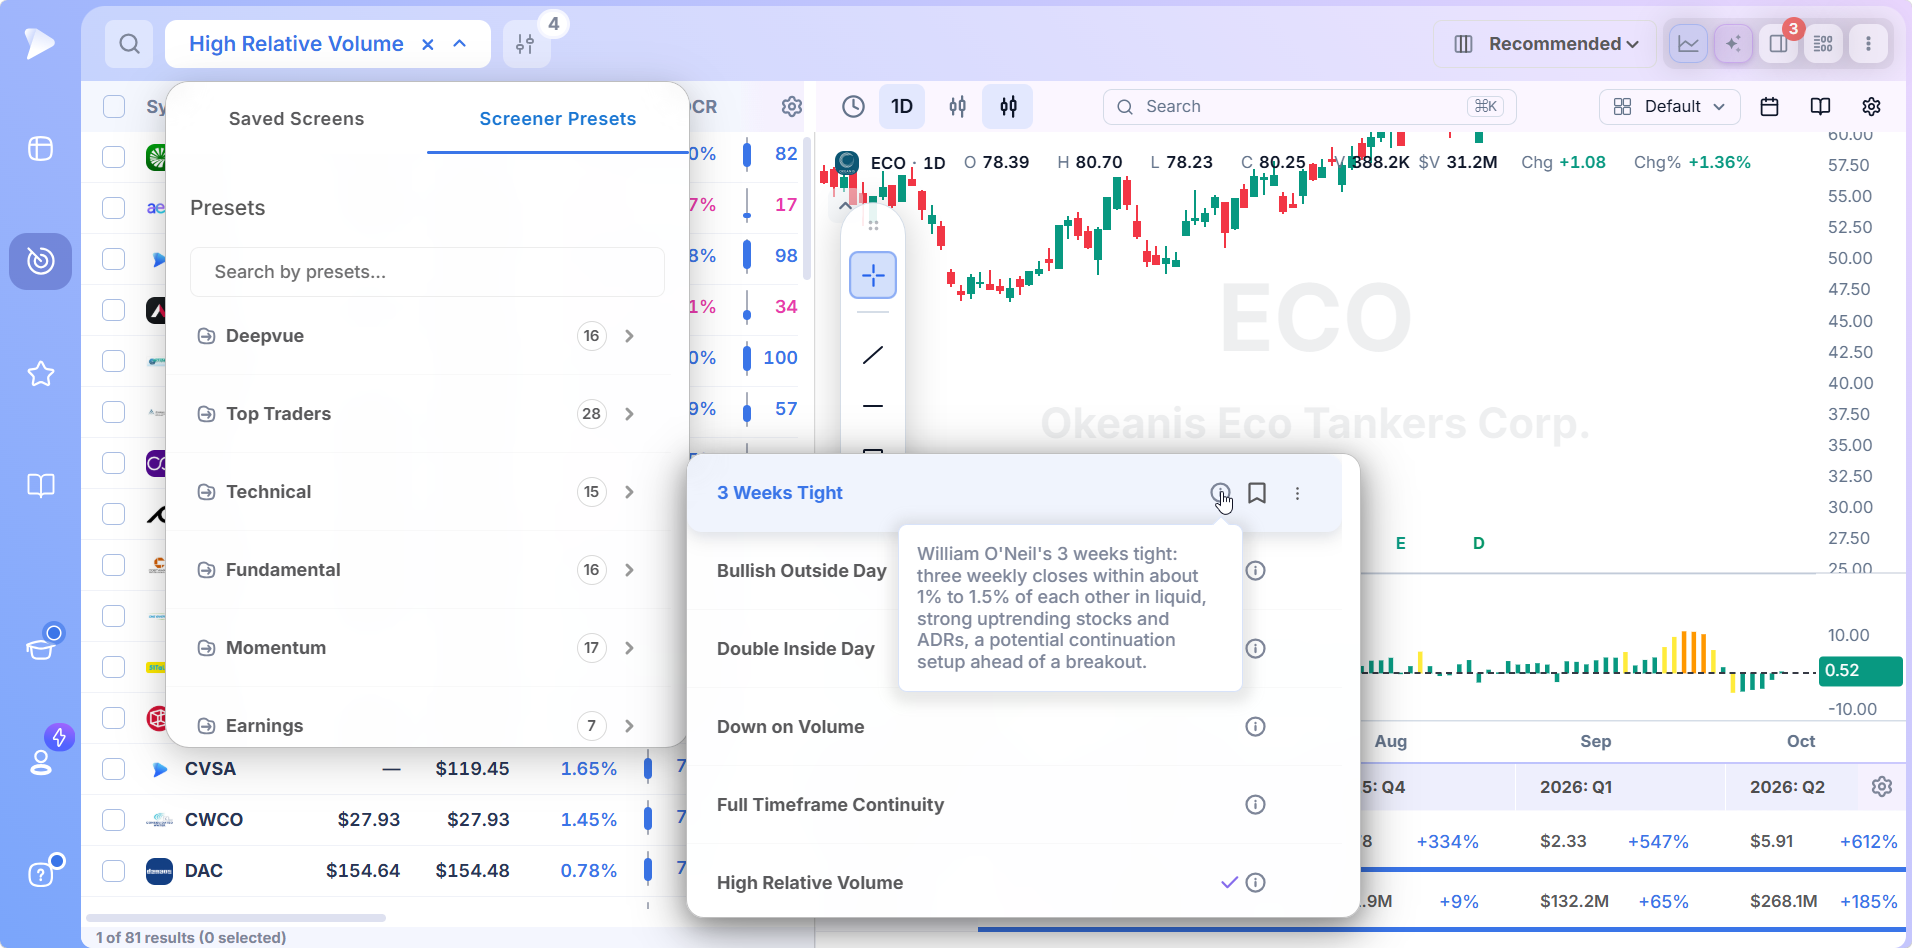
The preset description reads: William O’Neil’s 3 weeks tight, three weekly closes within about 1% to 1.5% of each other in liquid, strong uptrending stocks and ADRs, a potential continuation setup ahead of a breakout.
The pattern forms when a stock that has already advanced refuses to give ground for three weeks, which O’Neil read as institutions holding their shares and adding on any dip. The buy point is a move above the high of the tight area, and because the base is short and shallow, the stop is close.
High Relative Volume: Where the Money Went Today
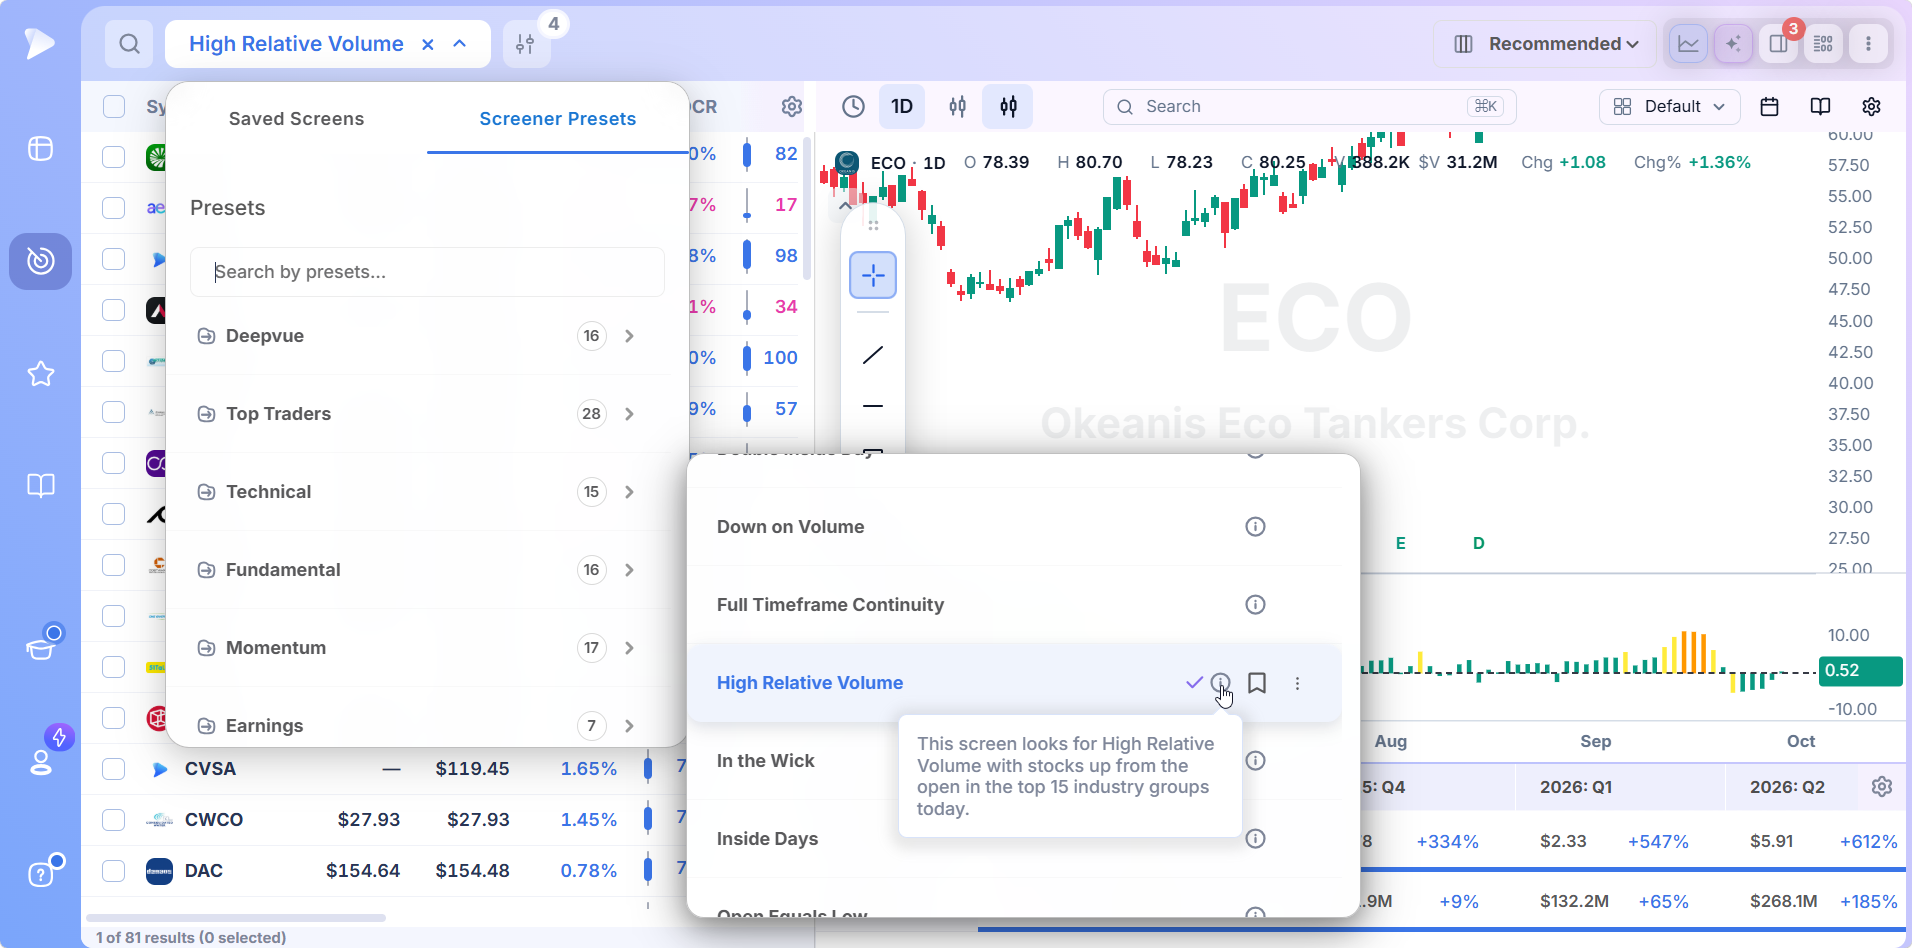
From the description: this screen looks for high relative volume with stocks up from the open in the top 15 industry groups today. Three conditions in one line. Relative volume finds the sessions that are unusual for that stock, the up from the open test drops the names being sold on the volume, and the industry group filter keeps the list inside the parts of the market leading the day. Volume in a leading group is how a rotation announces itself.
Power of 3: Three Averages Reclaimed in One Session
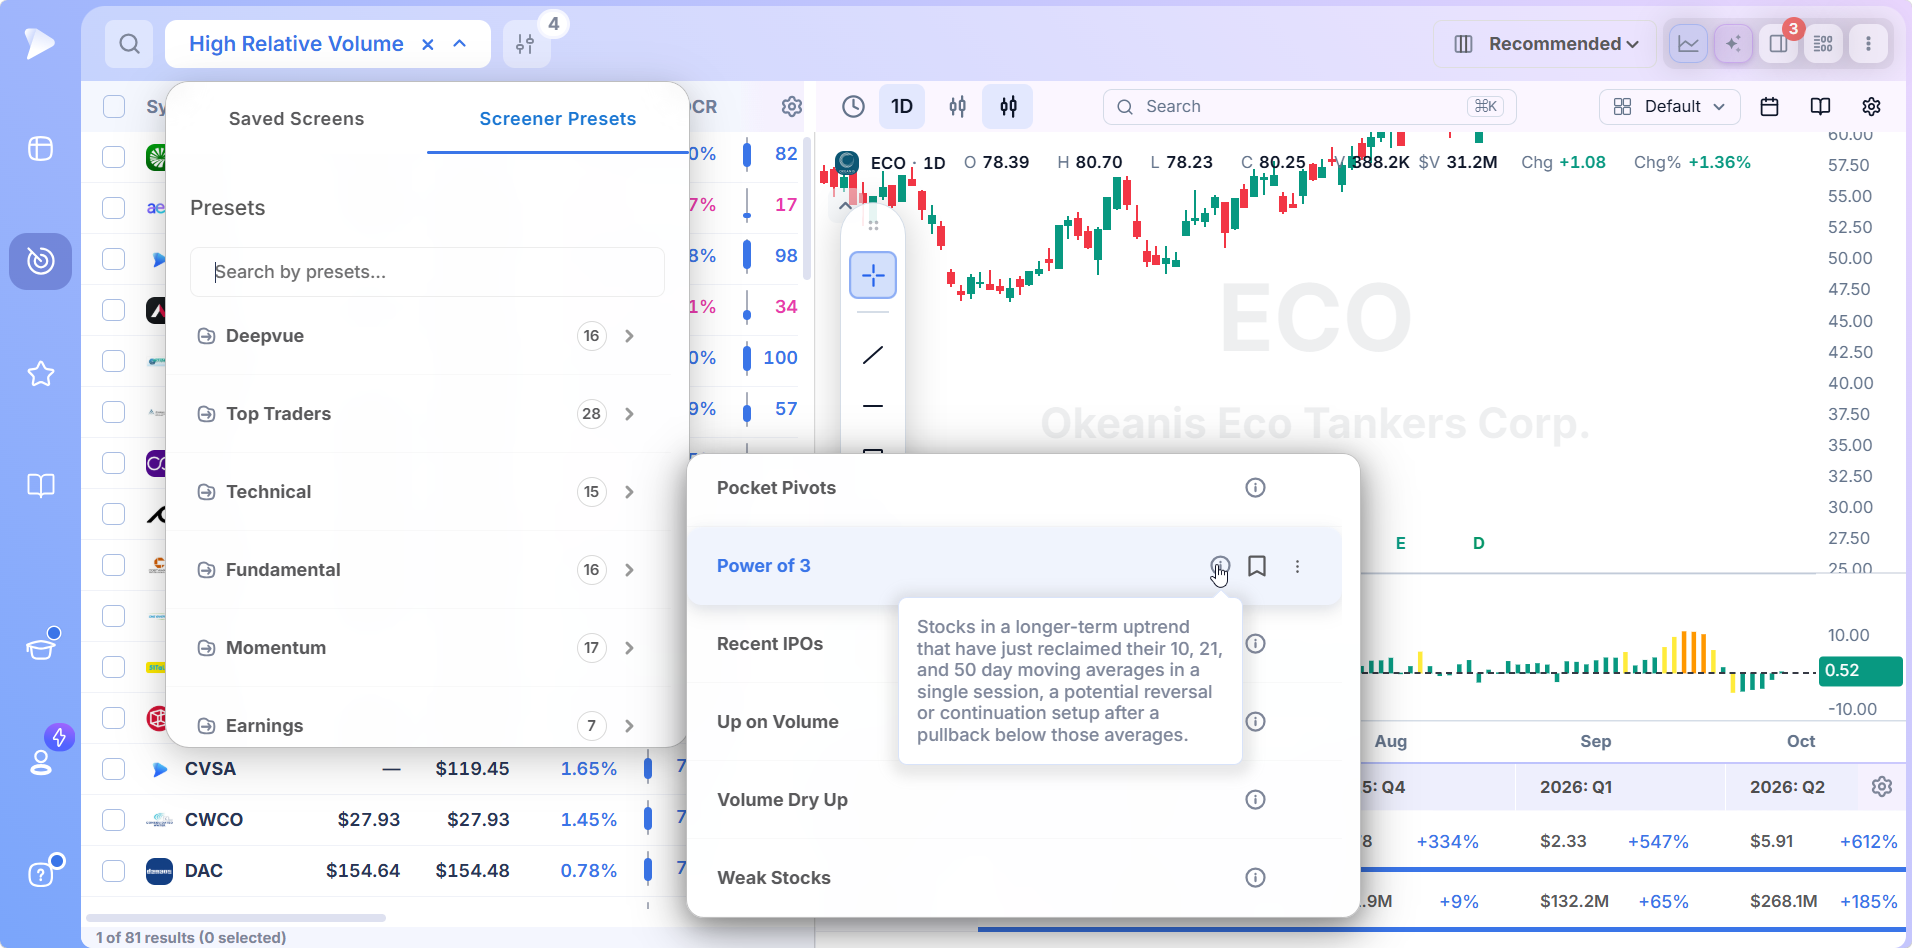
The description: stocks in a longer term uptrend that have just reclaimed their 10, 21 and 50 day moving averages in a single session, a potential reversal or continuation setup after a pullback below those averages.
A stock that fell through all three lines and then closed back above all three in one day has had a decisive change of hands. The setup is rare by construction, so the list is short and every name on it deserves a look.
Why Technical Setups Are Easy to Recognize and Hard to Find
Anyone who has read a chart book can spot a tight base or a volume spike on a chart in front of them. The difficulty is coverage. The setups that matter appear in perhaps a dozen stocks on a given day out of several thousand, and they do not announce which dozen. A trader flipping charts finds the ones in the names already followed and misses the rest, which is usually where the new leaders are.
A technical analysis screener reverses the order. It checks all several thousand first, then hands over the dozen. Coverage stops being a function of stamina, and the chart reading skill is spent on candidates instead of on the search.
Why Deepvue Is the Best Technical Stock Screener for Growth Traders
Plenty of screeners can filter on a moving average. The question is whether the setups you trade already exist as screens, whether the results tell you enough to rank them, and whether the chart is one click away. Deepvue answers yes to all three.
Fifteen Setups Already Written
Screener Presets is a tab in the menu that drops from the current screen’s name. Technical is one of nine categories alongside Deepvue, Top Traders, Fundamental, Momentum and Earnings, and its fifteen screens are listed with an info icon each. Hover for the definition, click to load. The presets are protected, so the definition never drifts; saving a copy is what makes it yours to change.
Results That Can Be Ranked
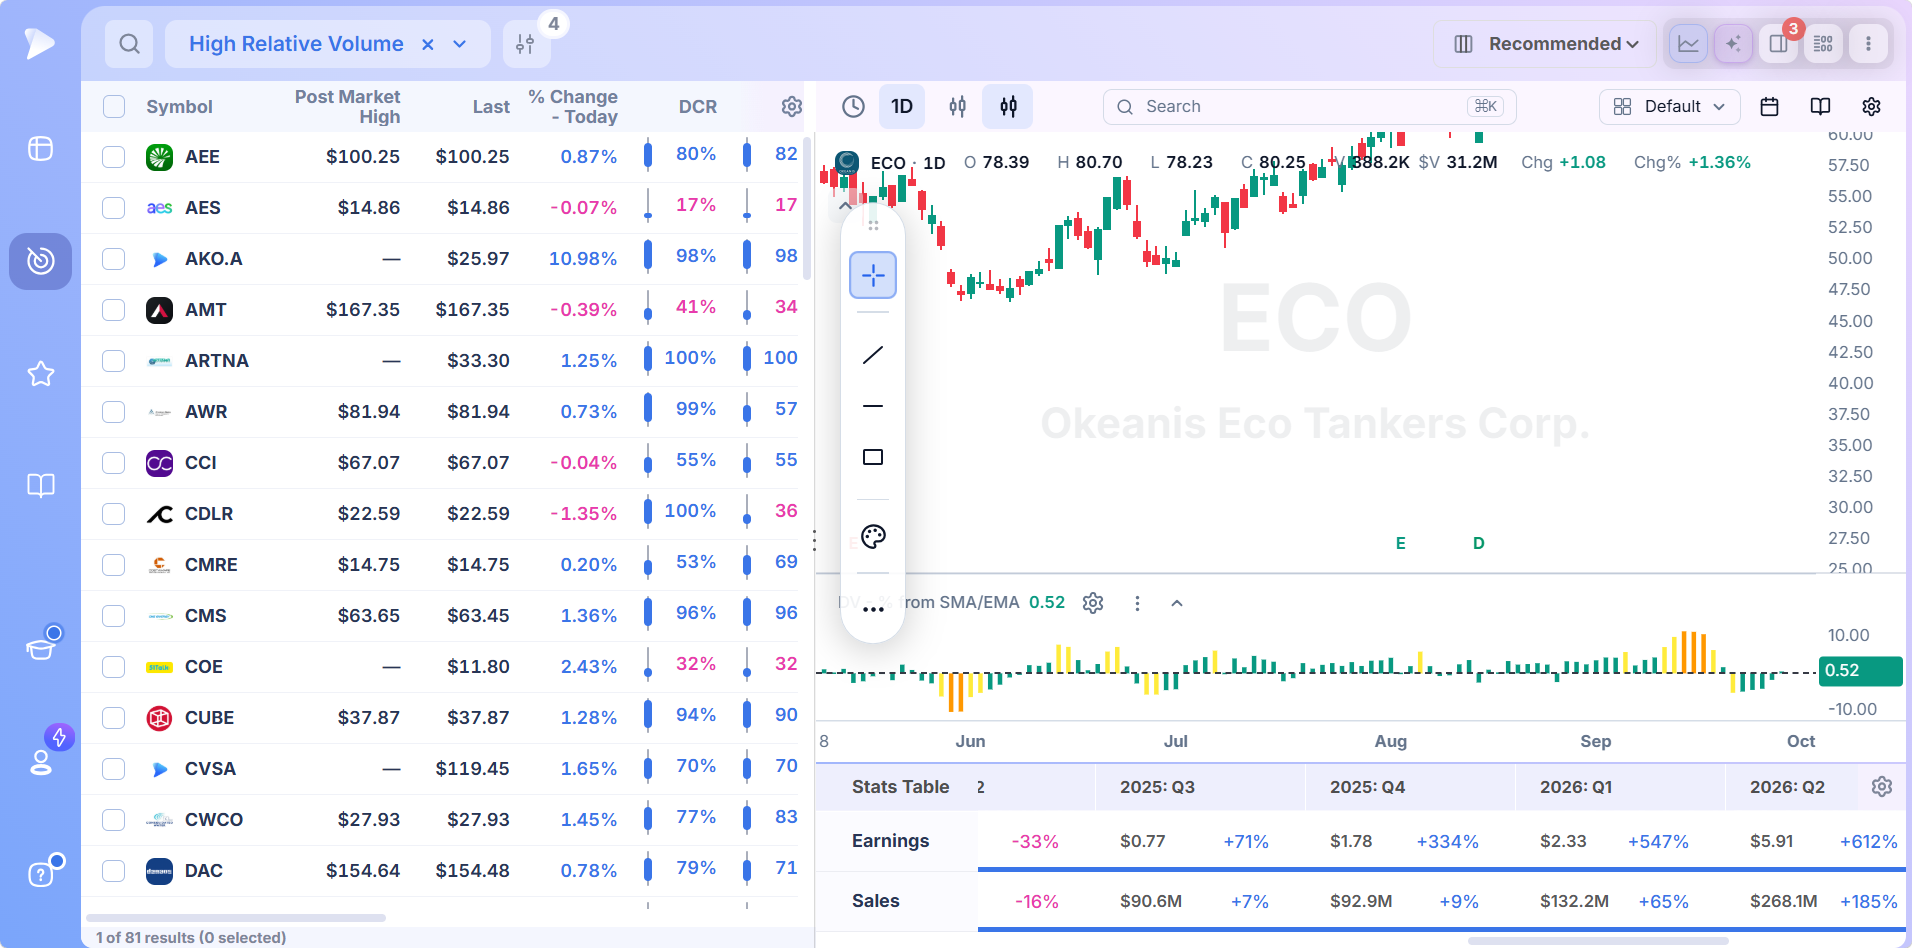
A technical screen returns the stocks that pass, and the recommended columns show how well each one passed. Daily and weekly closing range are the first two to read: a 3 Weeks Tight name closing near its weekly high is tighter and stronger than one closing near the bottom of its band. Percent change and post market high add the day’s context, and the relative volume field ranks the volume screens by intensity.
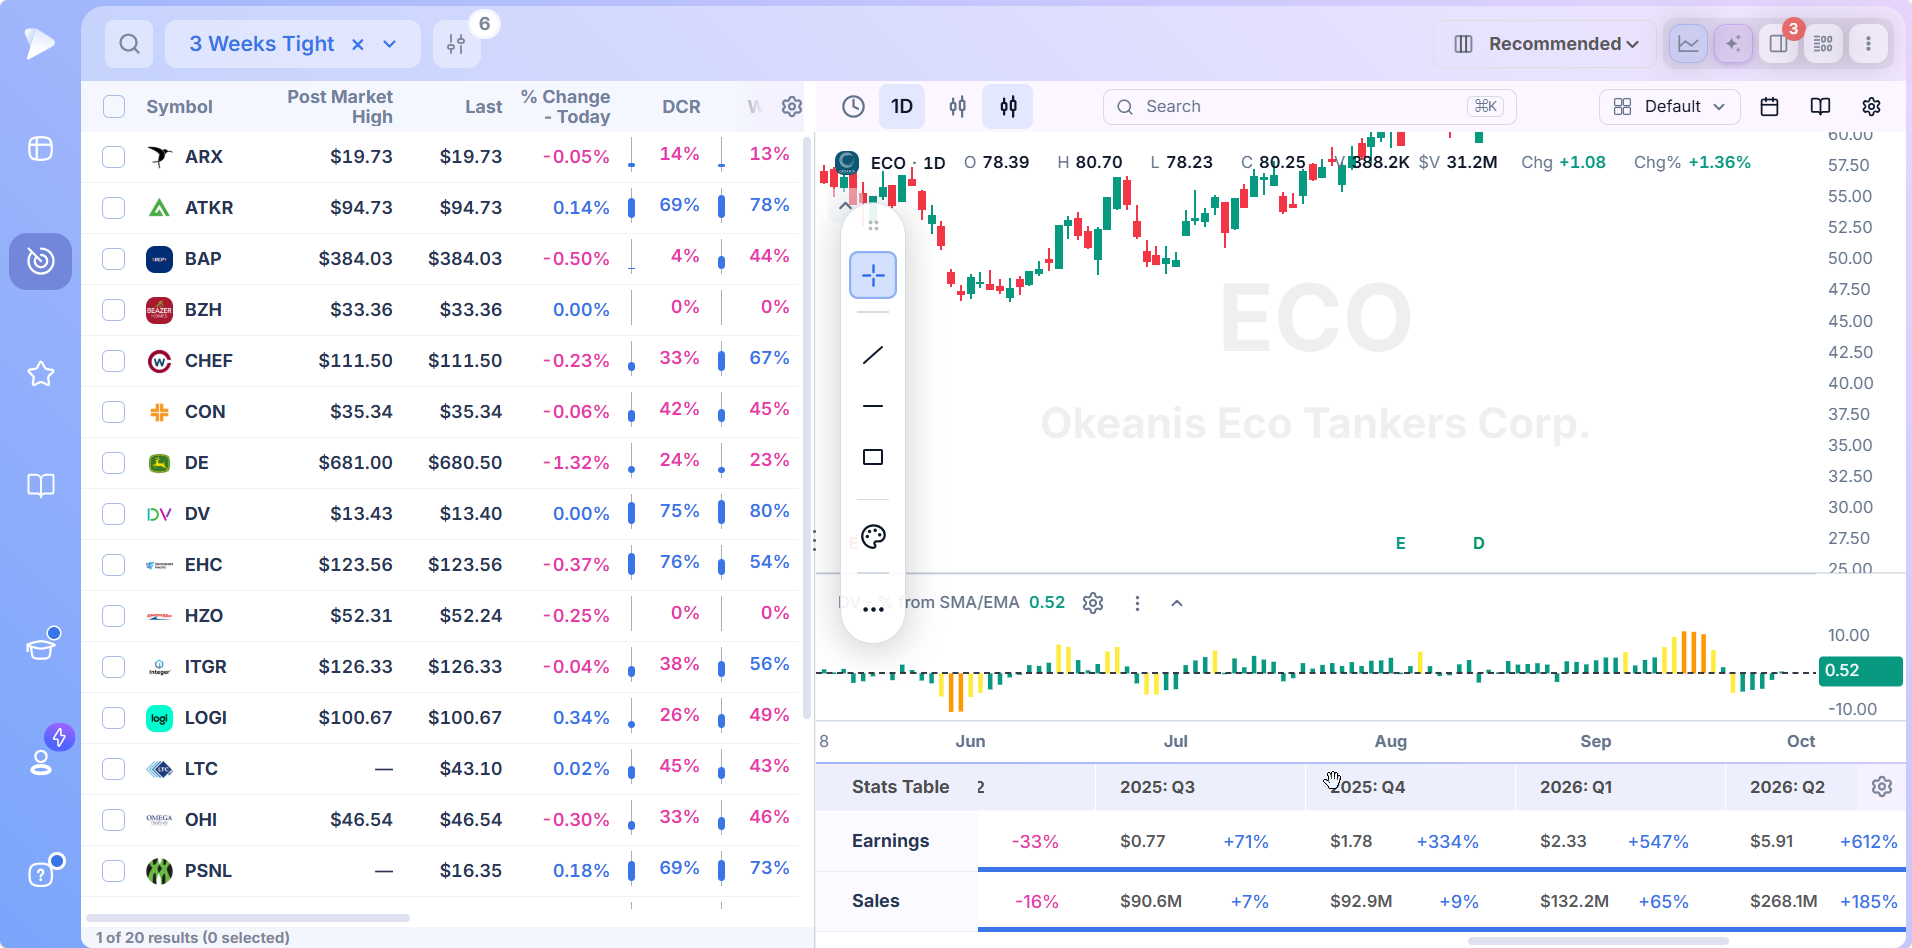
The list length varies with the setup. A broad volume screen can return dozens of names on a busy session, while a moving average reclaim might return two. Both are correct; the short list is the more urgent one.
The Chart Confirms the Signal
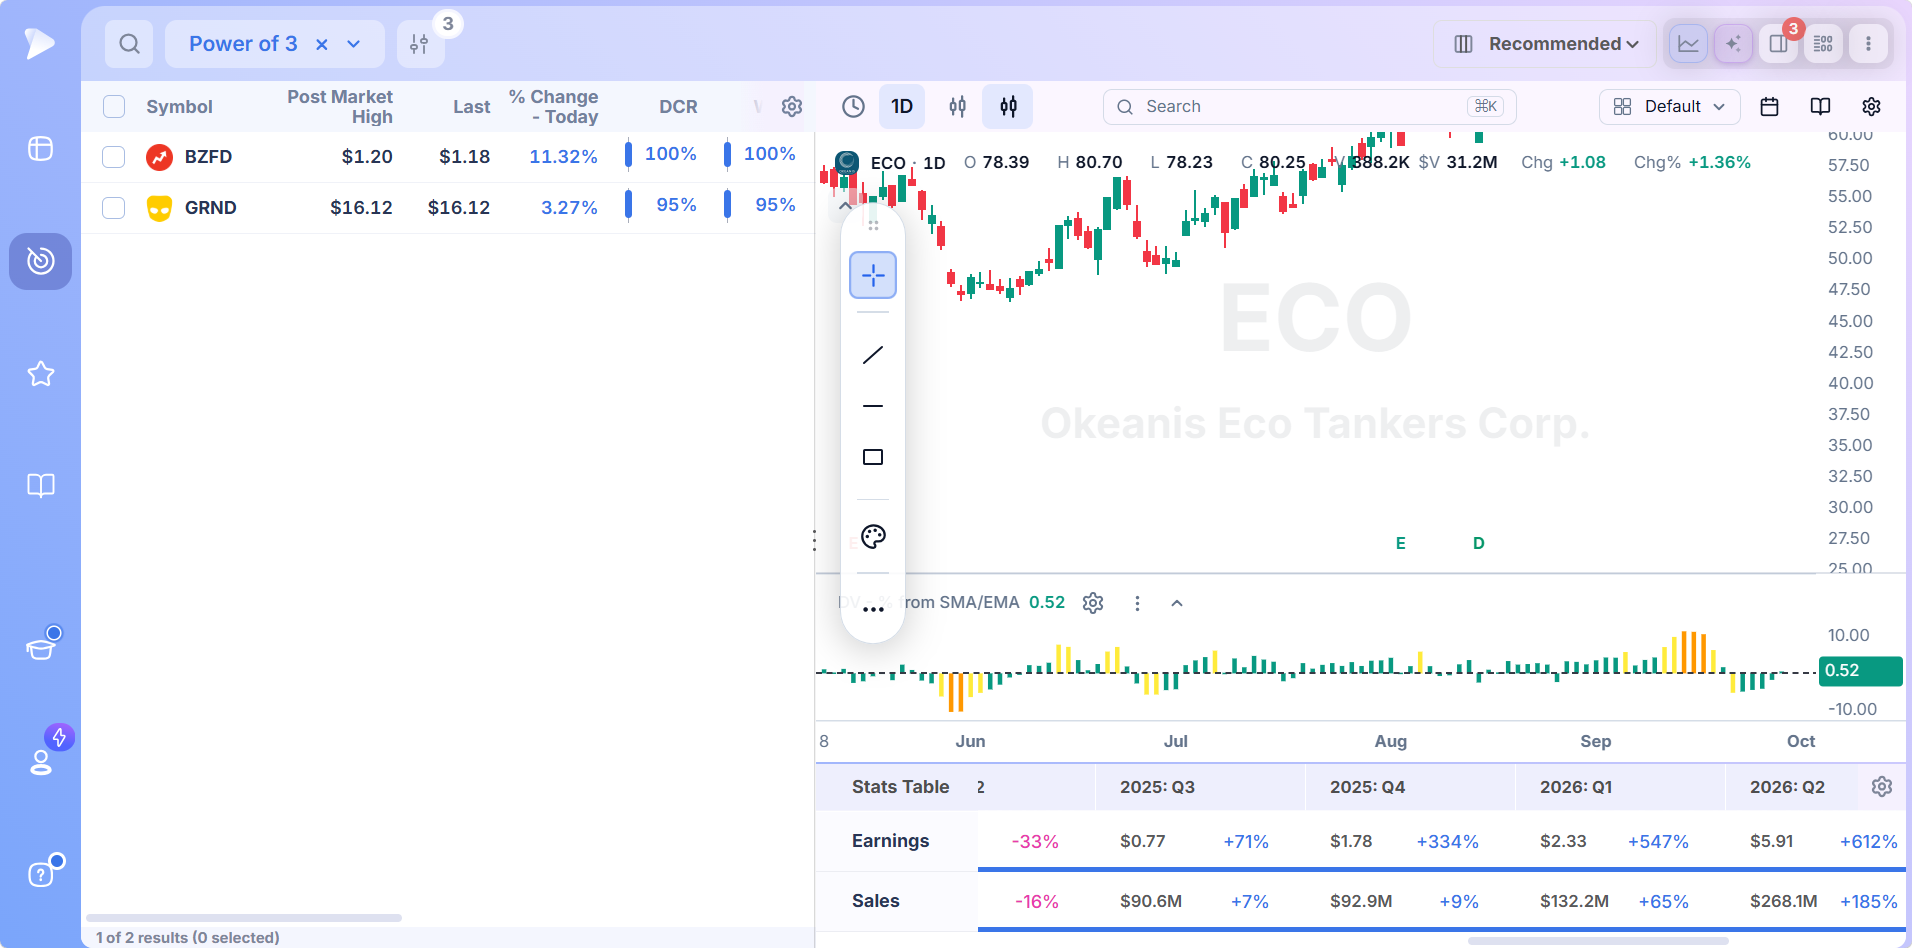
Each result has the chart one click away in split view, and for a technical screen that chart is not optional. A stock can satisfy the 3 weeks tight tolerance while sitting in a downtrend, or pass a relative volume test on a gap down that recovered. The candles show which. A pane beneath the price plots distance from the moving average, and the stats table under that lists quarterly earnings and sales, so a technical signal in a stock with accelerating numbers is recognized at once.
What a Long Term User Says
One trader who moved to Deepvue after years on the incumbent platform reviewed it on Reddit after more than a year of daily use, running both tools side by side for a month before switching: “After over a month I was realizing I was actually getting my routine done faster and finding all the top stocks plus a few extras.” The presets and the and/or logic of the screen builder were two of the eight things on the list of what worked.
From Signal to Position
A name that passes the chart check goes to a watchlist by right click, and an alert at the buy point does the waiting: the high of the tight area for 3 Weeks Tight, the session high for a volume name, the 50 day line for a Power of 3 reclaim that needs to hold. When it fires, the position size calculator converts entry and stop into a share count.
How to Build Your Own Technical Screen
The presets are starting points. A copy lets you tighten one, or combine two into the exact setup you trade.
Duplicate the preset closest to your setup, which makes its conditions editable.
Put an RS Rating minimum in front of it, so the signal is only evaluated in stocks already outperforming.
Tighten the defining tolerance: a narrower weekly range for tightness, a higher multiple for relative volume, a shorter reclaim window for the averages.
Add a fundamental condition if your method requires one, such as accelerating quarterly sales, using the same builder.
Set a liquidity floor in dollar volume that matches your position size.
Save it into a folder. It reruns on streaming data every session.
The AI Terminal turns a sentence into the same screen: “stocks with three tight weekly closes, RS Rating above 85, above the 50 day, at least two million dollars traded a day” comes back as conditions you can save.
How to Trade What a Technical Screen Returns
Each setup has its own entry logic, and the three examined here show the range.
Trading a 3 Weeks Tight
The entry is the move above the high of the three week band, ideally on volume above average. The stop belongs under the low of the band, which is usually within a few percent because the pattern is tight by definition. O’Neil treated the setup as an add on point in a stock already owned as often as a fresh buy, because it appears in leaders mid advance.
Trading a High Relative Volume Day
Chasing the volume day itself is the common error. The better trade is usually the next one or two sessions: a stock that held its gains on lighter volume and then pushed through the volume day’s high. The stop goes at the volume day’s low. If that low breaks, the buyers who showed up did not stay.
Trading a Power of 3 Reclaim
The reclaim day is the signal, and the confirmation is the stock holding above its 50 day average through the sessions that follow. Entry on a pause after the reclaim keeps the stop tight, just beneath the 50 day average or the reclaim day’s low. A stock that immediately falls back through the averages has failed the setup, and the position is closed without discussion.
Technical Screens, Pattern Screens and Indicator Screens
Three overlapping ways to organize the same library:
- •Technical presets are the fifteen setups in this category, each defined by price and volume behavior.
- •Pattern screens key off a named chart formation. The Pocket Pivots preset has a full page in that cluster.
- •Indicator screens key off a single measure, such as relative strength or a moving average.
The pocket pivot screener and the volatility contraction pattern screener are the closest cousins of 3 Weeks Tight and Volume Dry Up. The relative strength stock screener supplies the leadership condition worth adding to any technical screen.
When a Technical Signal Should Be Ignored
A screen is a test, and passing it is the beginning of the analysis. Skip the result when:
- •The trend is wrong. Tightness in a downtrend is consolidation before the next leg down. Every consolidation preset assumes a prior advance.
- •The volume has no price. A relative volume spike with a flat or negative close is churn, and often distribution dressed as demand.
- •It is barely liquid. Single bar signals in a thin stock are one order, not a pattern.
- •Earnings are tomorrow. A tight base into a report is a coin flip, not a setup. Know the report date first.
- •The market is not cooperating. In a correction the technical lists still fill, and most breakouts from them fail. Fewer positions and smaller size until the market proves otherwise.
Who Gets the Most From These Screens
- •Growth and momentum traders whose setups are defined by price and volume behavior
- •O’Neil style traders who want 3 weeks tight and pocket pivots as running screens rather than chart chores
- •Swing traders who start each session from the volume events of the day before
- •Anyone weighing a technical analysis screener against a charting package who wants the setups pre written
- •Traders who combine technical and fundamental conditions and want one builder for both
Pricing
$49 a month, one plan, everything in it.
- •All fifteen Technical presets and the other 154 in the library, editable once copied
- •276 technical measures and 145 price and volume fields, as filters and as columns
- •Charts with the setup visible beside the results, with lists and alerts a right click away
- •Streaming data through the session, so a volume screen fills while the volume is happening
MarketSurge, the usual alternative for technical growth traders, is $149 a month.
New accounts include a setup call, introductory emails and weekly webinars that each take one module apart.
Define the Setup Once, Find It Every Day
The traders who wrote the chart books were describing what they saw. A technical stock screener takes the description, makes it exact and applies it to everything at once, so the setups stop depending on where you happened to be looking. Fifteen of them are waiting in the Technical category, and the sixteenth is whichever one you write yourself.
The other approach based screens are gathered at stock screener by strategy. Screens organized by formation are at stock screener by pattern, by reading at stock screener by indicator, by the trader who wrote them at stock screener by trader, and by the moment in the session at stock screener by market timing.
↑ Back to contentsFrequently Asked Questions
What does a technical stock screener do?
A technical stock screener evaluates every listed stock on price and volume behavior, such as tightness, relative volume or position against moving averages, and returns the ones whose chart currently matches a defined setup. Deepvue ships fifteen such setups as presets and 276 technical measures to build more.
What is the best technical stock screener?
The best technical stock screener is the one that already contains the setups you trade, updates during the session rather than after it, and puts the chart beside the results. Deepvue meets all three for growth and momentum traders, with fifteen technical presets, streaming data and a split view chart, at $49 a month against $149 for MarketSurge.
Which technical screens does Deepvue include?
Deepvue’s Technical category includes 3 Weeks Tight, Bullish Outside Day, Double Inside Day, Down on Volume, Full Timeframe Continuity, High Relative Volume, In the Wick, Inside Days, Open Equals Low, Pocket Pivots, Power of 3, Recent IPOs, Up on Volume, Volume Dry Up and Weak Stocks, fifteen presets in total.
What is the 3 weeks tight pattern?
The 3 weeks tight pattern is William O’Neil’s continuation setup: three consecutive weekly closes within roughly 1% to 1.5% of each other in a liquid stock that is already trending strongly, signaling that holders are not selling. The buy point is a move above the high of the tight area, and Deepvue’s 3 Weeks Tight preset screens for it.
What does the Power of 3 screen look for?
The Power of 3 screen looks for stocks in a longer term uptrend that have just reclaimed their 10, 21 and 50 day moving averages in a single session after a pullback below them, a potential reversal or continuation setup. It is distinct from the Power of 3 concept in ICT trading, which describes accumulation, manipulation and distribution within a session.
How do you find high relative volume stocks?
You find high relative volume stocks by screening for the session’s volume expressed as a multiple of that stock’s recent average rather than for raw share count, then filtering for a positive move so the volume reflects buying. Deepvue’s High Relative Volume preset adds a third condition, restricting the list to the day’s top 15 industry groups.
What are inside day stocks?
Inside day stocks are those whose latest session traded entirely within the high and low of the previous session, a sign of contracting range that often precedes a directional move. Deepvue screens for single inside days and for double inside days, two in a row, as separate presets.
Can a technical screen include fundamental conditions?
Yes, a technical screen in Deepvue can include fundamental conditions, because the same builder handles technical, fundamental, earnings, ownership and rating fields. A copied technical preset can carry an earnings growth or RS Rating condition beside its price and volume rules.
Is there a free technical stock screener?
Free technical stock screeners exist but typically offer delayed data, a limited set of conditions and no saved presets built to traders’ published rules. Deepvue is $49 a month for streaming data, fifteen technical presets and the full builder, and new accounts start with a setup call.
How many results should a technical screen return?
A technical screen should return as many results as the setup is rare, which means a broad volume screen may list dozens of names on an active day while a three average reclaim may list two. A short list is not a broken screen; it is a selective one, and the ranking columns handle the long lists.
Can I edit the technical presets?
Yes, you can edit the technical presets by saving a copy; the copy is fully editable while the original stays as shipped. Common changes are a tighter tolerance, an added relative strength floor, a liquidity minimum and an earnings date filter.