Deepvue Charts: Customizable Stock Charts Built by Traders, From the Engine Up
Deepvue’s stock charts run on a charting engine the company wrote itself, so every setting, indicator and drawing is the team’s own. One search box finds symbols, indicators, templates, drawings, chart types, timeframes and actions, and anything you star is pinned to the toolbar.
The indicator library is tuned to growth stock trading, anchored VWAP places its own anchors, and chart replay mode turns past moves into practice. Templates save an indicator set per timeframe, workspaces save everything, and the same charts appear in the screener, the watchlist and as a dashboard app.
and your first chart template is a few clicks away.
Deepvue charts, in numbers:
Key Takeaways
Most stock market charts are somebody else’s engine wearing a different logo: settings scattered across five menus, an indicator list built for everyone and therefore for nobody, and every feature request stuck behind a vendor’s roadmap.
Deepvue ran on a third party charting platform for years and hit that ceiling, so it built its own engine.
What came out is a set of customizable stock market trading charts designed by three co founders around how growth traders actually work: find a setup on a screen, judge the base, mark the pivot, check volume, decide.
- ✓An engine written in house, built after a third party engine capped what the team could add and how fast.
- ✓One search box finds everything, and starring an item pins it to the toolbar. That is how customizable charts stay clean without giving anything up.
- ✓Growth stock indicators, from Enhanced Volume and the RS Line to Base Pivots, RMV Pivots, a Darvas box and a Minervini trend template.
- ✓Anchored VWAP anchors itself, offering swing highs and lows, the 52 week high and low, year and quarter starts, and relative volume spikes.
- ✓Chart replay mode recomputes every indicator as of the bar on screen, so you practice the decision at the moment it had to be made.
- ✓Included in the one plan. Get started with Deepvue here.
Deepvue Stock Charts at a Glance
- Engine
- Written in house, replacing a third party engine used in the platform’s early years
- Search
- One picker with tabs for All, Indicators, Templates, Drawings, Chart Types, Timeframes and Actions
- Chart types
- 19 styles, from candlestick and OHLC through Heikin Ashi, Renko, Kagi and Point & Figure
- Timeframes
- 1 minute through 12 month bars, including session aligned intraday intervals
- Indicators
- A Deepvue section of purpose built tools above the standard library
- Drawings
- Favorites pinned to a floating pill you can move, dock or turn horizontal
- Settings
- Chart, Display and Right-click menu tabs, a settings search, and a reset to defaults
- Templates
- An indicator set saved per timeframe, optionally starred to the toolbar
- Workspaces
- Charts, layouts, drawings and templates saved together, with shipped presets
- Where it appears
- The chart module, the screener, the watchlist and as a dashboard app
- Cost
- Part of the one subscription, with no charting tier
What Are Deepvue Stock Charts?
These stock market charts are the heart of the platform: the chart module in its own right, the chart beside every screener and watchlist row, and the Chart app on a customizable dashboard. Same engine, same settings everywhere, so a template built in the screener is the template you get on a dashboard.
The screenshots below were captured on a particular symbol during a particular session, so the prices, values and dates in them illustrate the interface rather than describe any current setup.
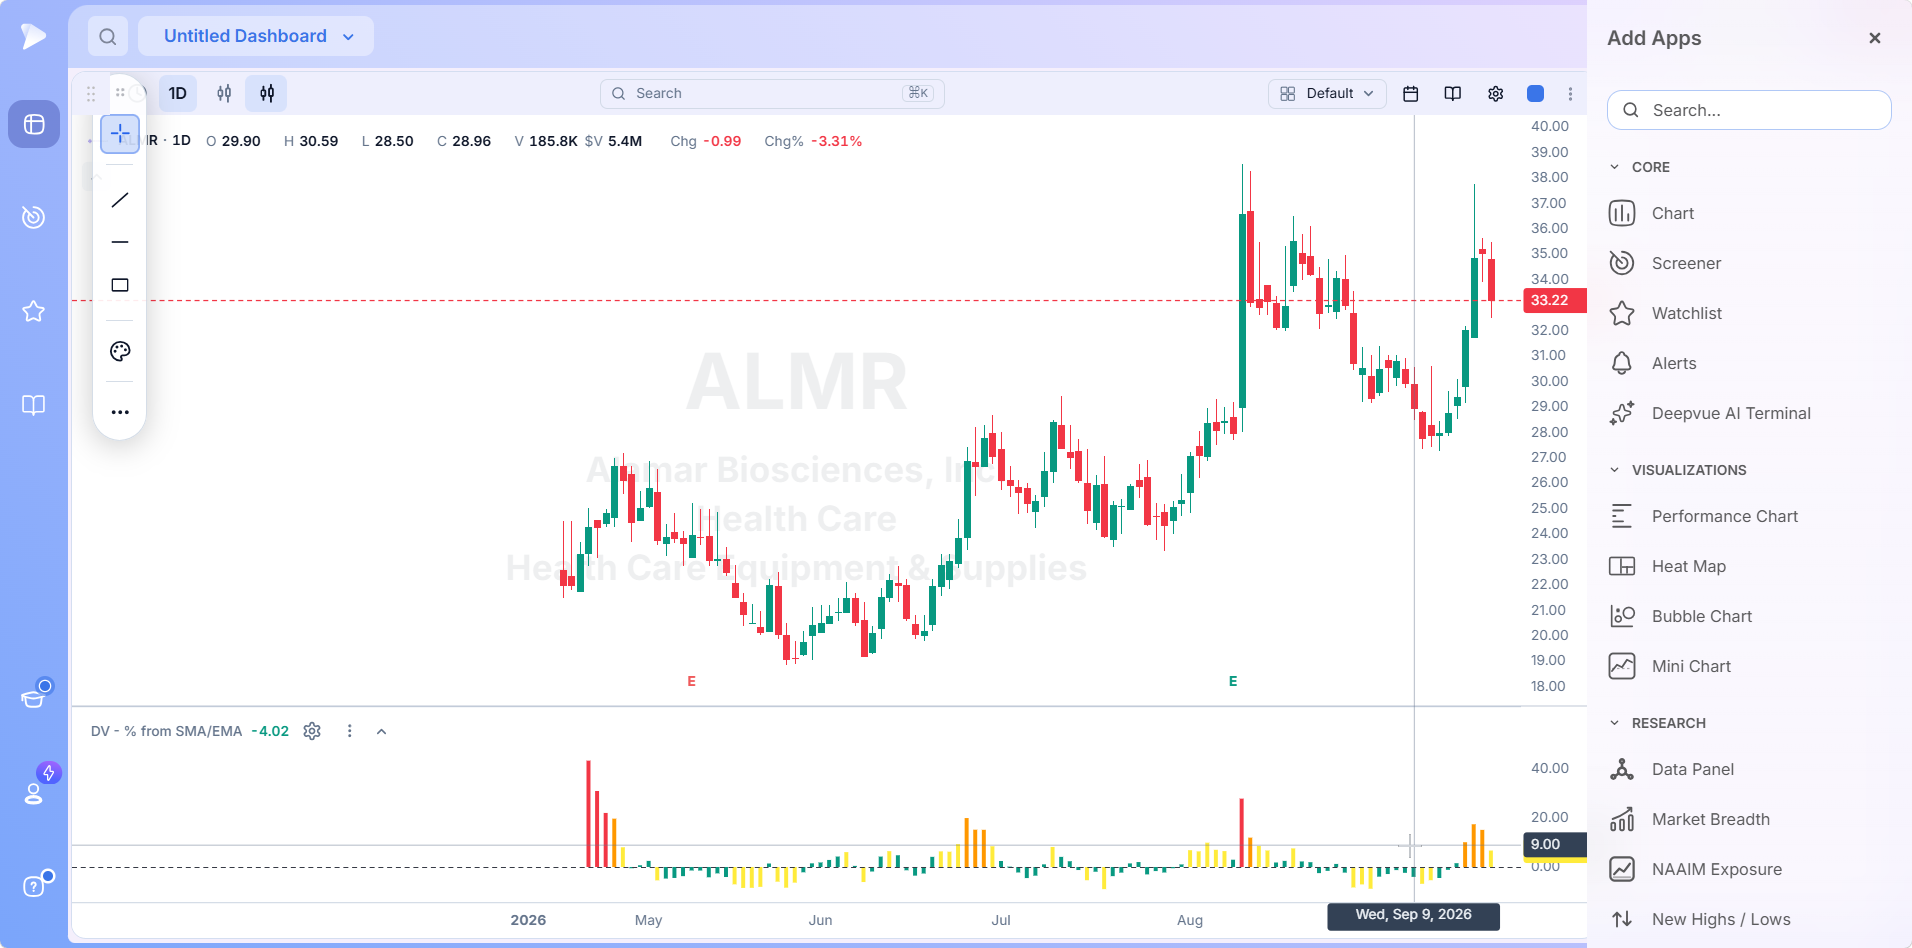
In the dashboard catalog the Chart app heads the Core group. Even at a modest size the toolbar, the drawing pill, the timeframe button, the search and the template dropdown are all there.
Who Deepvue Charts Are For
Traders who read bases, volume and relative strength and want stock trading charts that read them too, holding for weeks into months rather than trading the session.
- ✓Swing traders who want RMV Pivots and Base Pivots marking the entry levels they would otherwise draw by hand.
- ✓Position traders using key moving averages with the weekly stair step and the RS line’s new high markers to judge whether a leader is still leading.
- ✓Traders coming from TradingView who want that flexibility with a growth stock indicator set already built.
- ✓Traders coming from MarketSurge who want modern, editable charts with the same base and volume vocabulary.
- ✓Anyone who learns by replaying, since chart replay mode with recomputing indicators is study material on every chart.
Routines by trading style are gathered under Deepvue for, one guide per style.
Why Deepvue Built Its Own Engine
The co founders explained it in the launch webinar. A third party engine gave them a fixed feature set they could match and never exceed. Simple user requests waited quarters for a vendor to expose them, reliability and speed were out of their hands, and what they wanted to build outran what an outside engine allowed.
- •Fewer scattered settings, with three ways to reach any option instead of six.
- •Simpler workflows, so the drawing you use most is a click away rather than one of a hundred in a sidebar.
- •Pattern recognition in the chart itself, so the engine helps you see the structures you trade rather than only plotting price.
At launch they cited more than 70 indicators, over 85 drawing tools, and upwards of half a million lines of code written by the team.
WatchDeepvue Charts launch webinar: why the engine was built in house, the omni search, workspaces and live indicator demosReading the Chart
The toolbar runs left to right: a timeframe button showing the active interval, chart type icons, the search field with its shortcut, a template dropdown, a calendar control, a settings gear, the dashboard color group square, and a menu.
Beneath it a data line reads the symbol and interval, then open, high, low, close, volume, dollar volume and the day’s change. On the right scale the last price shows in a colored label with a countdown to the bar’s close, and a faint watermark behind the candles names the symbol, company, sector and industry. Shaded bands mark premarket and post market, so the regular session reads as the unshaded stretch between them.
Move the crosshair over any bar and the data line switches to that bar’s values. Click and hold for a box with the same figures plus every indicator running. An E on the time axis marks earnings and a D marks a dividend, and both switch off if you want them gone.
One Search for Everything
Click the search field, or hit its shortcut, and a picker opens with seven tabs: All, Indicators, Templates, Drawings, Chart Types, Timeframes and Actions. Everything the chart can do is reachable from here, and a right click on the canvas opens the same sections. Those two plus the settings gear are the only three routes to any option, which is the entire point.
Hover any item and a star appears. Star it and it pins to the toolbar, so the chart types, timeframes and drawings you actually use stay in the top bar while everything else waits in the search. That is how customizable stock trading charts stay clean without giving anything up.
Chart Types
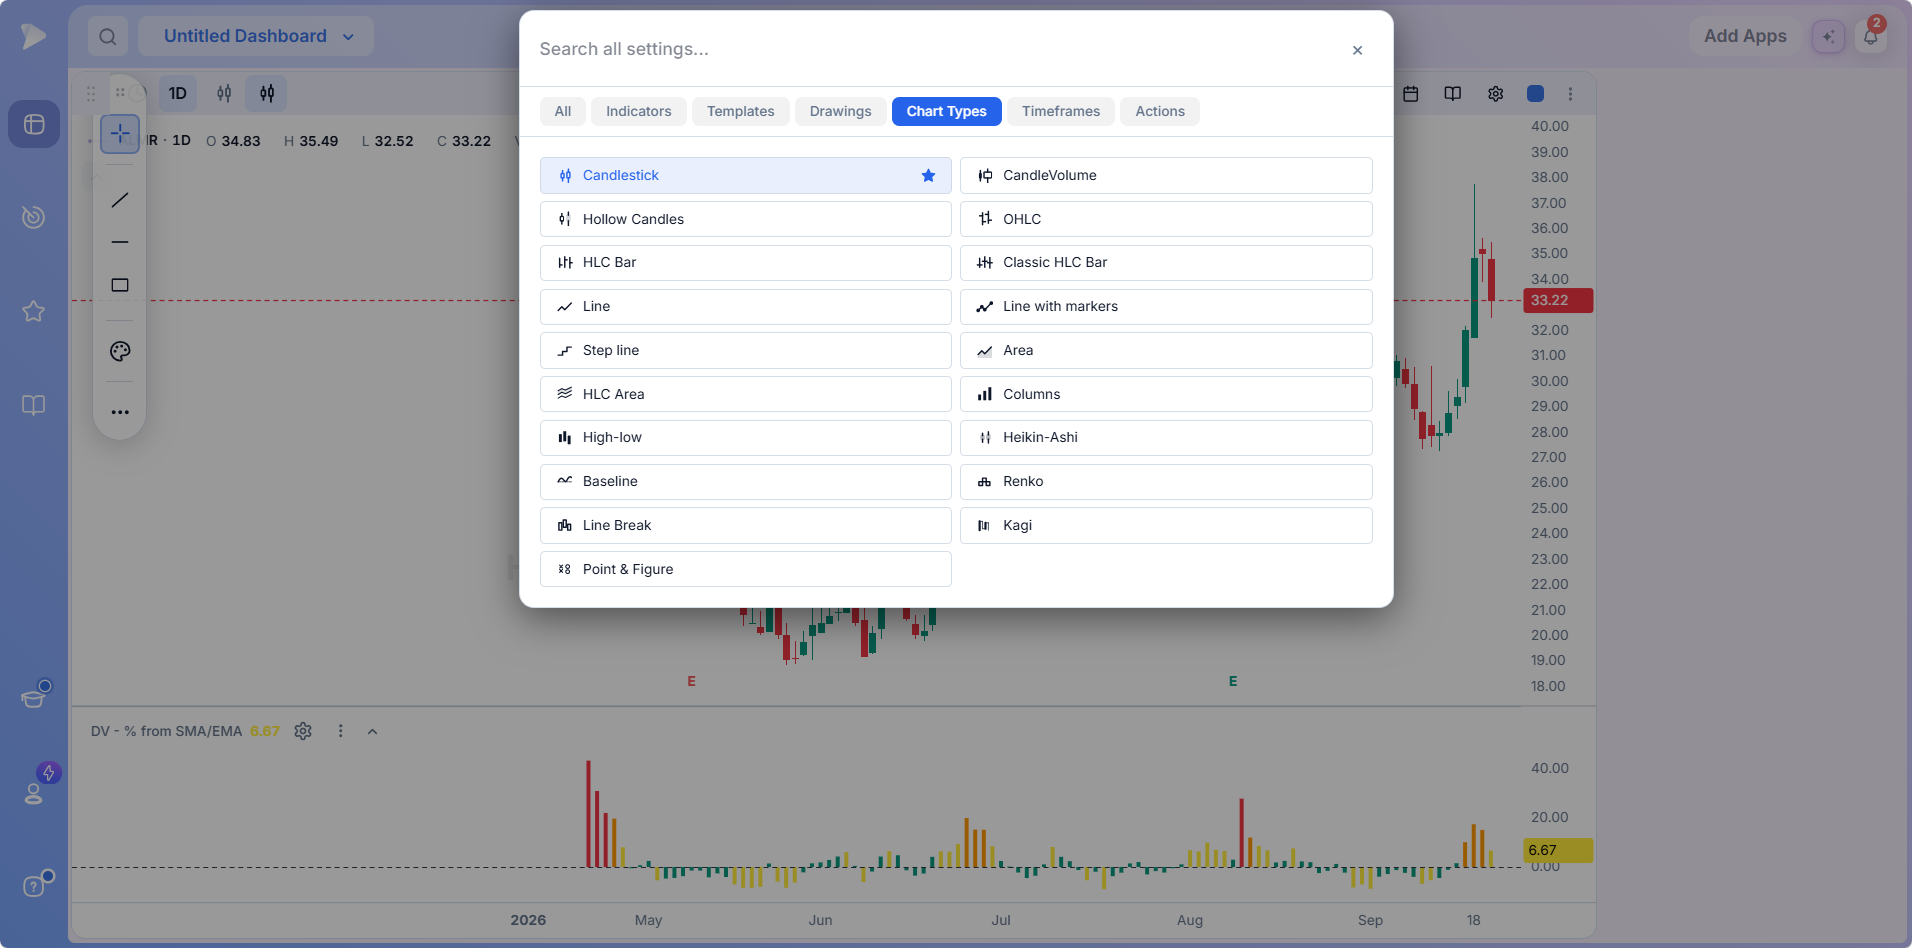
Candlestick, hollow candles and the bar styles are the daily drivers. CandleVolume widens each candle in proportion to its volume, which makes a catalyst day physically stand out. Heikin Ashi, Renko, Kagi and Point & Figure are there for traders who work in those grammars. Star the two or three you switch between and the rest disappear into the search.
Timeframes
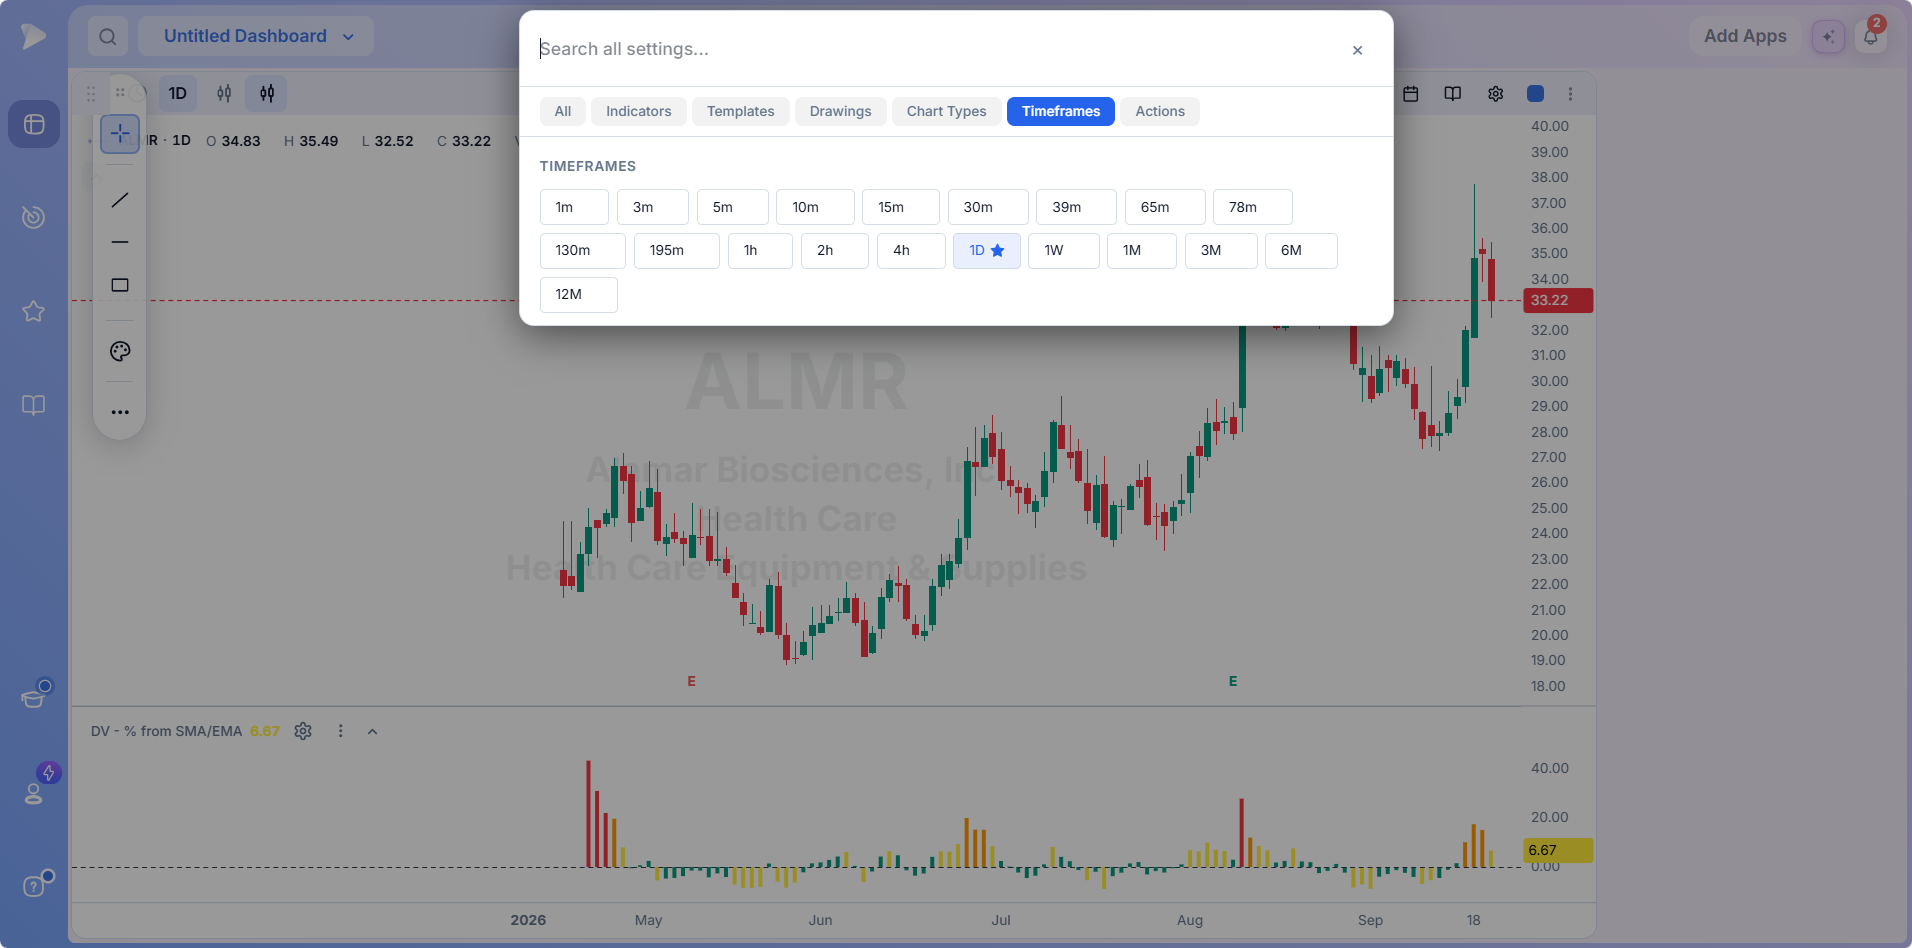
The intraday set includes the 39, 65, 78, 130 and 195 minute intervals that divide the session evenly, which matters if you want bars aligned to the open rather than the clock. Above the hour, the range runs from daily out to twelve month bars.
Drawings and the Drawing Pill
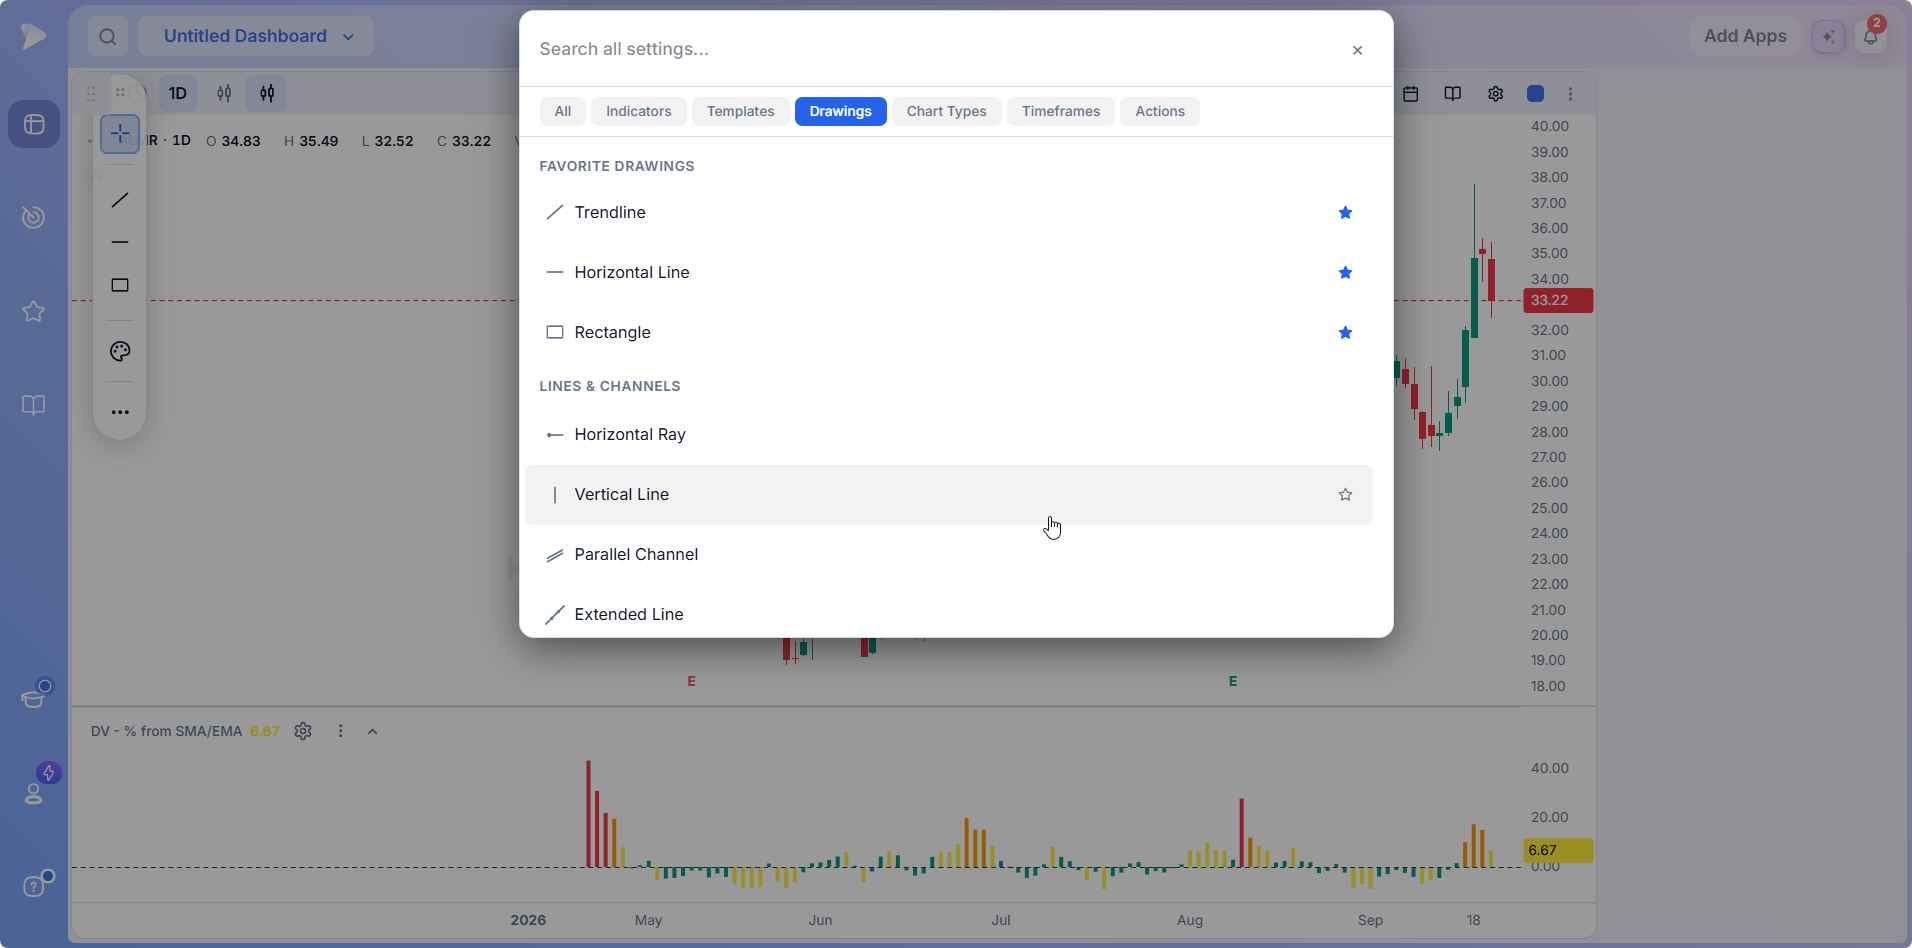
Drawings work the same way. Star a tool and it appears in the drawing pill, the small vertical bar floating at the left of the chart. The assumption is that nobody wants eighty tools on screen; they want the four they use. Drag the pill anywhere, dock it, or flip it horizontal.
Draw a line and a floating toolbar appears beside it for color, width, style, extension, lock and delete, and the endpoints print their prices on the scale. The pill’s menu adds quick draw, which keeps the tool active until you press escape, magnet modes that snap to price, lock all and clear all, and screenshot options that save, copy or share straight to X. Right click a trendline to set an alert on it.
One measurement tool has no button. Hold shift, click a point, drag to another, and you get the distance in price, percent and bars. Nothing measures a base depth or a move off a low faster.
Actions
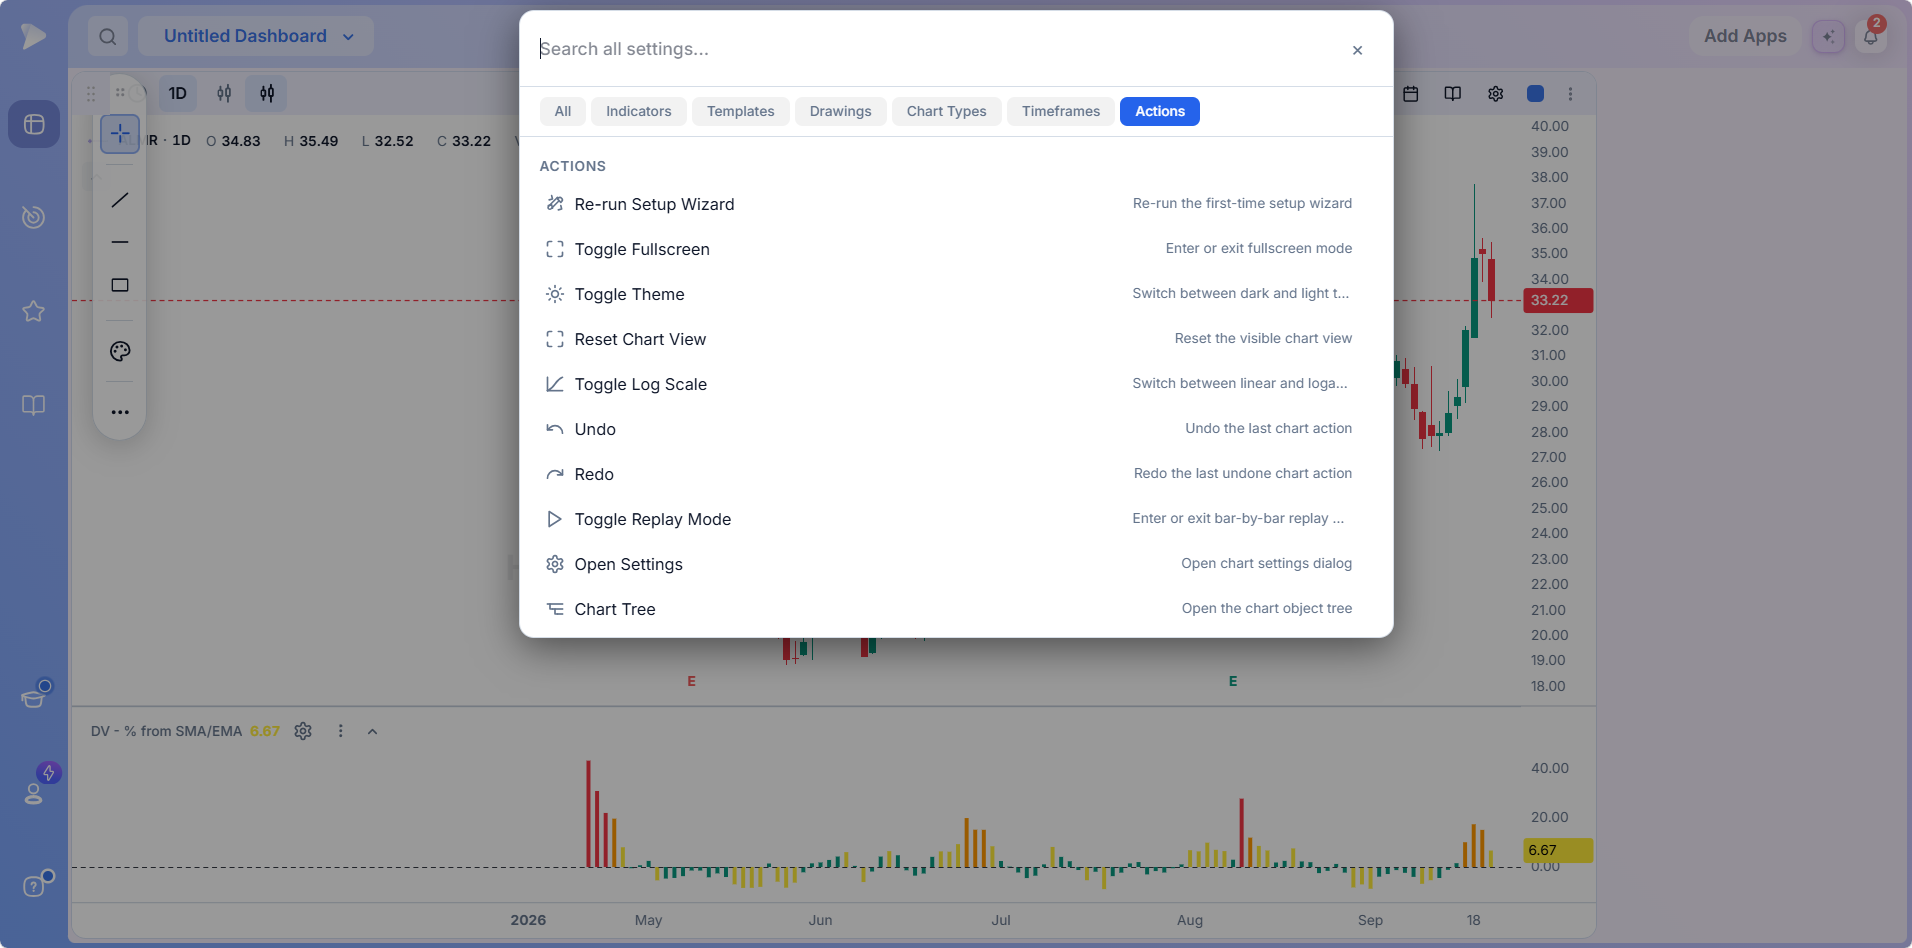
Actions are things you do to a chart rather than put on it: re run the setup wizard, toggle fullscreen, switch between dark and light, reset the view, move between linear and logarithmic scale, undo and redo, enter replay mode, open settings, and open the chart tree, an object view of everything on the chart. A compare action plots a second symbol in its own panel or over the price.
Open a Deepvue account and build your first chart with the setup wizard.
Stock Chart Indicators Built for Growth Stocks
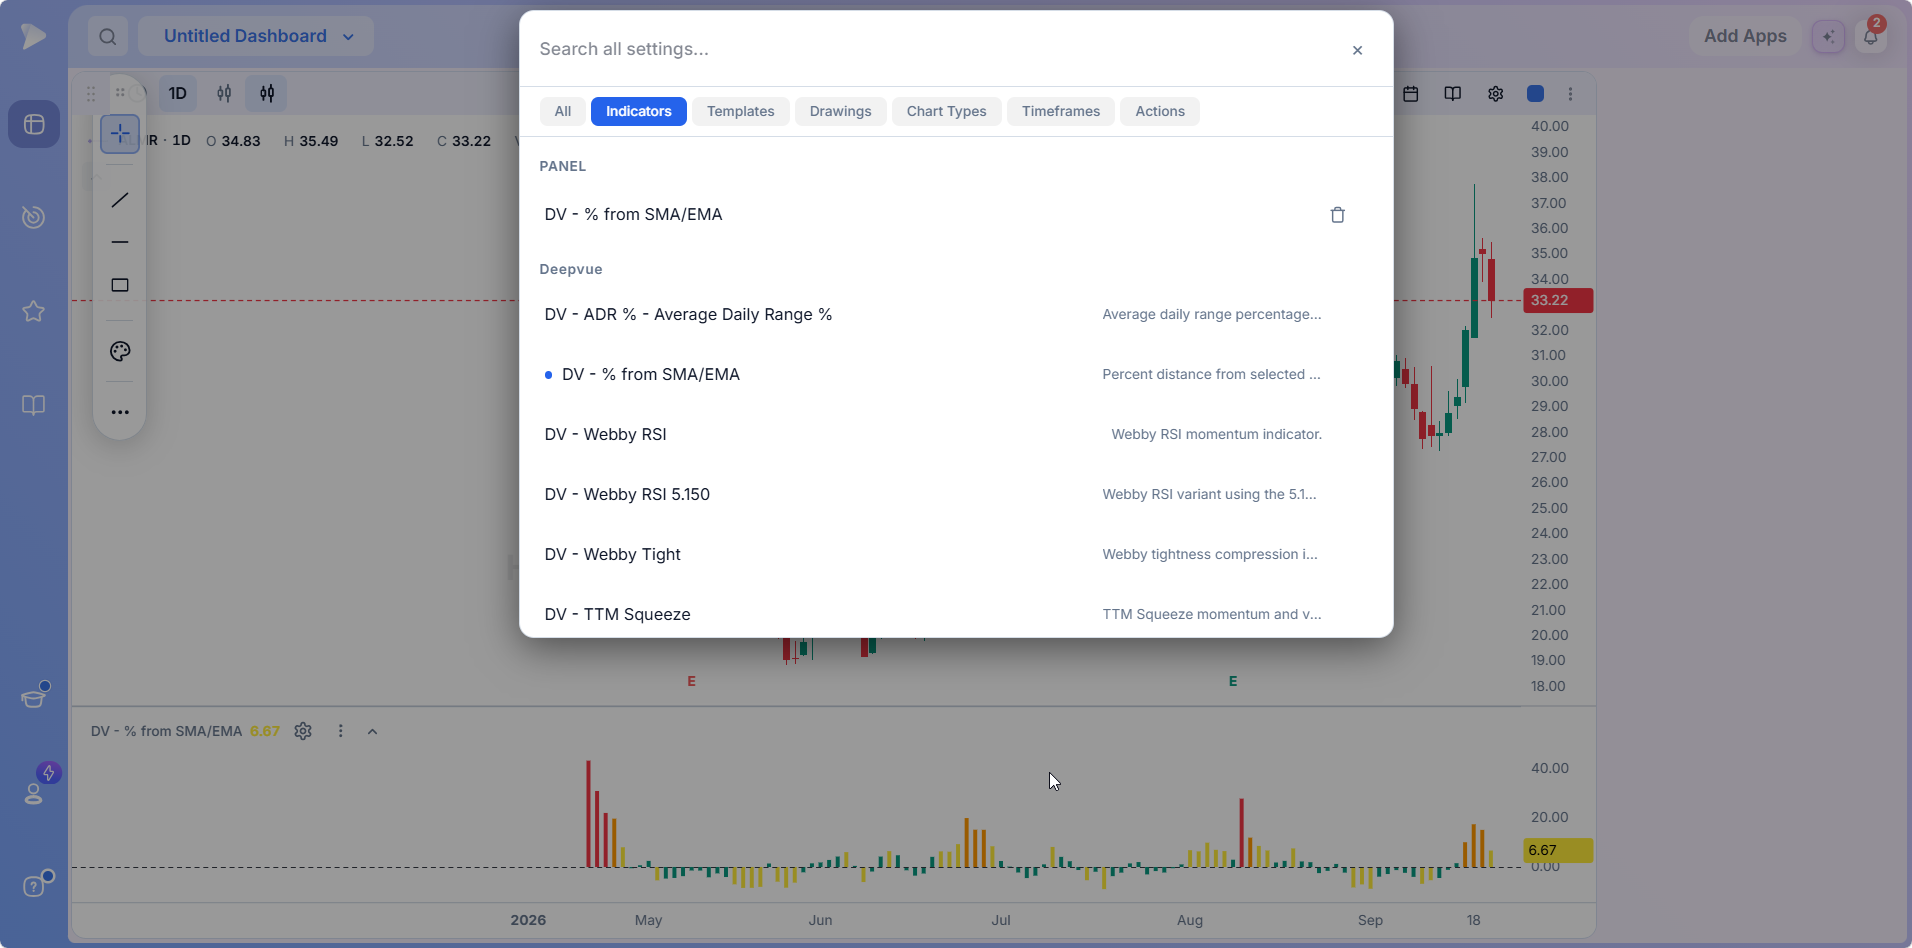
The stock chart indicators list opens with the indicators already on your chart, each removable in one click, then a Deepvue section with every entry prefixed DV. These are the tools the team built for its own method rather than the generic set every engine ships, and they are why these stock trading charts feel different in use. Every one edits the same way: click the gear and a dialog opens with Inputs for the numbers, Style for colors and lines, and Visibility for which timeframes it appears on.
Enhanced Volume
The volume panel rebuilt around what a growth trader is looking for. Beyond up and down coloring it flags the signatures that matter:
- •Pocket pivots, where volume exceeds any down day in the prior ten.
- •Volume dry ups, plus accumulation and distribution bars.
- •The HV Edge family developed by Ameet Rai, flagging the highest volume ever, since the IPO, in the past year, or since the last earnings report.
The biggest bars carry their values as labels, and a projected bar estimates the day’s total from the run rate as soon as trading begins. A stats strip along the top prints whichever figures you choose, so the number is right beside the picture.
The Relative Strength Line
The RS line plots the stock against the market in its own panel, and Deepvue’s version adds the markers that make it actionable. Circles mark an RS new high, and a second marker flags an RS new high before price, the signal that so often picks out the next leaders during a correction.
A corner strip prints the RS Rating on horizons from one month to twelve. Which one drives the line is an input; the co founder’s own preference is one or three month rather than twelve.
Key Moving Averages
One indicator holds every moving average you use across intraday, daily, weekly and monthly charts, each toggled on or off, set to EMA or SMA, and colored individually. What sets it apart is a column projecting a higher timeframe average onto a lower one: switch it on for the 10 week and a stair stepped line appears on the daily chart, exactly where a pullback often finds support before the 50 day is ever touched.
Base Pivots and RMV Pivots
Base Pivots reads the chart and draws the consolidation levels you would otherwise draw by hand, printing the pivot price, the base length in days and its depth beside each one.
| Setting | Effect | Why traders change it |
|---|---|---|
| Lookback | Sets how long a consolidation must be to count | Dropping it from the default highlights the shorter flags a swing trader cares about |
| Breakout threshold | Percentage or a multiple of average daily range | Keeps a base active until price clears the pivot by that much, so a shakeout does not end the base early |
| Merge | Collapses pivots within a chosen percentage into one level | Cleans up a chart where a stock has stalled at the same price twice |
RMV Pivots does the same job at a finer grain, using relative measured volatility together with price structure to draw the subtler contracted areas that precede expansion: low cheats, tight flags, the early entries along a base’s right side.
Darvas Box, High Tight Flag and the Minervini Trend Template
- •The Darvas box draws Nicolas Darvas style ranges, coloring a box blue while it holds, green on an upside break and red on a breakdown, with inputs for bars in a box, a relative volume requirement to end it, and a danger line beneath.
- •The high tight flag indicator marks the pole and the flag, with inputs for minimum pole gain, the bar counts in each, and the permitted pullback.
- •The Minervini trend template renders the trend criteria as a checklist on the chart: price against the 50, 150 and 200 day averages, the averages in order, price above its 52 week low by the required margin and within range of its high, and the 200 day rising, each with a tick or cross and a score in the heading.
The Rest of the Deepvue Set
Beyond those the section carries ADR and ATR percent readings, percent distance from a chosen SMA or EMA, an ATR multiple that flags extension, the Webby RSI (including a 5.150 variant) and Webby Tight, a TTM Squeeze, an up down volume ratio, price labels for key pivots, EMA clouds, earnings and sales lines, and a candle pattern indicator marking inside and outside days. The standard library follows beneath.
Anchored VWAP That Anchors Itself
Anchored VWAP is a drawing rather than an indicator. Pin it, click it, choose a bar, and the volume weighted average draws forward from that anchor. Deepvue’s addition is a set of automatic anchors in the settings; tick any of these and they place themselves:
- •Swing highs and swing lows.
- •The highest volume bar in the loaded range.
- •The 52 week high or low.
- •The year, quarter or month start.
- •Gap ups and relative volume spikes.
A relative volume spike anchor lands on the earnings gap without you hunting for it, which is the usual way to track an earnings gap anchored VWAP for a reclaim. Bands and anchor colors are adjustable.
Chart Settings: Three Tabs, Everything Searchable
The gear opens a panel with three tabs, Chart, Display and Right-click menu, plus its own search box that understands nested settings, so typing EPS lands on the events section without you knowing where it is filed. A Reset Chart to Defaults button waits at the bottom.
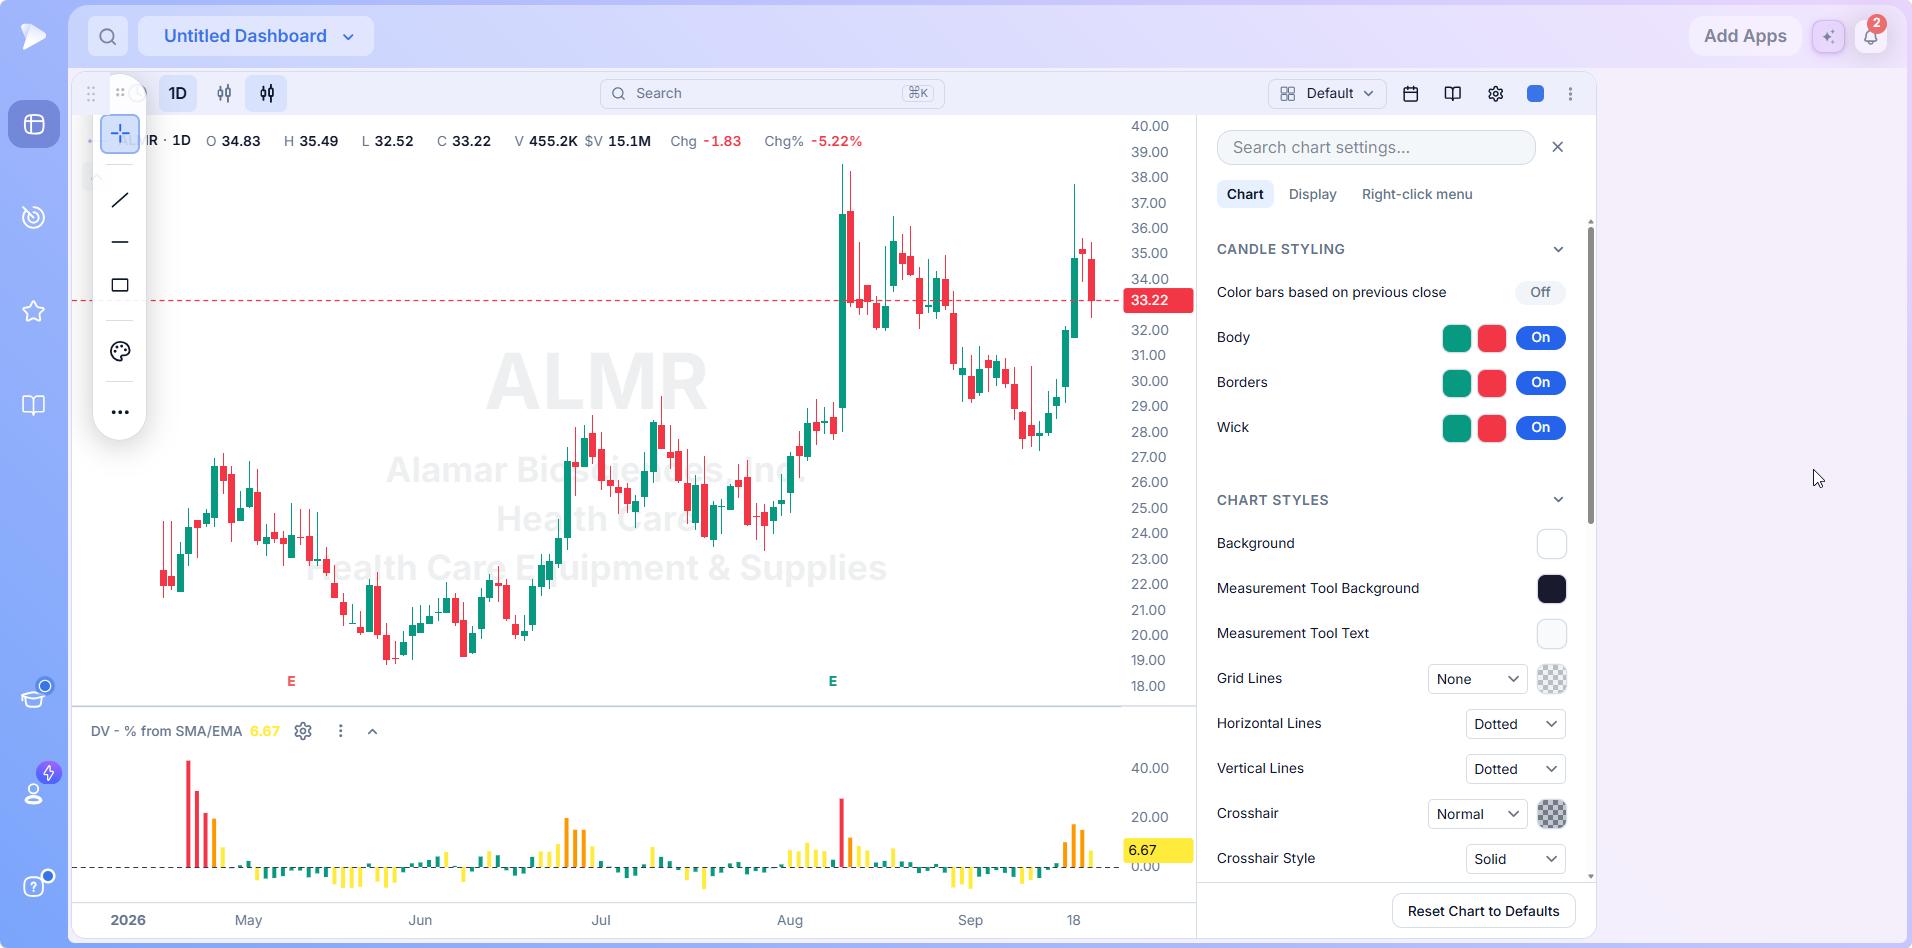
The Chart tab governs how price is drawn: candle body, border and wick colors, coloring by the previous close, the background, the measurement tool colors, grid lines, horizontal and vertical line styles, and the crosshair and its style.
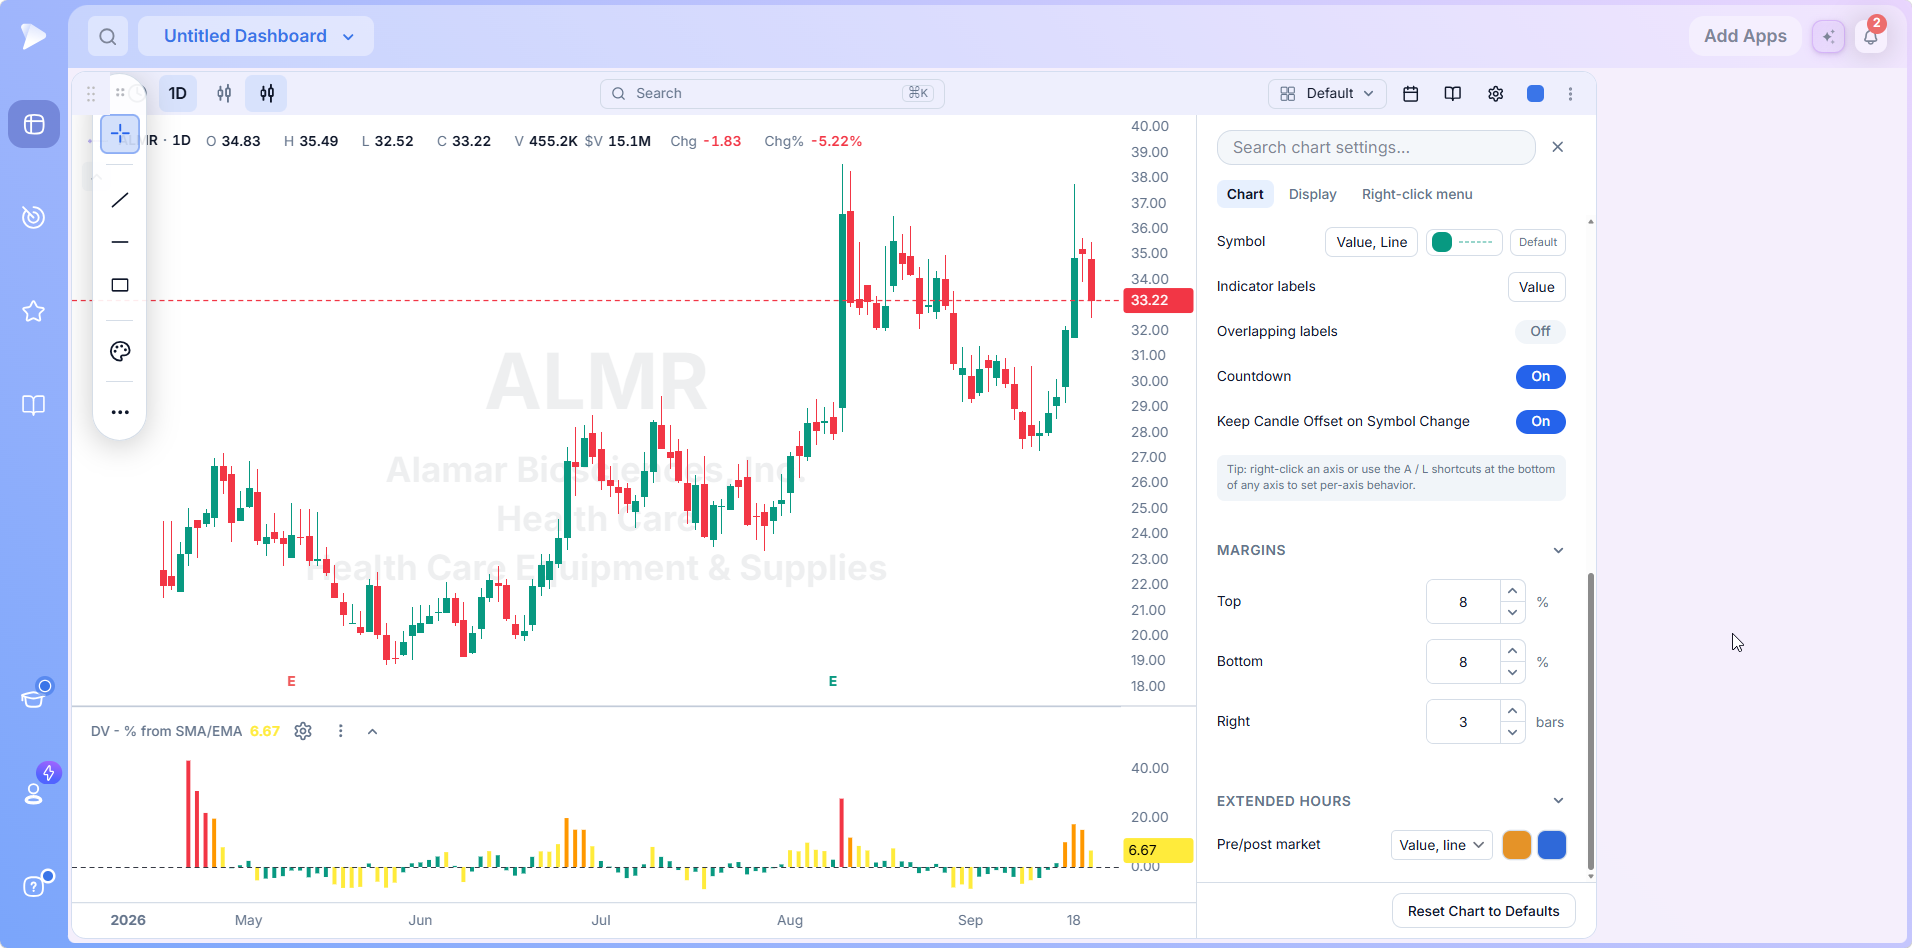
Further down, labels set how the symbol and indicators print on the scale, alongside toggles for overlapping labels, the bar countdown, and whether the candle offset survives a symbol change. A tip notes that right clicking an axis, or using the A and L shortcuts at its foot, sets behavior per axis. Margins take top and bottom as percentages and the right as a number of bars, which keeps price in the same place as you flip through a screen, and the extended hours section colors premarket and post market.
The Display tab holds the theme, event markers, time zone, the layout picker for multiple panes with sync options, and the watermark.
WatchDeepvue chart setup webinar: building a chart from a blank slate, settings, indicators, templates and anchored VWAPChart Templates and Workspaces
Everything saves as you go, with no save button and nothing to lose. Chart templates exist for a different reason: keeping a particular indicator set ready to load. From the Templates tab, create one from the current chart, name it, optionally tie it to a timeframe so loading it switches the interval, then star it to the toolbar.
The workflow this enables is the one a co founder runs himself: a daily template carrying the full set, a weekly template with a lighter one, an intraday template with an opening range indicator. Switching timeframe becomes one click instead of a timeframe change followed by an indicator shuffle. Because a chart keeps saving its last state, edits you want inside a template have to be written back with overwrite from chart.
Workspaces, and the Presets That Ship With Them
Workspaces rank above chart templates, holding the charts, layouts, indicators, drawings and templates together as one saved layer. Easy to miss: the picker has two tabs, Saved and Preset, and the Preset tab ships with configurations already built.
The Deepvue folder holds a CANSLIM workspace, a swing trading workspace, and a market analysis workspace built around breadth indicators. Beneath it, a Traders folder carries setups credited to named traders, each labeled with what it configures, daily and intraday or daily and weekly.
So you can load a complete, considered configuration before you know what your own should look like, then adjust as your method settles. Each preset carries a copy control, so it becomes yours to edit. When the engine launched, more than eight million existing drawings migrated into the new format in under an hour, and nothing anyone had built was left behind.
Start a Deepvue subscription and load a preset workspace before you build your own.
Chart Replay Mode and Go to Date
Chart replay mode rewinds a chart to a point you choose and plays it forward, at a set speed or one bar at a time with the arrow keys. What makes it a training tool rather than a novelty is that every indicator recalculates as of the bar on screen. A Base Pivot draws itself when it would have appeared, not with hindsight.
Working through a leader’s move this way, base by base, is deliberate practice you can do on any evening. Pair it with the Model Book and the setups worth replaying are already saved and annotated. Clicking the X in the replay bar returns the chart to live.
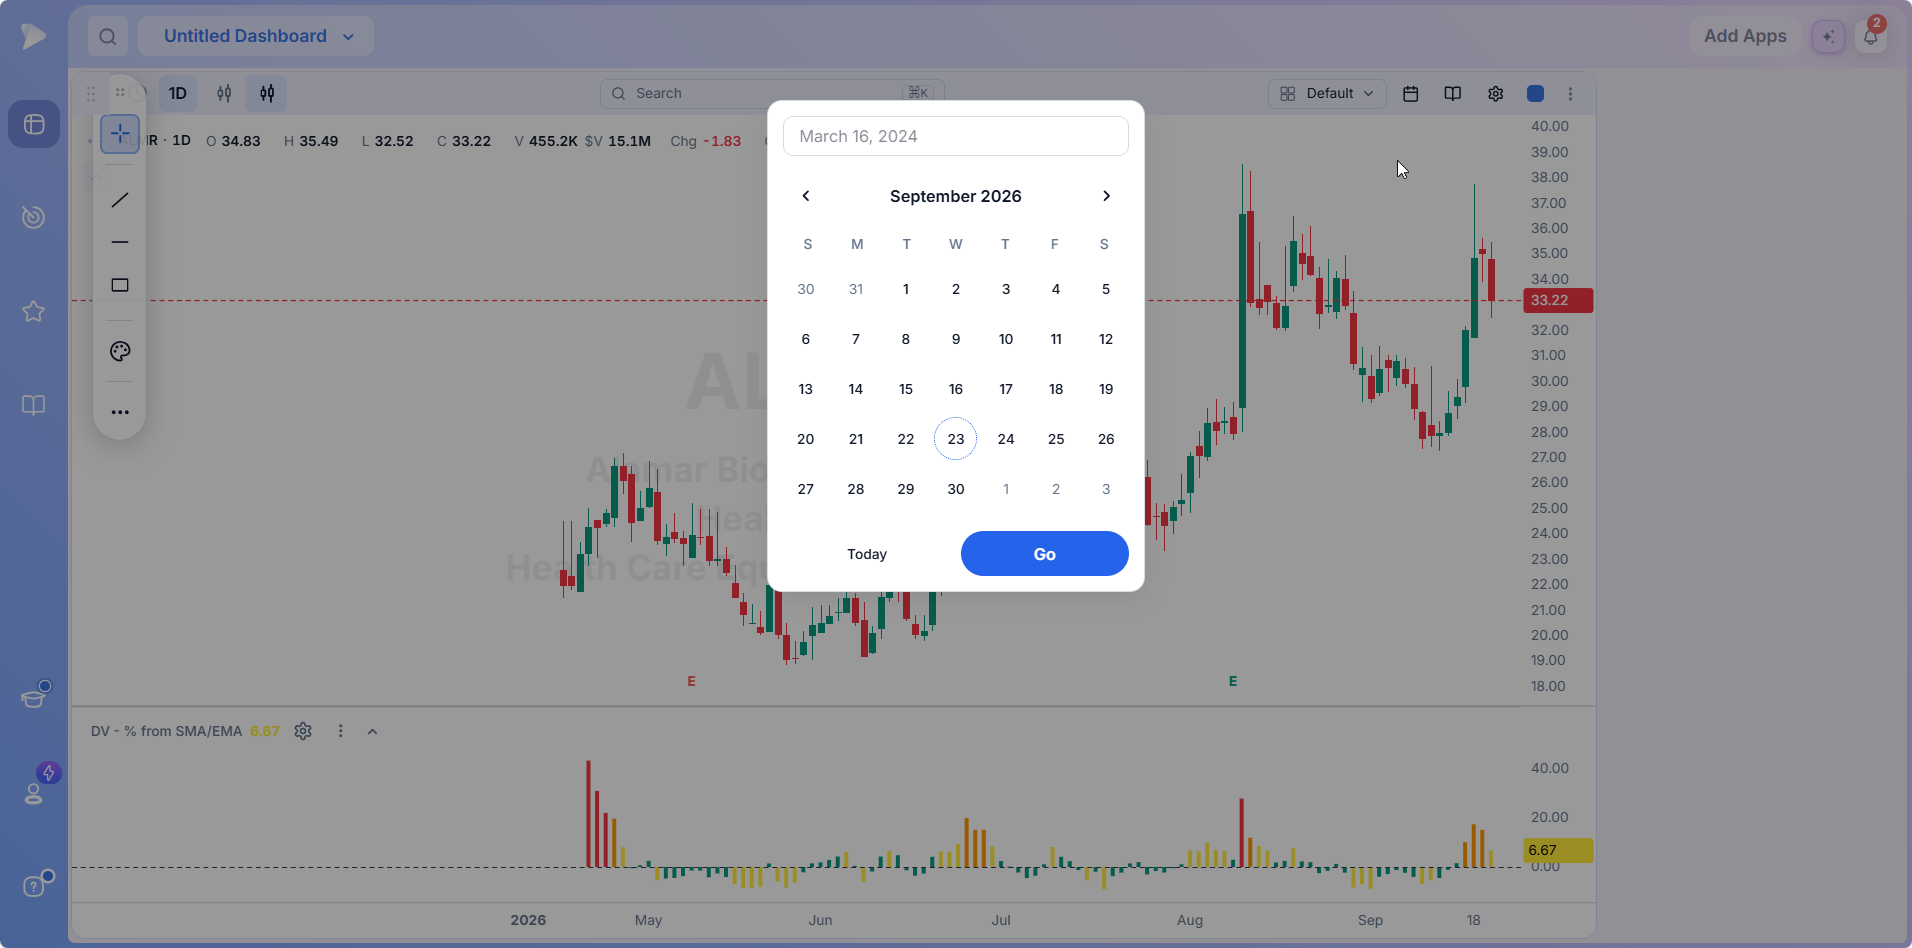
The calendar control in the toolbar is go to date. Type a date or pick one from the calendar, press Go, and the chart jumps there instantly; Today brings it back. Combined with replay it lets you study any historical move on any name, and the co founders note the speed is a direct product of owning the engine.
The Same Charts in the Screener, the Watchlist and the Dashboard
Inside the screener and watchlist modules the chart takes the center of the screen, with the list at the left, a Data Panel at the right, and a Stats Table beneath carrying quarterly earnings and sales with their growth rates.
Press the spacebar and the list, the chart, the stats and the panel all advance together. On a dashboard, the Chart app carries the full engine and a color group square: give it the same square as a watchlist, a ranking or a breadth app and it draws whatever those select, which turns a set of widgets into a workflow. The charts run on iPad and iPhone too.
Where the Charts Stop
- •Indicators are edited rather than coded. Natural language indicator building is not part of the release covered here.
- •Multiple monitors are not synced, so a multi timeframe layout stays on one screen.
- •Chrome is the recommended browser. The co founders note that some others struggle with charting engines.
- •Coverage is US listings. The charts are analysis rather than advice, and nothing on them sends an order anywhere.
How to Set Up Your Stock Charts in Deepvue
Six steps, in the order the co founder uses in the setup webinar.
Star your chart types. Open the search, go to Chart Types, and star the styles you switch between.
Work down the settings. Candle colors, background, crosshair, labels and margins on the Chart tab, then the Display tab for theme, event markers and any multi pane layout with symbol sync on.
Add your indicators. Enhanced Volume, the RS line and key moving averages, then set periods, ratings and colors on each. Add Base Pivots or RMV Pivots if you trade breakouts.
Star your timeframes so the intervals you trade are in the toolbar.
Star your drawings, usually trendline, horizontal line, rectangle and anchored VWAP, so the pill holds your tools.
Save it as a template. Create one from the current chart, tie it to its timeframe, star it. Repeat for weekly and intraday and your setup loads in one click.
Three Routines Worth Stealing
The screen review. Load a screen, put the daily template on the chart, spacebar down the list. Base Pivots draws the levels, Enhanced Volume colors the signatures, the RS line shows who is leading, and the stats beneath answer the earnings question. Anything worth keeping goes to a watchlist from the row’s checkbox.
The weekly study. Two panes with symbol sync on, daily left and weekly right, then work the watchlist. Key moving averages carries both timeframes, and the weekly stair step on the daily chart shows support a daily only view hides.
The replay session. Take a past leader, use go to date to land at the base, and play it forward with RMV Pivots on. Decide where you would have bought before the next bar prints, then see what happened. Twenty names a month is more practice than most traders get in a year of live watching.
Try Deepvue and run a replay session on a past leader tonight.
What Makes These Stock Trading Charts Different
Every charting platform plots price. The differences that change how you work are these:
- ✓The engine is Deepvue’s own, so features ship on the team’s schedule rather than a vendor’s.
- ✓One search replaces the menu maze, and stars keep only your tools in view.
- ✓The indicators speak growth trading, from Enhanced Volume signatures to automatic base pivots and a trend template checklist.
- ✓Anchored VWAP and replay do the tedious part, placing anchors for you and recomputing every indicator bar by bar.
- ✓The chart travels, appearing identically in the screener, the watchlist and on any dashboard.
The Deepvue vs TradingView comparison covers the charting platform most chart focused traders weigh against this one. No platform is right for everyone, and the honest way to decide is a proper comparison: our Deepvue comparisons hub sets Deepvue against MarketSurge, TradingView, TC2000, TrendSpider, and Finviz feature by feature, and the compare category collects every comparison article in one place.
What Traders Say About Deepvue
The charting side of the platform, in reviewers’ own words.
“Amazing charting capabilities and key financial numbers in a clean, quick manner.”
A customer testimonial on deepvue.com. See it there
“The enhanced volume indicator is awesome.”
A MarketSmith subscriber posting to r/CANSLIM. View that thread
“They use real-time data in their screening and charting tools at no extra charge.”
From u/NeosDemocritus on r/CANSLIM. Open the discussion
“Swipe mode for going through charts makes it great when on the go.”
Linutor, February 2026, reviewing the iPad app. Apple App Store
On Deepvue’s reviews page the platform averages 4.8 stars across 220 plus verified reviewers, with a 97 percent recommend rate.
Where the Charts Connect
- •Screener by pattern for formations, screener by indicator for signals, and screener by strategy for every prebuilt approach, all feeding names onto the chart.
- •Stage Analysis for the whole market read on the Weinstein stages the chart references.
- •The Position Size Calculator to size a trade from the stop the chart shows.
- •The AI Terminal for the reason behind a gap, one right click from the bar.
The Knowledge Base carries reference articles on each indicator.
What Deepvue Charts Cost
The charts, every indicator in the library, drawings, templates, workspaces and replay mode are included in Deepvue’s single plan at $49 per month, with monthly and annual options, and no charting tier or per indicator pricing.
That one plan covers:
- •The screener and its 1,152 data points.
- •Charts, watchlists, and alerts, all of them unrestricted.
- •Fully customizable dashboards, with every app in the catalog.
- •The Theme Tracker, Market Brief, and AI Terminal, the last with unbounded usage.
Deepvue has one plan, so there are no tiers to compare. For reference, MarketSurge, the legacy platform in this niche, runs $149 per month.
New subscribers also get a one on one onboarding session with a Deepvue team member, an onboarding email series covering platform features and use cases, and weekly live webinars that each go deep on one part of the platform.
Stock Charts Built for the Way You Trade
A chart is where every trading decision finally gets made. Most stock market trading charts, however customizable, were designed by people who were not making those decisions.
These were. One search, a pinned toolbar, indicators that draw the base and mark the volume, an anchored VWAP that anchors itself, and a replay mode that turns history into practice, all inside the platform that found the stock in the first place. Customizable stock market trading charts, built by people who use them.
Join Deepvue and build your daily chart template tonight.
↑ Back to contentsFrequently Asked Questions
Questions about the stock charts, answered from the platform and the co founders’ walkthroughs.
How do you read a stock chart?
You read a stock chart by starting with the timeframe, then price, then volume. Each candle gives the open, high, low and close, with the body showing the range between open and close, and volume beneath shows the conviction behind the move. On Deepvue charts, the data line reads all of it for the bar under your crosshair.
What is the best time frame for swing trading charts?
The best time frame for swing trading charts is the daily, with the weekly confirming the bigger trend and an intraday chart fine tuning the entry. Deepvue’s key moving averages indicator projects a weekly average onto the daily chart, so you get the higher timeframe read without leaving the lower one.
What is the difference between a candlestick chart and a bar chart?
The difference between a candlestick chart and a bar chart is presentation, not data: both carry the open, high, low and close. A candlestick fills the open to close range as a colored body, while a bar chart shows the four points as tick marks. Deepvue ships both among its 19 chart types.
Why does volume matter on a stock chart?
Volume matters on a stock chart because it is the conviction behind the move: a breakout on heavy volume suggests broad participation, while the same breakout on thin volume usually fails. That is why Deepvue rebuilt its volume panel to flag pocket pivots, dry ups, accumulation, distribution and highest volume readings.
Should I use a linear or logarithmic scale?
You should use a linear scale for short ranges and a logarithmic scale for long ones or volatile names. On a log scale equal percentage moves take equal vertical distance, so $10 to $20 looks the same as $100 to $200. In Deepvue the toggle is in the Actions tab of the chart search.
Does Deepvue use TradingView charts?
No, Deepvue does not use TradingView charts. Deepvue ran on a third party engine early on and replaced it with one written in house, which gave the team control over every feature, the speed and the reliability.
Are the stock charts real time?
Yes, Deepvue’s stock charts are real time, at no extra cost. Real time data runs through the charting and screening tools on the standard plan rather than behind a market data upgrade, which reviewers arriving from other platforms tend to single out.
What are the best stock charts for growth trading?
The best stock charts for growth trading are the ones whose indicator set matches the method: volume signatures, a relative strength line, base and pivot levels, and moving averages that work across timeframes. Deepvue’s library was built around exactly that, a different starting point from a general purpose charting platform.
What indicators should I use on a stock chart?
The indicators you should use on a stock chart are fewer than most people run: a volume study, a relative strength measure, two or three moving averages, and something that marks structure. In Deepvue, Enhanced Volume, the RS Line, key moving averages and Base Pivots map onto those four jobs.
How do you use anchored VWAP?
You use anchored VWAP by anchoring it to a bar that mattered, such as an earnings gap, a swing low or the highest volume bar in a move, so the line shows the average price paid since that event. Deepvue places those anchors automatically, including on relative volume spikes and swing points.
What is replay mode used for?
Replay mode is used for practicing decisions on historical data. Deepvue’s chart replay mode rewinds to a point you choose and plays forward a bar at a time, with every indicator recomputed as of that bar, so levels appear when they actually would have.
Where do I find indicators, drawings and chart types?
You find indicators, drawings and chart types in the search field on Deepvue’s chart toolbar, which opens a picker with tabs for indicators, templates, drawings, chart types, timeframes and actions. A right click reaches the same sections, and starring any item pins it to the toolbar.
What chart types are available?
The chart types available on Deepvue charts number 19: candlestick, CandleVolume, hollow candles, OHLC, HLC and classic HLC bars, line, line with markers, step line, area, HLC area, columns, high low, Heikin Ashi, baseline, Renko, line break, Kagi, and point and figure.
What timeframes are available?
The timeframes available on Deepvue charts run from one minute through 3, 5, 10, 15, 30, 39, 65, 78, 130 and 195 minutes, 1, 2 and 4 hours, then daily, weekly and monthly bars, and 3, 6 and 12 month bars.
What is Enhanced Volume?
Enhanced Volume is Deepvue’s volume indicator. It colors pocket pivots, dry ups, accumulation and distribution bars, and the HV Edge signatures for highest volume ever, since IPO, in a year or since earnings; labels the largest bars; projects the session’s volume from its run rate; and prints a stats strip.
What do Base Pivots and RMV Pivots do?
Base Pivots and RMV Pivots draw entry levels automatically on Deepvue charts. Base Pivots marks consolidation levels, with settings for base length, a breakout threshold that keeps a base active through shakeouts, and a merge distance. RMV Pivots uses relative measured volatility to draw the tighter areas that precede expansion.
Can the charts show a weekly moving average on a daily chart?
Yes, Deepvue charts can show a weekly moving average on a daily chart. The key moving averages indicator projects an average from a higher timeframe onto a lower one, drawing the 10 week as a stair step on the daily chart, or a daily average on an intraday chart.
How do I save my chart setup?
You save your chart setup in Deepvue automatically, since the chart keeps its state as you go. To keep an indicator set, create a template from the current chart on the Templates tab, tie it to a timeframe and star it, and use overwrite from chart to update it. Workspaces save everything together.
Are there prebuilt chart setups?
Yes, there are prebuilt chart setups in Deepvue. The workspace picker’s Preset tab holds a Deepvue folder with CANSLIM, swing trading and market analysis workspaces, and a Traders folder with setups credited to named traders, each copying across to edit as your own.
Can I see several timeframes at once?
Yes, you can see several timeframes at once on Deepvue charts. The layout picker in the Display tab splits the chart into panes, each with its own timeframe, and sync keeps the symbol and crosshair aligned as you move through a list.
Can I set an alert from the chart?
Yes, you can set an alert from the chart. In Deepvue, right click a trendline and choose the option to create an alert on it, or right click a price level, then set the conditions in the alert panel.
Do the charts work on mobile?
Yes, the charts work on mobile. Deepvue charts run in the iPad and iPhone apps, and reviewers single out the swipe mode for moving through charts.
Do the stock charts cost extra?
No, the stock charts do not cost extra. Deepvue’s full charting engine, indicator library, drawings, templates and chart replay mode are included in the standard $49 per month plan.