Find Stocks Like Leif Soreide: Think Beyond the Pattern
Last Updated:
October 5, 2026


Leif Soreide screens are three Deepvue screener presets built by Leif Soreide, the 2019 U.S. Investing Championship stock division winner. High Tight Flag, Low Tight Flag and Rocket Bases each find powerful momentum stocks pausing near their highs, at a different stage of the same move.
This guide covers who Leif Soreide is, how to open his presets in the Deepvue Screener, what each screen looks for, and how to use all three together to find tight flags and bases before the next breakout.
Leif Soreide Screens at a Glance
| Preset | What it finds | Typical setup |
|---|---|---|
| High Tight Flag | The most explosive stocks holding near their highs | Roughly 90–100%+ pole in about 8 weeks, flag no deeper than about 25% |
| Low Tight Flag | Strong momentum stocks that never quite doubled | Roughly 60–90% pole in about 8 weeks, tight flag near the highs |
| Rocket Bases | Former leaders rebuilding after a deeper pullback | Roughly 100%+ prior move, 25–50% base over 6–10 weeks |
Who Is Leif Soreide?
Leif Soreide is a momentum and breakout trader, the founder of Champion Team Trading, and the winner of the 2019 U.S. Investing Championship stock division. He finished that real-money competition with a 60.9% return, in a year marked by failed breakouts and uneven trend.
His style is influenced by CANSLIM®, but he is best known for studying exceptionally strong stocks that pause near their highs before attempting another advance – the high tight flag and its close relatives.
Never miss a Deepvue blog post.
That work produced a simple rule he calls “Think Beyond the Pattern.” A familiar shape is not enough. Soreide looks at the power of the prior move, the quality of the pause, volume behavior, relative strength, and whether the chart offers a defined entry and a clear level where the idea is wrong.
His three Deepvue presets turn that into a research process: High Tight Flag for the sharpest advances, Low Tight Flag for strong moves that never quite doubled, and Rocket Bases for former leaders that needed a deeper reset.
How to Find Leif Soreide’s Screener Presets in Deepvue
Accessing Leif Soreide’s screeners in Deepvue takes only a few steps:
- Open the Deepvue Screener.
- Click Screener Presets.
- Type “Leif Soreide” into the preset search bar.
- Open the Leif Soreide folder when it appears.
- Select one of his three presets: High Tight Flag, Low Tight Flag, or Rocket Bases.
- Review the charts and add the strongest names to a focused watchlist.
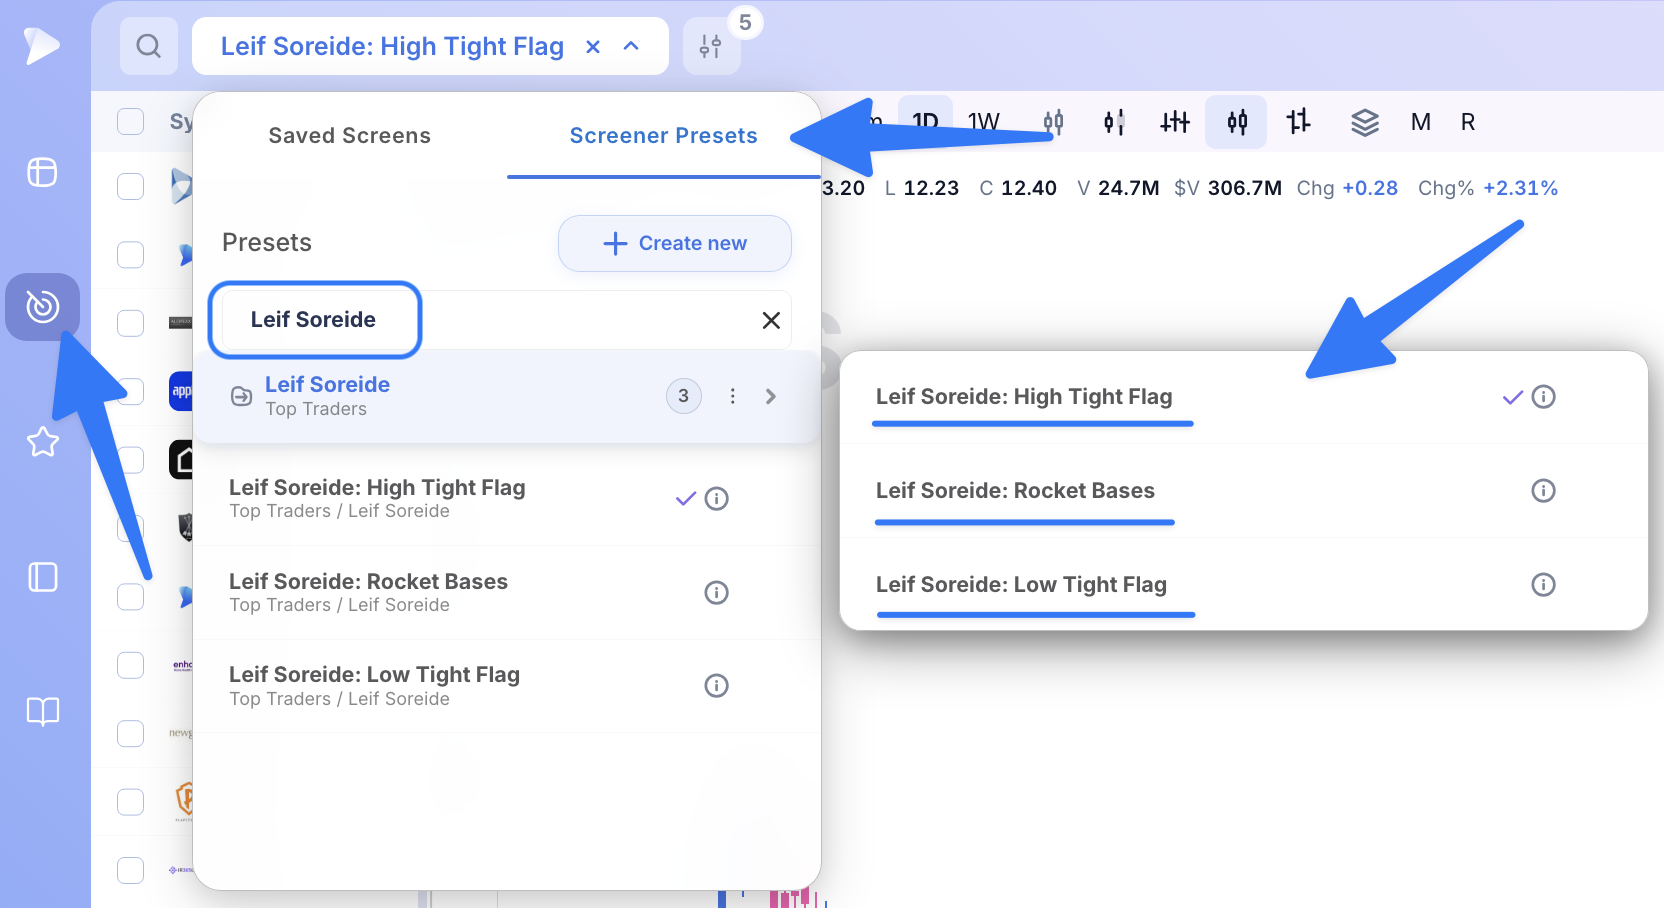
Deepvue lets you run the presets directly or duplicate and customize them for liquidity, fundamentals, or risk. Results flow straight into charts, watchlists, and alerts. These screens are starting points, not automatic buy signals – every stock still needs individual chart review, market context, an entry plan, and a clear level for managing risk.
💡 Pro Tip: Want to run these screens on today’s market? Start a Deepvue trial and the Leif Soreide presets are ready from your first login.
The 3 Leif Soreide Screens Explained
High Tight Flag Screen: Explosive Stocks Holding Near Their Highs
The High Tight Flag screen searches for stocks that have made an explosive advance and are now holding relatively close to their highs. William O’Neil popularized the pattern. Soreide uses it as the center of his process because that combination of a fast move and limited profit-taking can point to unusual demand.
A classic flagpole is a gain of roughly 90% to 100% or more within about eight weeks. The stock then forms a shallow flag, commonly three to five weeks, correcting no more than about 25% from the high. The screen can catch names still building the pole and names already forming the pause. The best candidates are not just large percentage gainers. They show supply being absorbed near a pivot a trader can actually use.
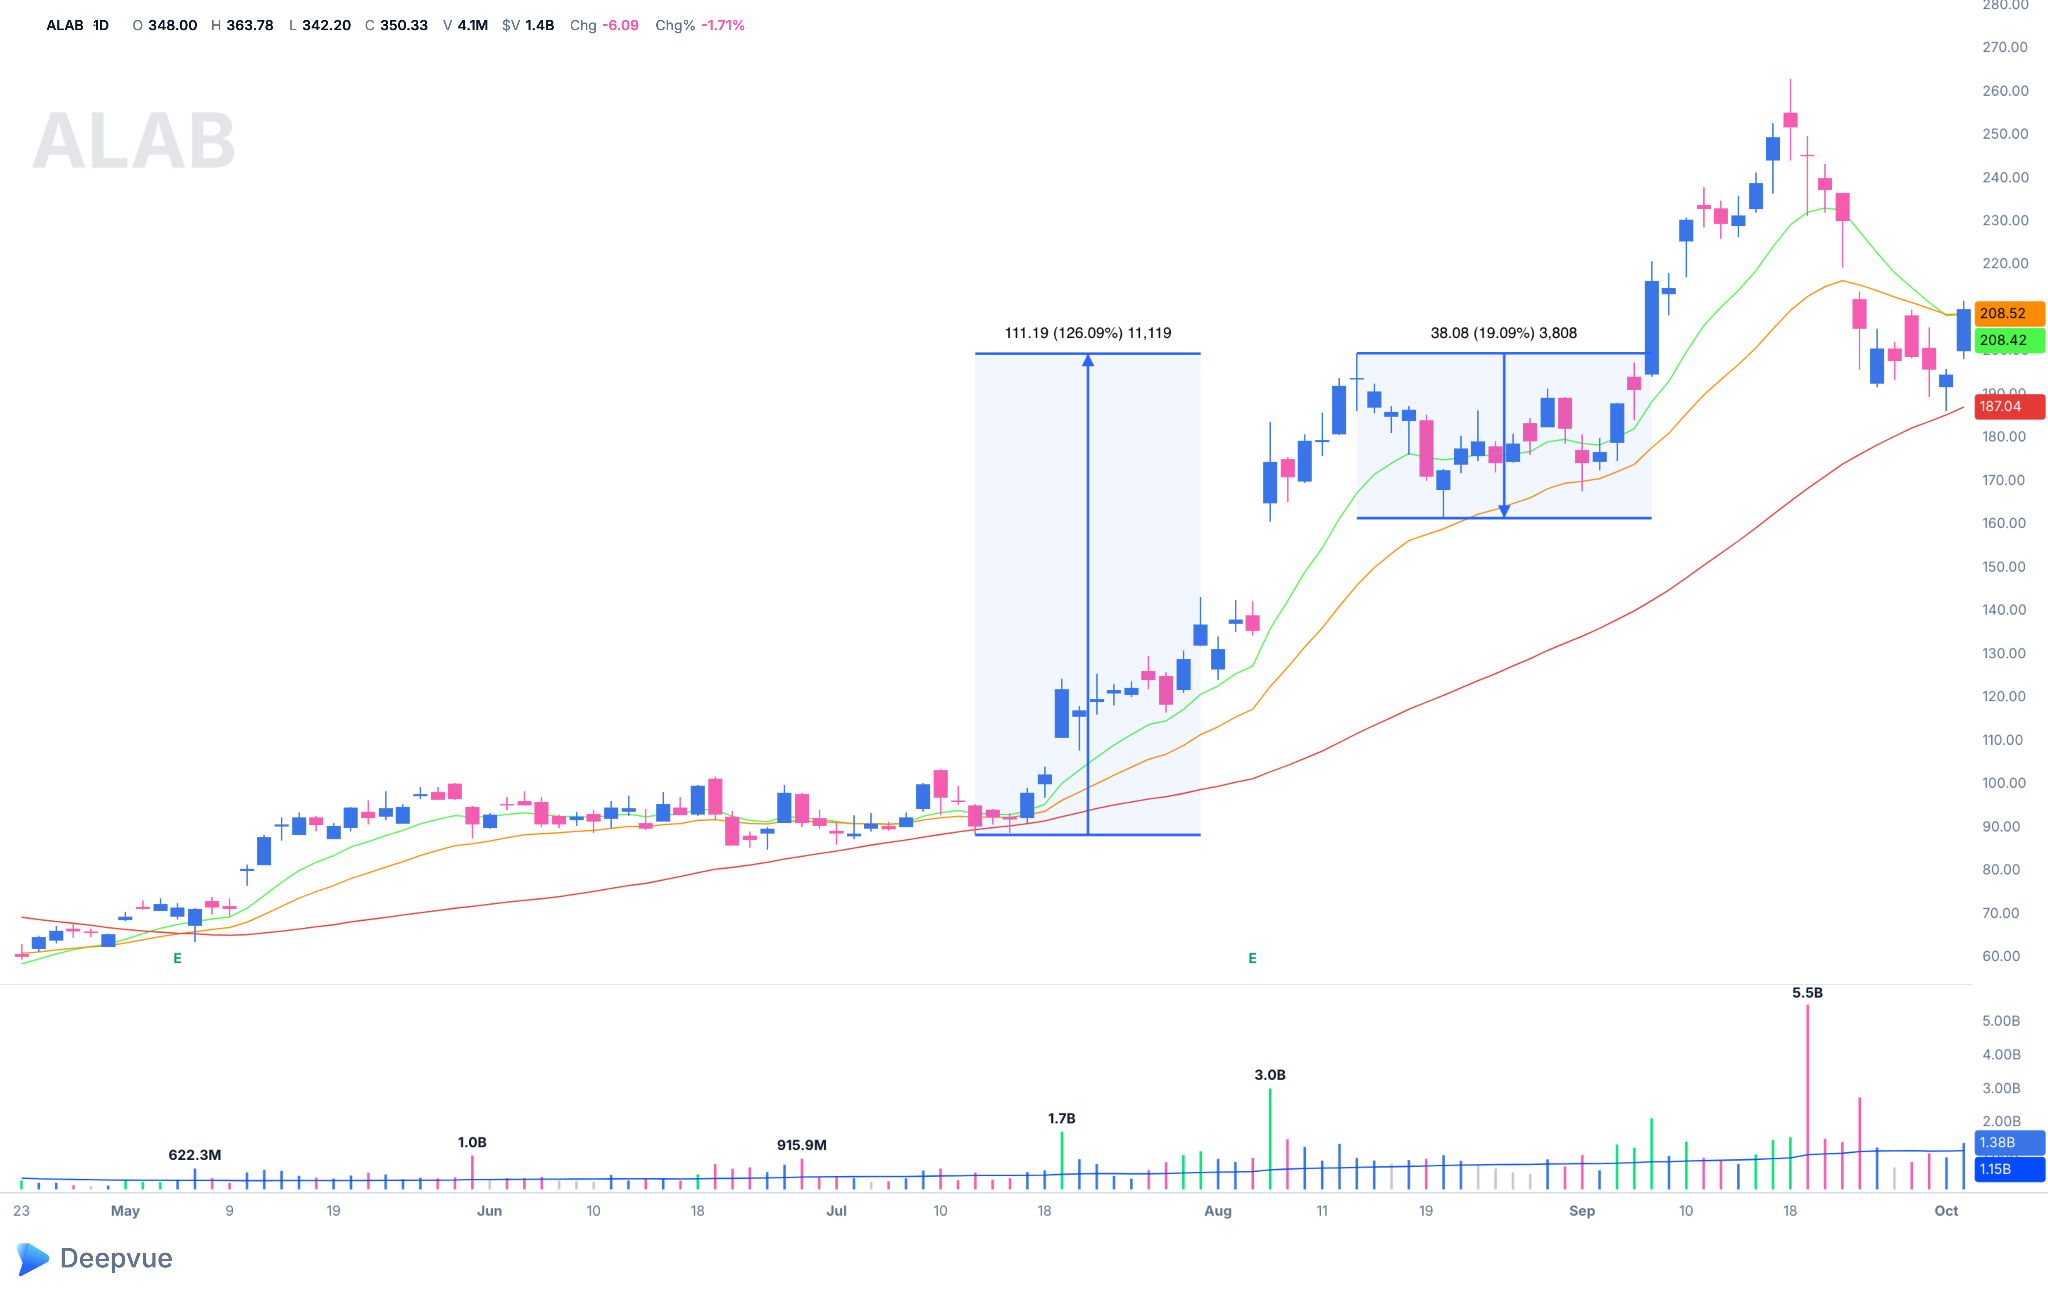
Above is a chart of ALAB in September 2025, a good example of a stock that would come up on the High Tight Flag screen, and one Leif Soreide traded. He marked the higher-low pullback as a High Tight Flag, then posted it breaking out on volume a few days later. The stock was holding near its highs, with strong relative strength, after a powerful prior advance.
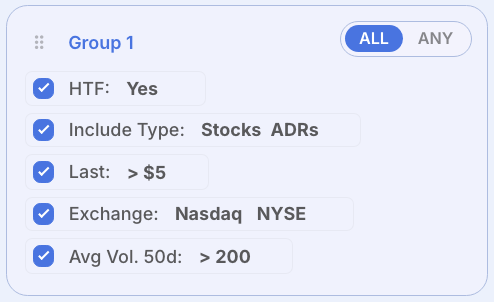
Screen criteria: Deepvue’s built-in HTF (High Tight Flag) pattern filter set to Yes, stocks and ADRs only, price above $5, listed on the Nasdaq or NYSE, plus a minimum 50-day average volume.
When reviewing results, look for:
- A steep prior advance, with limited overhead supply in the pole.
- A tight, controlled flag near the highs, generally no deeper than about 25%.
- Quieter volume as the flag develops, and a clear pivot that keeps risk defined.
Low Tight Flag Screen: Strong Moves That Never Quite Doubled
The Low Tight Flag follows the same idea but allows for a less extreme initial move. It helps uncover strong momentum stocks that may not reach the traditional High Tight Flag threshold.
In Soreide’s framework, the flagpole is about 60% to 90% within eight weeks, with the flag no more than 25% deep and 15% or less preferred. Because the advance is smaller, the stock often needs more than three to five weeks to build a valid flag. The purpose is not to find a weaker version of the High Tight Flag. It is to catch the same traits – momentum, resilience, and a constructive pause – without requiring the stock to double first.
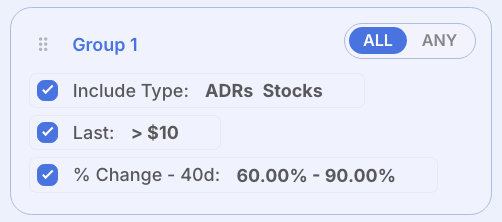
Screen criteria: stocks and ADRs only, price above $10, and a 40-day gain between 60% and 90%.
When reviewing results, look for:
- A strong prior advance and an established uptrend.
- Tight price action, with a contained pullback rather than a loose base.
- Relative strength improving as the stock approaches its pivot.
Rocket Bases Screen: Former Leaders Resetting for the Next Run
A powerful stock will not always continue straight out of its first tight pause. Sometimes an attempted High Tight Flag gets too deep, or needs more time to absorb the prior move. That is what the Rocket Bases screen is built to find.
A Rocket Base generally forms after a stock has gained roughly 100% or more within about eight weeks. The consolidation is deeper than a classic flag – more than about 25%, but typically no more than 50% – and often takes six to ten weeks. Soreide treats these as unfinished high-tight-flag stories, not broken charts. The prior move still matters. The stock just needs a longer reset before a new pivot is usable.
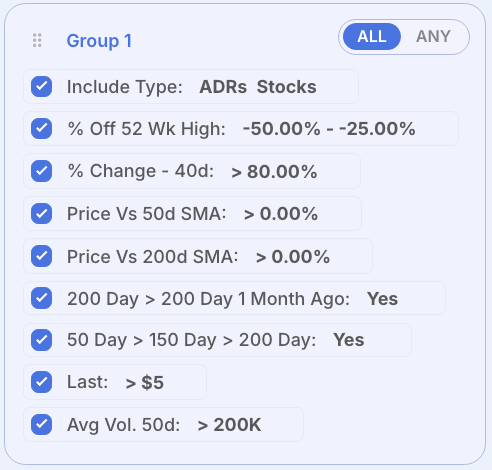
Screen criteria: stocks and ADRs only, 25% to 50% off the 52-week high, a 40-day gain above 80%, price above both the 50-day and 200-day SMAs, a rising 200-day SMA (higher than a month ago), the 50-day above the 150-day above the 200-day, price above $5, and 50-day average volume above 200K shares.
When reviewing results, look for:
- A genuinely explosive move before the base.
- An orderly reset rather than severe technical damage.
- Tightening price action and a new pivot close enough to support to define the risk.
How to Use Leif Soreide’s Presets Together
Leif Soreide’s Deepvue presets work best as one research process rather than three separate lists. Each preset highlights a different stage of unusual strength – the sharpest pause near the highs, a strong continuation with a smaller pole, or a former leader rebuilding after a deeper pullback.
The goal is to narrow a large universe of stocks into a focused watchlist, then use chart review to decide whether a real setup exists. The strongest candidates may appear in more than one preset, or keep showing up as the pattern tightens.
- High Tight Flag: Use this to find the market’s most explosive stocks holding near their highs.
- Low Tight Flag: Use this to widen the search to strong continuation setups whose flagpole was closer to 60–90%.
- Rocket Bases: Use this to revisit former momentum leaders building a deeper, longer base after a failed or unfinished flag.
A stock appearing in more than one preset deserves added attention. A name that builds a pole on the High Tight Flag screen and later shows up as a Rocket Base may be shifting from a failed short pause into a larger, still-constructive reset. A Low Tight Flag that also shows group leadership and a rising relative strength line into the pivot may deserve a closer look than a tight chart in a lagging group. Deepvue’s combo lists make that overlap easy to spot.
The presets identify where unusual strength may be developing. Chart review determines whether the stock is actionable, where the entry belongs, and where the setup would be invalidated.
Key Takeaways From Leif Soreide’s Strategy
Leif Soreide’s approach shows how unusual strength, a constructive pause, and a defined pivot can turn a rare pattern into a repeatable research process. The percentages matter. The context around them matters more.
“Think Beyond The Pattern! While chart patterns and entry techniques are useful, it is more important to buy market leaders or hot themes. When the ‘street’ is caught underinvested in a theme, it’s highly likely they will get involved and buy the leadership.”
Leif Soreide, on X, September 25, 2025
Here are the biggest takeaways from his trading strategy:
- Start with real power – A quiet stock that merely looks tight is not the same as a stock that has already made a sharp advance and then paused.
- Judge the pause, not just the shape – Tight action, quieter volume, and a pullback inside the stated depth tell you more than the pattern name.
- Use the three screens as stages – High Tight Flag, Low Tight Flag, and Rocket Bases cover different points in the same momentum cycle.
- Do not discard a failed flag too quickly – If the pole was real and the reset stays orderly, a Rocket Base can be the second look.
- Balance strength with timing – A powerful stock can still be too extended. Wait for a pivot that offers a logical entry and a nearby stop, then size it with the position size calculator.
- Keep risk defined – Every candidate needs a level that says the setup is no longer working. Strong selection matters, but protecting capital keeps you ready for the next one.
Leif Soreide’s strategy is a reminder that the screen only finds the candidate. Study how a stock digests a powerful move, wait for demand to return near a definable pivot, and skip the names that cannot offer one.
More Screens From Top Traders
Want to compare approaches? Deepvue has presets from other professional traders too:
- Qullamaggie screens – high tight flags, episodic pivots and continuation bases.
- Mike Webster screens – relative strength on down days and hard tape leaders.
- Oliver Kell screens – the Cycle of Price Action in five presets.
- Pradeep Bonde screens – momentum bursts and 4% movers on volume.
- Matt Caruso screens – how an investing champion finds leaders.
- All Deepvue screener presets – the full library, organized by trader and strategy.
Ready to find the next high tight flag? Try Deepvue and run all three Leif Soreide screens on today’s market.
This article is for educational purposes only and is not financial advice.
Frequently asked questions
CAN SLIM® is a registered trademark of O’Neil Capital Management, Inc. (U.S. Reg. No. 3,081,940). Deepvue is not affiliated with, sponsored by, endorsed by, or licensed by O’Neil Capital Management, Inc., Investor’s Business Daily, MarketSurge, or their affiliates. Any reference to CAN SLIM® is for descriptive purposes only. Deepvue’s scores, ratings, and screeners are independently calculated by Deepvue and are not the proprietary ratings of MarketSurge or IBD.