The Qullamaggie Episodic Pivot Screener That Catches the Catalyst Day
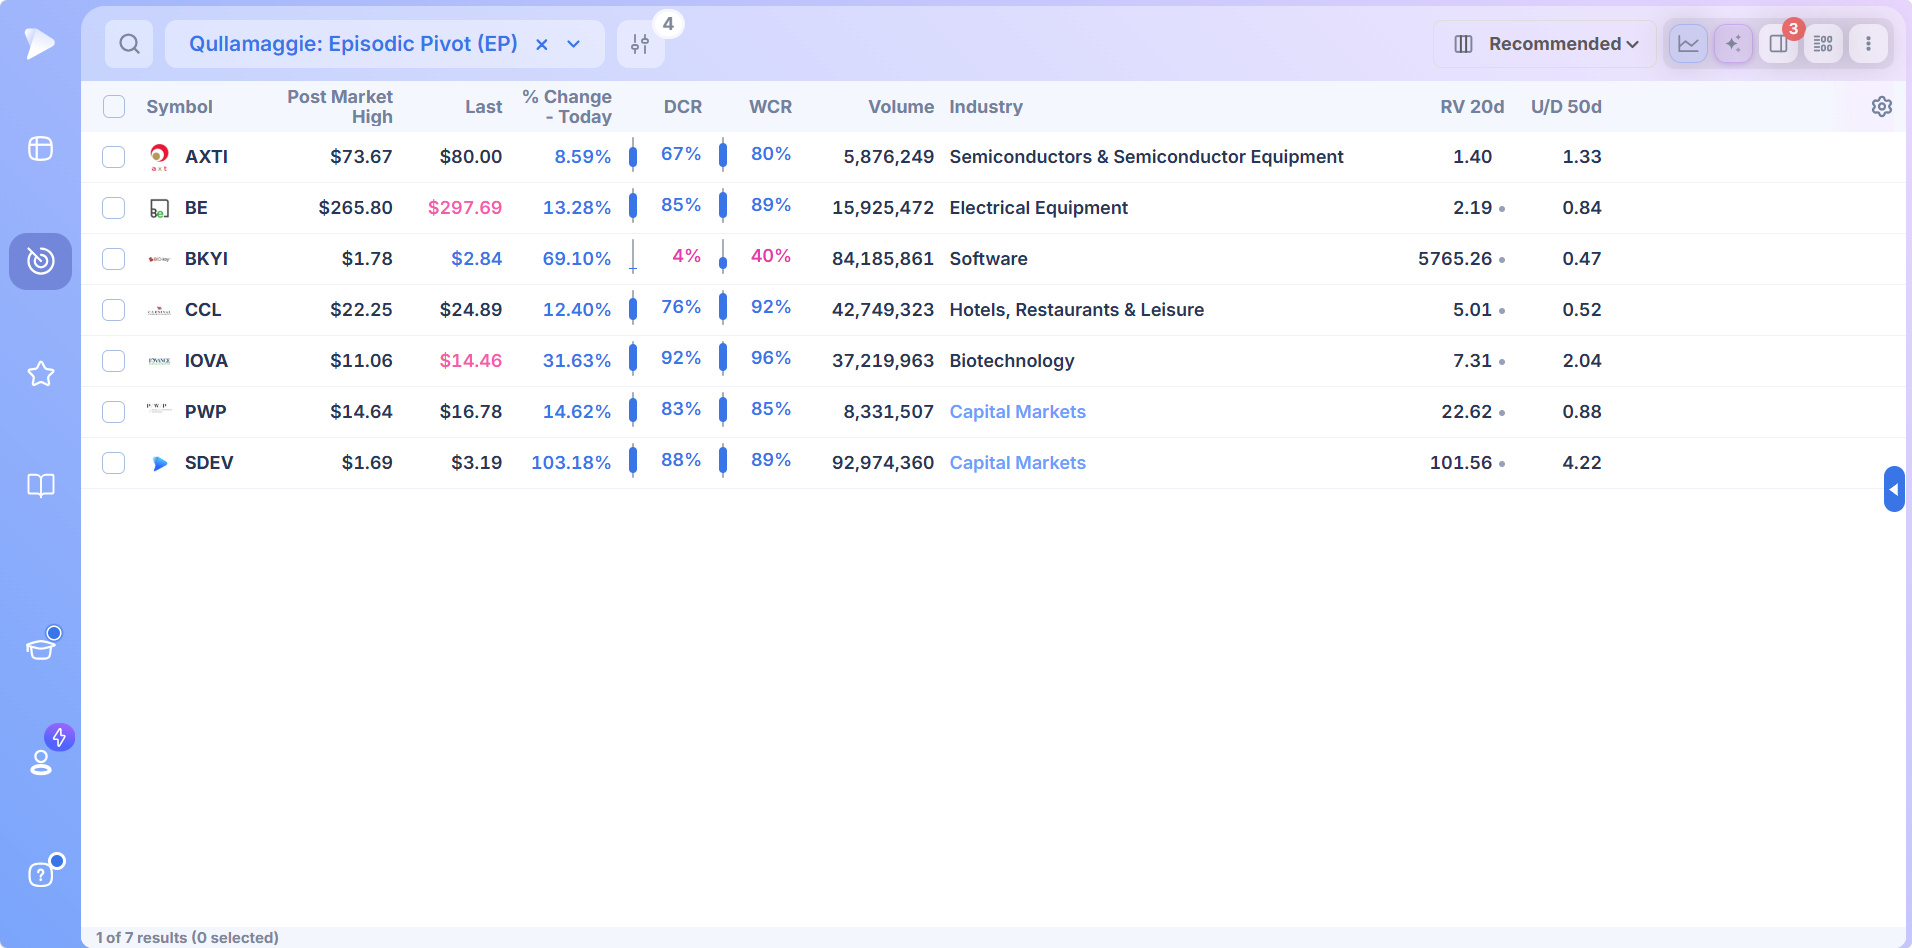
An episodic pivot (EP) is a gap up of roughly 10% or more on massive volume, driven by news that forces the market to reprice a stock. Deepvue ships Qullamaggie’s episodic pivot screener as a Top Traders preset: liquid stocks up more than 7.5% on the day, closing above the prior day’s high, on over $100 million in dollar volume. $49 a month.
Key Takeaways
Most big winners start on one day. A contract, an approval, an earnings print nobody modeled, and a stock that drifted sideways for months opens 20% higher on ten times its normal volume. Kristjan Kullamägi, the Swedish trader known as Qullamaggie, built a large part of his record on that day, and he calls the setup an episodic pivot.
The trouble is finding them before the first hour is over. Deepvue’s screener carries the Qullamaggie episodic pivot screen as a ready made preset, so the gap, volume and close tests run for you and the only work left is judging the story behind each name.
- ✓An episodic pivot is a gap up on a catalyst big enough to change how the market values the company
- ✓The best ones come from stocks that went sideways or down for months before the news
- ✓The preset tests four conditions: up more than 7.5%, close above yesterday’s high, over $100 million traded, common stocks and ADRs
- ✓The screen finds the candidates, and the catalyst decides which one is a trade
- ✓Entry is the opening range high and the stop is the low of the day, so risk is defined before you buy
- ✓The preset, the columns, the charts and the alerts all come on one $49 a month plan
What Is an Episodic Pivot?
The term comes from Pradeep Bonde, who writes as Stockbee and spent years cataloging what the biggest moves of each quarter had in common. His answer was an episode: a single piece of news that catches the market off guard and forces a revaluation, followed by a stock that keeps going for days, weeks and sometimes months.
Qullamaggie took the idea, gave it an entry and a stop, and made the EP setup one of the three Qullamaggie setups behind his published returns. In his words the news is rocket fuel. Without it, a gap is just a gap.
The Qullamaggie Episodic Pivot Rules
The Qullamaggie strategy is unusually well specified for a discretionary setup. These are the criteria he has published for a proper EP.
| Element | What Qullamaggie looks for |
|---|---|
| Gap | Up 10% or more from the prior close, ideally much more |
| Volume | Massive. The stock trades its average daily volume in the first 15 to 20 minutes, often quicker |
| Prior action | Sideways or down for three to six months or more. A stock already in a strong uptrend follows through less |
| Catalyst | Earnings or guidance, a contract or partnership, an FDA decision, a regulatory change, or a sector wide move |
| Entry | The break of the opening range high on the 1, 5 or 60 minute chart, adding as higher timeframes confirm |
| Stop | The low of the day, and never more than 1 to 1.5 times the average daily range from entry |
Earnings are the easiest EPs to find and to understand, which is why they make up most of the good ones. Biotech approvals are the hardest, because the reaction depends on what was already priced in.
Why the Best EPs Come From Neglected Stocks
A stock that went nowhere for six months has no crowd in it. Nobody is sitting on gains they want to take, and the funds that will eventually own it haven’t started buying. When the news lands, that vacuum is what lets the move run.
The same news on a stock that already ran 200% off a previous EP usually produces one big candle and a fade. The catalyst is real, but the people who would react to it are already in.
The Catalyst Is the Whole Trade
Every result on an episodic pivot screen needs the same question asked of it: does this change what the company is worth? Some examples of what qualifies, drawn from the kinds of names that show up in the screen week to week:
- •An agreement with a much larger company that opens a distribution channel or a revenue line the market hadn’t modeled
- •An earnings report where the guidance, not just the quarter, resets expectations for the next year
- •A regulatory decision that removes the thing holding the stock back, or hands a whole sector a tailwind
- •A new product or contract that plausibly changes the company’s growth rate rather than one quarter’s numbers
A 10% move on a broker upgrade, an index inclusion or a short squeeze is a gap up, and it will pass any gap up screener, this one included. It isn’t an episodic pivot, and it doesn’t get the follow through. That judgment is yours, and it’s the part no filter can make for you.
Delayed Episodic Pivots
Sometimes the market takes a day or two to digest the news. The stock gaps, closes flat, then breaks out a few sessions later as the story gets absorbed. Stockbee calls these delayed episodic pivots, and they matter for screening because the breakout day still shows up as a big move on heavy volume, even though the catalyst is a few days old. When a result appears, check the news from the past week, not just the past morning.
Why Episodic Pivots Are Easy to Screen For and Hard to Trade
Unlike a chart pattern, an EP setup has a clean mechanical signature: a large percent change, a close above yesterday’s high and an outsized amount of money changing hands. Any screener with those three fields can find the day’s candidates in seconds, and that’s exactly the problem. The list is easy, so everyone has it.
The edge is in what happens after the screen runs. Reading the catalyst, checking the prior six months of price action, judging whether the volume is truly abnormal for that stock, and having the chart, the earnings history and the alert tools in the same window so the decision happens before the opening range resolves. That’s where a platform earns its place, and where an episodic pivot stock screener stops being a list and becomes an episodic pivot trading strategy you can actually run.
Why Deepvue Is the Best Episodic Pivot Screener
Deepvue ships the Qullamaggie scan as a preset, streams the volume and closing range fields live during the session, and puts the chart, the fundamentals and the alert one click from every row. A Qullamaggie screener needs all of that to be worth opening at 9:35, and an episodic pivot screener without the chart beside it is only half the job.
A Qullamaggie Scanner That’s Already Built
Open the screener, click the screen name drop down, choose Screener Presets, and type EP or Qullamaggie. The preset is in the Top Traders category alongside his other Qullamaggie scans, and one click loads it.
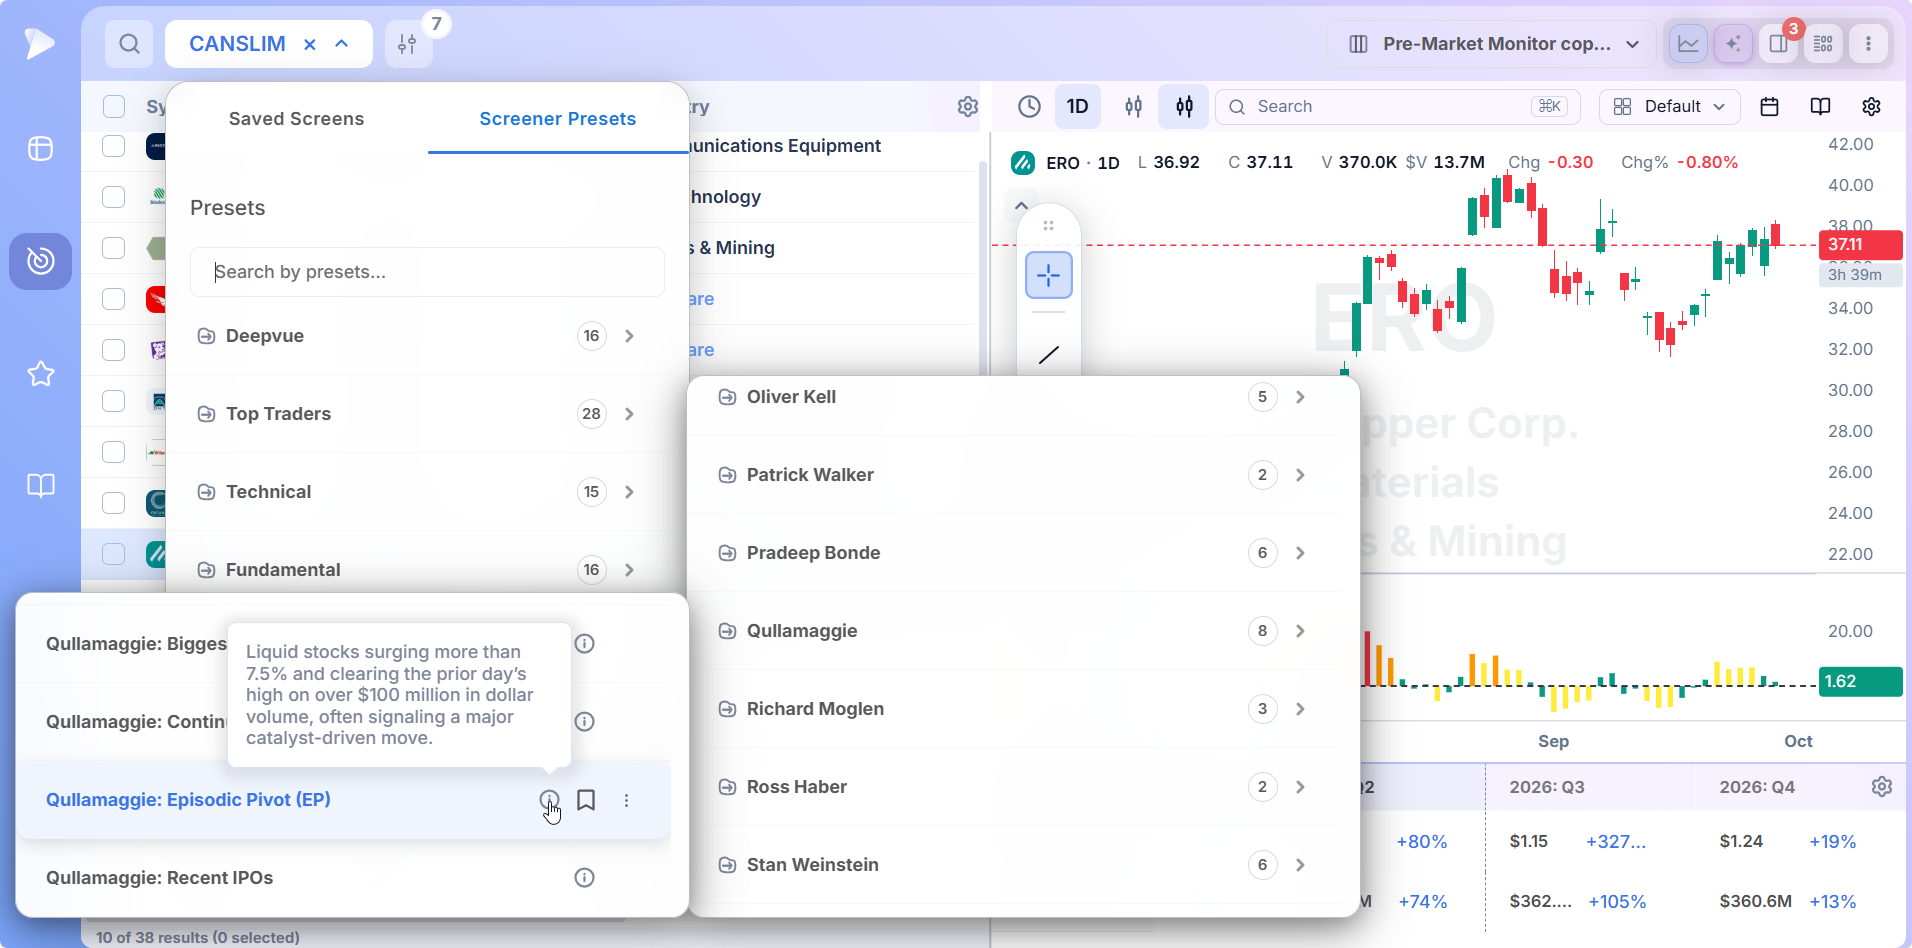
Presets are locked so the original can’t be edited by accident. Duplicate it and every threshold is yours to tighten.
What the Four Conditions Do
The preset description says it plainly: liquid stocks surging more than 7.5% and clearing the prior day’s high on over $100 million in dollar volume, often signaling a major catalyst driven move. Each condition does a specific job.
- •Percent change today above 7.5%. Wide enough to catch EPs that open at 8% and keep building through the session. Qullamaggie’s own threshold is 10%, and you can raise it in a duplicated copy.
- •Close above yesterday’s high. This is the gap test. A stock that trades above the entire prior day has left every holder from yesterday in profit and every short from yesterday under water.
- •Dollar volume above $100 million. Liquidity, and proof that real money is behind the move. A 30% gap on $4 million traded is a different animal.
- •Common stocks and ADRs only. No ETFs, funds or warrants, so every row is a company with a story to check.
Reading the Results Table
The columns that matter for this setup are percent change, daily and weekly closing range, volume, 20 day relative volume and the 50 day up/down volume ratio. Closing range tells you whether buyers held control into the close, which is the difference between an EP and a gap that faded. Relative volume tells you how abnormal today is for that specific stock, which is the volume test Qullamaggie runs by eye.
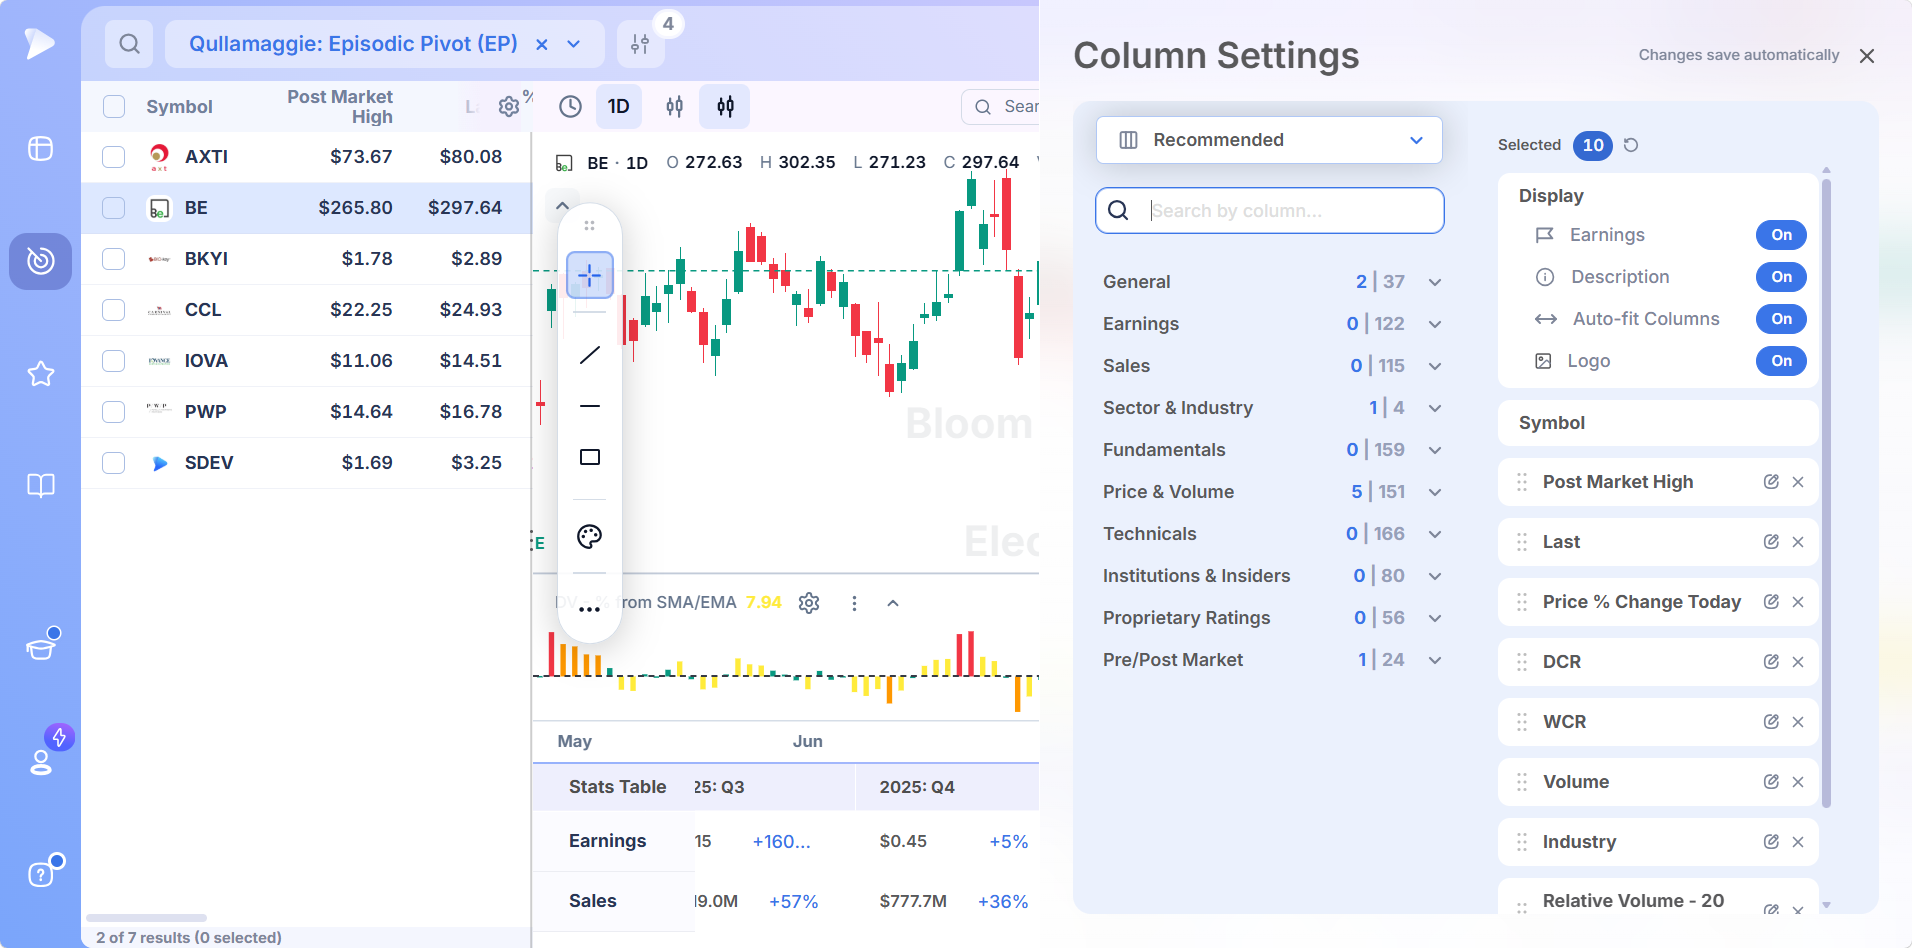
Set the columns once, save the layout, and the Qullamaggie screener opens ready for this job every time.
Chart and Stats Without Leaving the Screen
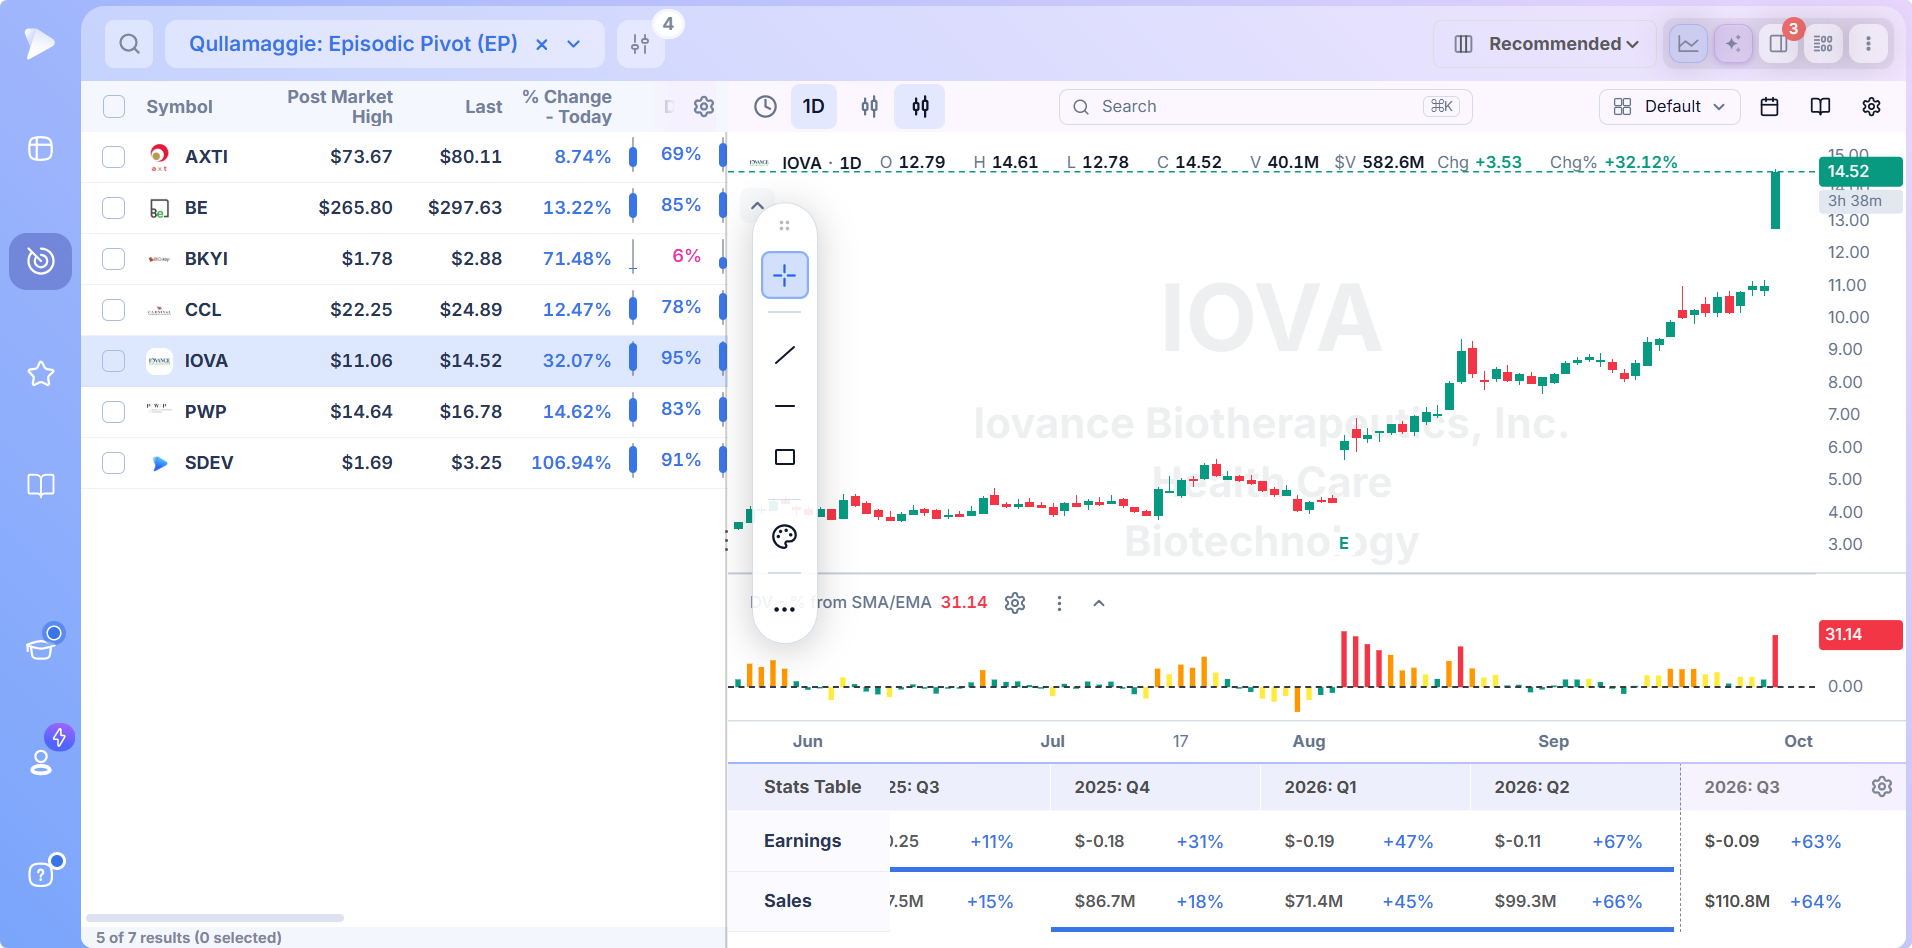
Click any row and the chart opens beside the results, with the quarterly earnings and sales stats table directly below the price action. For an earnings EP that table is the catalyst: you can see whether the quarter that caused the gap is a one off or the third in a row of acceleration, without opening another tab.
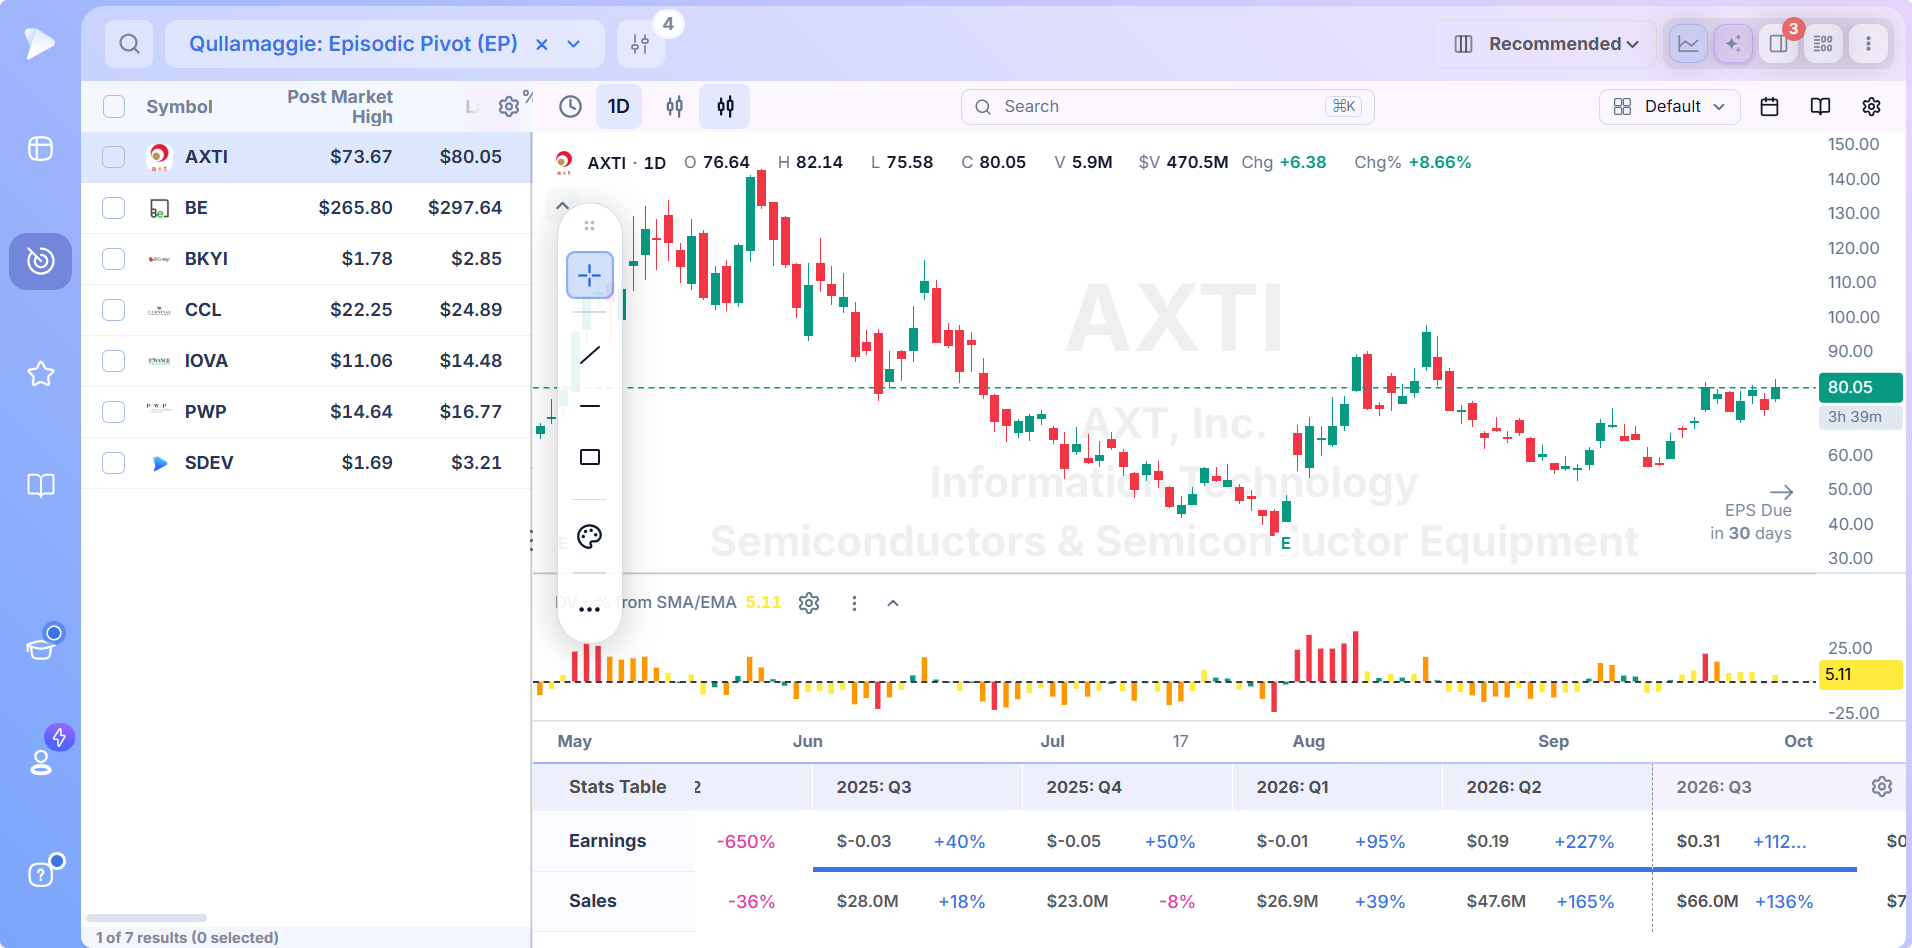
The six months before the gap are visible in the same pane, which is how you check the neglect rule. A flat base leading into the candle is what you want. A stock that already doubled into the news is what you don’t.
From Candidate to Position
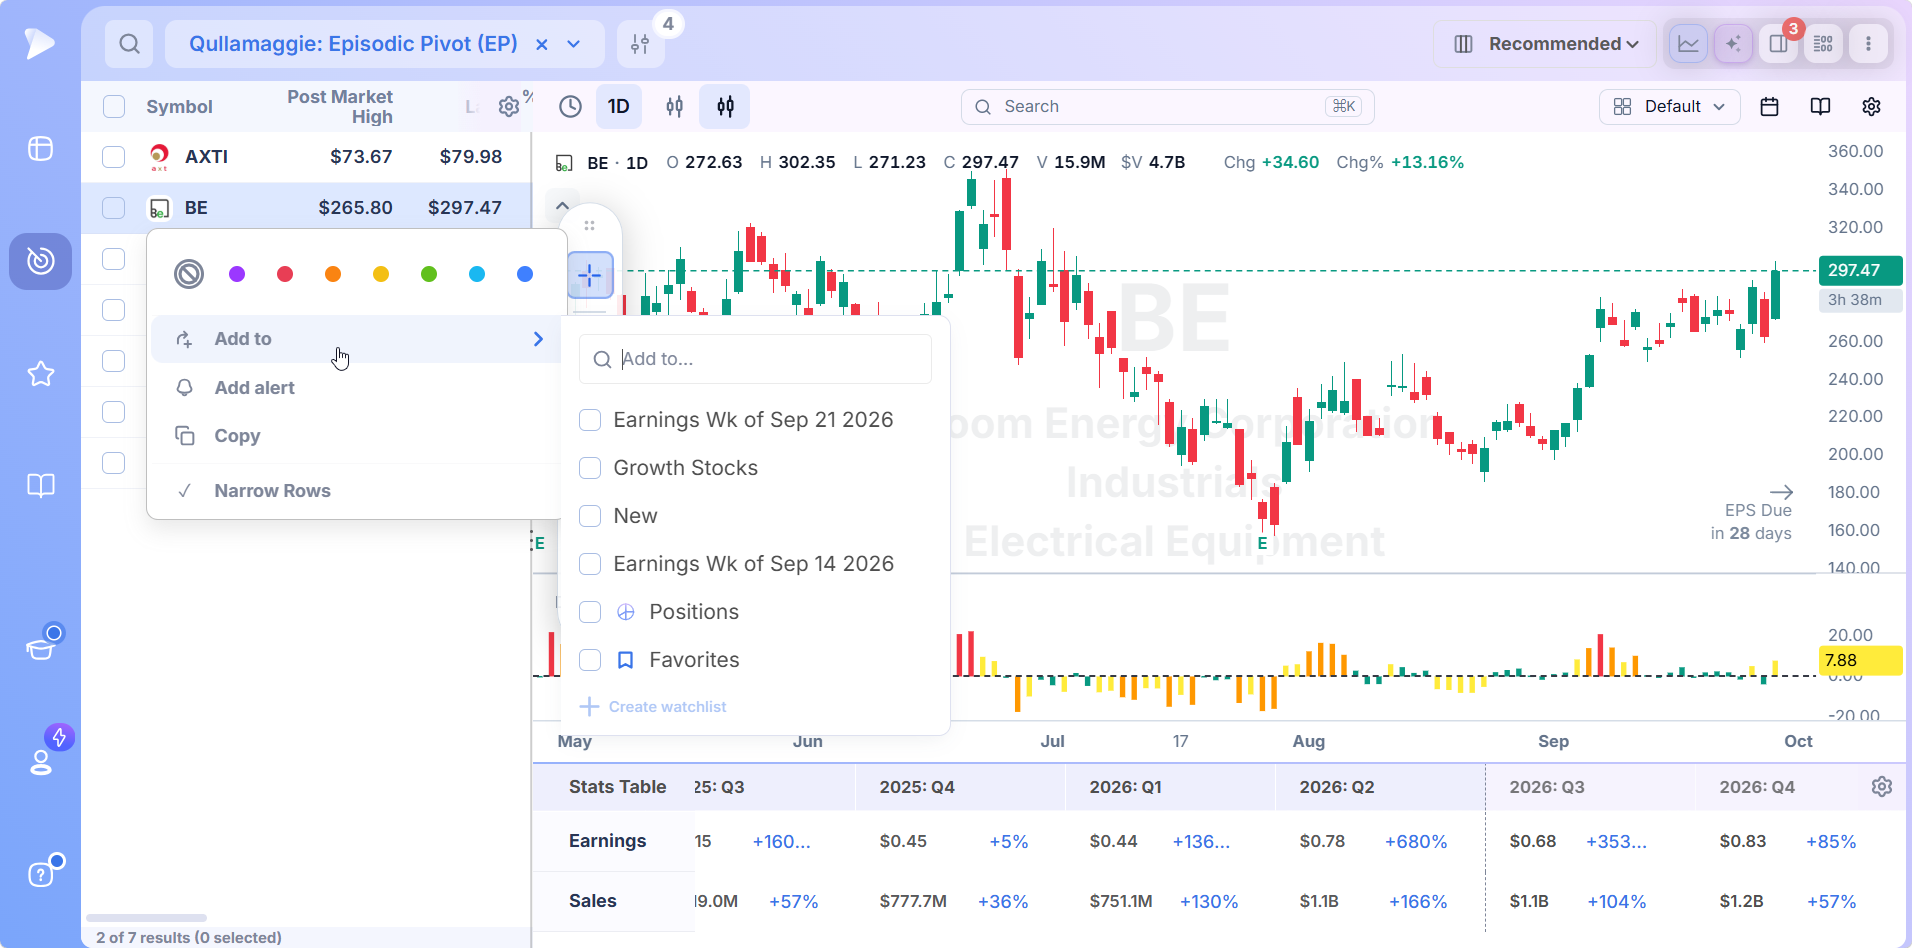
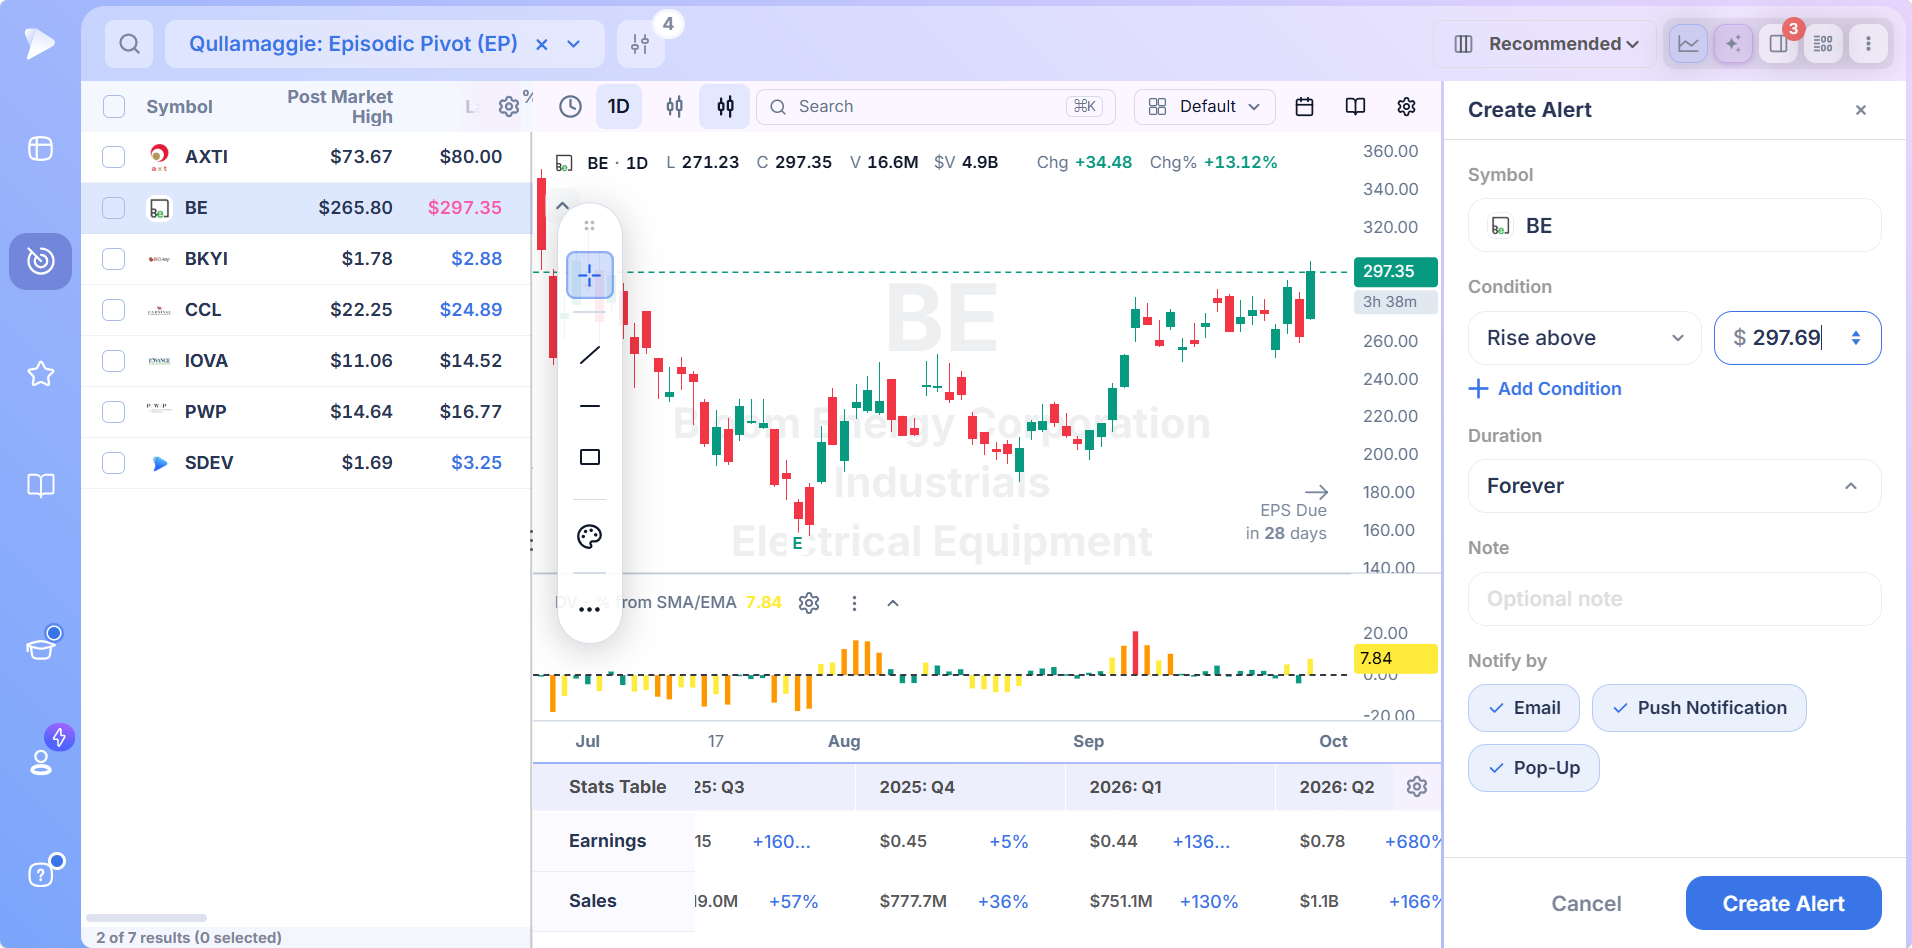
Right click a row to send it to a watchlist or set an alert at the opening range high or the low of the day. Both levels exist by 9:35, so the trade is planned while the first candles are still forming.
How to Build Your Own Episodic Pivot Stock Screener
Start from the preset and shape it to how you trade. Six steps, then it stays saved.
Open the Qullamaggie Episodic Pivot preset and duplicate it to unlock every condition.
Raise the percent change threshold to 10% if you want Qullamaggie’s strict definition, or leave 7.5% to catch the ones still building.
Add 20 day relative volume above 3 or higher, so the volume has to be abnormal for that stock, not just large.
Add a daily closing range minimum around 60% to drop the gaps that faded into the close.
Add a distance from the 52 week high or a low six month performance condition to favor stocks that were neglected before the news.
Finish with an earnings date filter if you only want earnings EPs, or leave it open during the weeks between seasons.
Quicker to describe it? The AI Terminal turns a sentence like “stocks up more than 10% today on five times average volume that were flat for six months” into a working screen you can then tune.
How to Trade an Episodic Pivot
The Qullamaggie episodic pivot strategy is specific about the entry and the stop, and deliberately vague about everything after, because the exits are where you have to develop your own feel. Here is the part he has spelled out.
Entry at the Opening Range High
Let the first minute print, then the first five. When price breaks the high of that opening range on volume, that’s the entry. If it holds, add as the 5 minute and 60 minute highs break, which is how a starter position becomes full size with confirmation at each step. Missing the first break isn’t a problem: the 60 minute high is still a valid entry, and being first in was never the point.
Where the Stop Goes
The low of the day, always. If the stock trades back through it, the buyers who created the gap have been overwhelmed and the thesis is finished for now. That distance should be no more than 1 to 1.5 times the average daily range, and the position size calculator turns it into a share count before you click buy.
Selling Into Strength and Trailing the Rest
The pattern Qullamaggie has described publicly is to sell a portion into strength over the first three to five days, then trail the remainder on the 10 day or 20 day moving average and hold until it closes below. That keeps a piece of the position in the ones that turn into multi month trends while banking something on all of them.
Episodic Pivot, Buyable Gap Up or Breakout?
Three names for gaps that traders mix up, and they describe different situations:
- •Episodic pivot. A catalyst gap from a neglected stock. Entered on the opening range high, stopped at the low of the day.
- •Buyable gap up. A gap out of a base in a stock already showing leadership, from the O’Neil school. Same day, different prior action.
- •Breakout. Price clearing a level on volume with no gap required, usually after a consolidation the screen can measure.
The buyable gap up screener covers the second case, and the premarket stock screener is where tomorrow’s EPs show first, since the heaviest ones trade their average volume before the open. Run the Qullamaggie screen after 9:35 and the premarket screen before it, and you’ll see the same names from both sides.
When an Episodic Pivot Should Be Ignored
Episodic pivot trading is mostly a discipline of declining. An episodic pivot scanner will hand you ten names on a busy earnings morning and two of them are trades.
- •No real catalyst. Sympathy moves, upgrades and squeezes pass the filters and fail the follow through.
- •Already extended. A gap on a stock that ran hard into the news is usually the last move, not the first.
- •Thin volume for the stock. $100 million traded is the floor. If relative volume is under two, the market didn’t care as much as the headline did.
- •A weak close. A closing range in the bottom third means sellers met the gap. Real EPs close near the high.
- •Wrong market. EPs cluster in the three or four weeks of earnings season and work best when the index is cooperating. In a correction the same setup fails more often, and the stop still costs the same.
Who Gets the Most From This Screen
- •Traders who follow the Qullamaggie setups and want his EP scan without building it by hand
- •Swing traders who want to be in the first day of a move instead of chasing it a week later
- •Part time traders, because EPs concentrate into a few weeks each quarter
- •Anyone who wants the stop defined before the position is opened
- •Earnings season traders who want the chart and the quarter’s numbers in one window
Pricing
$49 a month on a single plan, nothing gated.
- •Every preset, this one included, fully editable once you duplicate it
- •The complete field library, so percent change, dollar volume, relative volume and closing range filter together
- •Charts, watchlists, alerts and saved layouts, the route from the opening range to the stop
- •Live data through the session, which matters because the entry decision comes in the first hour
The comparable platform, MarketSurge, is $149 a month.
New accounts include a setup call, introductory emails and weekly webinars that each take one module apart.
Trade the Day the Story Changes
Every big move has a first day, and on that day the crowd hasn’t formed yet. An episodic pivot screener puts you in front of the candidates while the opening range is still forming, a Qullamaggie scanner that runs while you read the news, and the rest is the judgment Qullamaggie says takes three or four earnings seasons to build.
This screen is one of the Top Traders presets gathered under stock screener by trader. Chart formations are collected under stock screener by pattern, screens tied to the trading session under stock screener by market timing, and screener by strategy contains the best screeners based on specific trading strategies.
Run the episodic pivot screen this earnings season
↑ Back to contentsFrequently Asked Questions
What is an episodic pivot?
An episodic pivot is a gap up of roughly 10% or more on massive volume, caused by news that forces the market to reprice a stock. The term comes from Pradeep Bonde of Stockbee, and Qullamaggie made it one of his core setups. Deepvue screens for it with a built in preset.
What is the Qullamaggie strategy for episodic pivots?
The Qullamaggie strategy for episodic pivots is to buy a catalyst driven gap up in a stock that was neglected for months, enter on the opening range high, stop at the low of the day, sell part into strength and trail the rest on a moving average. Deepvue’s preset finds the candidates each morning.
What are the criteria in the Qullamaggie EP screener on Deepvue?
The criteria in the Qullamaggie EP screener on Deepvue are a percent change today above 7.5%, a close above the prior day’s high, dollar volume above $100 million, and common stocks or ADRs only. Duplicate the preset and every threshold can be changed.
How big does the gap need to be for an episodic pivot?
The gap for an episodic pivot needs to be about 10% or more by Qullamaggie’s definition, and the biggest EPs are far larger. Deepvue’s preset uses 7.5% to catch moves still building through the day, and the threshold is yours to raise in a copy.
What is a delayed episodic pivot?
A delayed episodic pivot is one where the stock doesn’t run on the news day but breaks out a few sessions later as the market digests the catalyst. It still appears on a Deepvue episodic pivot screen, because the breakout day has the same big move and heavy volume.
Where do you put the stop on an episodic pivot?
The stop on an episodic pivot goes at the low of the day, and no more than 1 to 1.5 times the average daily range from your entry. Set a Deepvue alert at that level as soon as the opening range forms and the trade watches itself.
When do you sell an episodic pivot?
You sell part of an episodic pivot into strength over the first three to five days, then trail the rest on the 10 day or 20 day moving average until it closes below. Deepvue’s chart pane shows both averages beside the screener so the exit is visible from the same window.
Is an episodic pivot the same as a buyable gap up?
An episodic pivot is not the same as a buyable gap up, though both are gap days. The EP comes from a neglected stock on a catalyst. The buyable gap up comes out of a base in a stock already leading. Deepvue has a separate preset for each.
How do you find episodic pivots?
You find episodic pivots with an episodic pivot scanner that filters for a large percent change, a close above yesterday’s high and heavy dollar volume, then check the catalyst on each result. Deepvue ships that scan as the Qullamaggie Episodic Pivot preset.
Can I change the conditions in the preset?
Yes, you can change the conditions in the preset by duplicating it, which unlocks every filter. The original stays intact, and your copy can carry a higher gap threshold, a relative volume minimum, a closing range floor or an earnings date condition.
Who is Qullamaggie?
Qullamaggie is Kristjan Kullamägi, a Swedish swing trader known for publicly documented returns built on three setups: breakouts, episodic pivots and parabolic shorts. Deepvue includes several of his screens in the Top Traders presets, including the episodic pivot screen.