Deepvue Industry Ranks: See Which Groups Lead and Which Are Improving Fastest
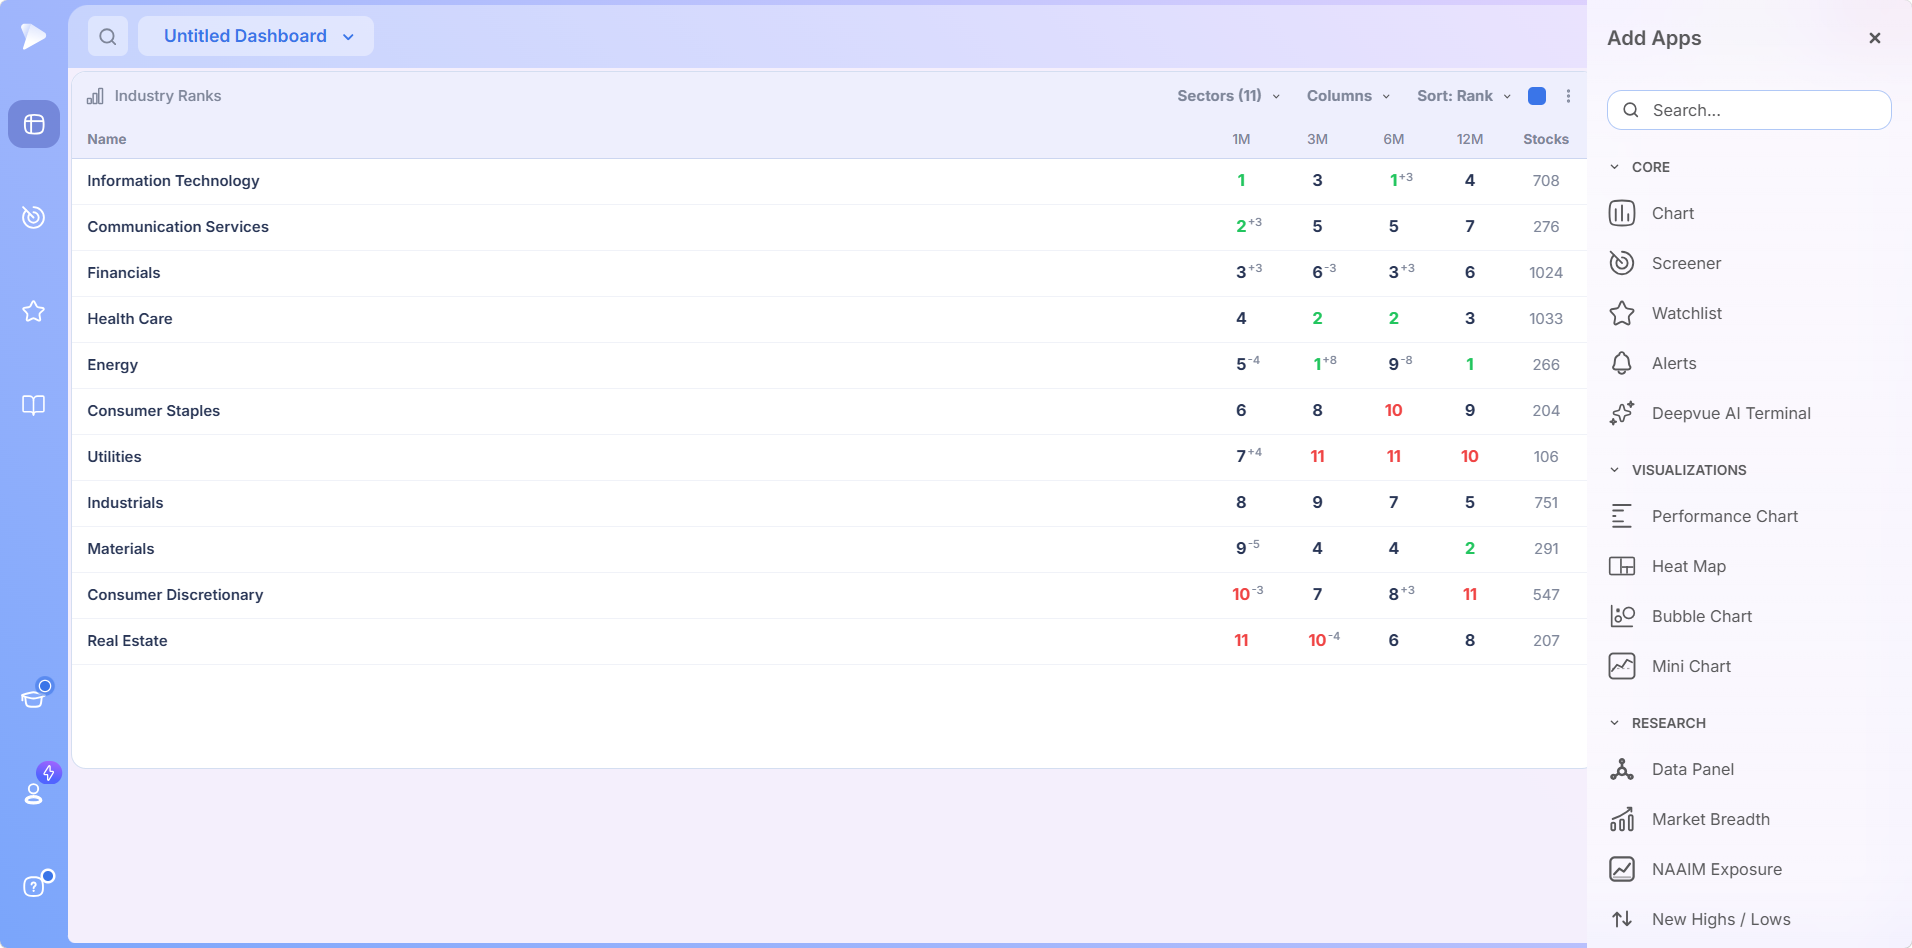
Deepvue Industry Ranks scores every part of the market against itself in one sortable dashboard table, across four levels of granularity: 11 sectors, 25 groups, 73 industries and 164 sub industries.
Each classification is ranked on up to six timeframes from 1 Day to 12 Month, with a small figure beside any rank that moved showing how many places it traveled since the last daily update. Sort by rank to see who leads, or by rank change to see who is climbing.
and the app takes seconds to add to any dashboard.
Deepvue Industry Ranks, in numbers:
Key Takeaways
Knowing that a stock is strong tells you less than knowing the group behind it is strong.
Leadership arrives in clusters, money rotates between those clusters constantly, and the traders who spot the leading industry groups before they reach the top of the leaderboard get the better entries.
Industry Ranks makes that climb visible. It is not a list of today’s winners but a running scoreboard of where every part of the market stands relative to every other part, on the horizon you choose, with the direction of travel printed alongside.
- ✓Four levels of the GICS hierarchy in one dropdown: 11 sectors, 25 groups, 73 industries and 164 sub industries.
- ✓Six timeframe columns, 1 Day through 12 Month, and you choose which appear in the table.
- ✓Rank change on every moved cell, so improvement and decay are visible without keeping your own records.
- ✓Two sort modes. Rank shows established leaders; Rank Change shows what is climbing, which is usually more actionable.
- ✓Click any row to open its members as a ranked bar chart of change against yesterday’s close, then add names straight to a watchlist.
- ✓Included in the one plan. Get started with Deepvue here.
Industry Ranks at a Glance
- Levels
- Sectors (11), Groups (25), Industries (73), Sub Industries (164), switched from the header dropdown
- Timeframes
- 1 Day, 1 Week, 1 Month, 3 Month, 6 Month, 12 Month, chosen from the Columns control
- Rank change
- A superscript beside any rank that moved since the previous daily update
- Rank colors
- Positions near the top of the field in green, near the bottom in red
- Sort modes
- Rank or Rank Change, with a column header deciding which timeframe drives the order
- Row contents
- Name, one rank per timeframe column, and the constituent stock count
- Drill down
- Opens the classification’s members as a ranked bar chart against yesterday’s close
- Quick menu
- Color coding, watchlist add and copy for every drill down symbol
- Where to find it
- Research group, Add Apps menu
- Cost
- Covered by the standard Deepvue plan
What Are the Deepvue Industry Ranks?
The Deepvue Industry Ranks app is a table of stock market industry ranks that scores every corner of the market against every other corner. It is industry rankings in the strict sense: positions, not percentages.
Rather than telling you a group is up two percent, it tells you that group ranks second out of 73 over one month, and that it has climbed eleven places since yesterday. Position and direction together, on whichever slice of the market you care about.
It is filed under Research in the app menu, alongside Market Breadth, Stage Analysis and the other market context tools, and it runs as a resizable widget on any custom dashboard.
About the screenshots below: the rankings, rank changes and stock counts belong to the day of capture, and rankings refresh daily. They show how the app is laid out and how to read it, not what the market looks like today.
Built on GICS, Which Makes It Different From the Theme Tracker
Deepvue gives you two ways to read rotation, and they are not the same tool. Industry Ranks follows the standard GICS classification system, so every classified company belongs to a sector, a group, an industry and a sub industry by formal definition rather than editorial judgment. The Theme Tracker deliberately ignores GICS and uses a curated list of themes instead.
| Industry Ranks | Theme Tracker | |
|---|---|---|
| Built on | The formal GICS hierarchy | A curated list maintained by Deepvue’s team |
| Coverage | Exhaustive and consistent, nothing missing | Selective, reflecting where money is moving now |
| Best for | Systematic top down work | Catching groups that cut across formal classifications |
| Reads as | Structure | Narrative |
Traders who use both tend to read the themes for narrative and the ranks for structure.
Who Industry Ranks Are Built For
This app suits traders who start with the market and work downward, rather than starting with a stock and hoping the group cooperates.
- ✓Swing traders hunting for groups improving quickly on shorter horizons.
- ✓Position traders who care about six and twelve month standing and want to hold inside established leadership.
- ✓Breakout traders reading rank change daily to catch rotation early.
- ✓CANSLIM traders, for whom group strength is a formal part of the selection method rather than a nice extra.
- ✓Anyone who has ever bought a good looking chart in a group that was quietly falling apart underneath it.
The Deepvue for hub pairs every trading style with the workflow built for it.
How to Read a Row
Every row carries the same elements. Once these click, the whole app is readable at a glance.
- •The name. The sector, group, industry or sub industry, depending on the level you have selected.
- •The rank, one per timeframe column. A position, not a percentage. Lower is better, so 1 is the strongest and 11 the weakest when you are looking at sectors. Ranks near the top of the field print in green and those near the bottom in red.
- •The rank change superscript. Where a small figure appears beside a rank, it shows how many places that classification traveled since the previous daily update. Positive means it climbed, negative means it slipped, and no figure means it held.
- •The stock count. How many companies belong to that classification, in the rightmost column.
Reading Across the Columns
The real information is in how the columns disagree. A classification ranking near the top on one, three and twelve months is about as consistent as leadership gets.
More interesting is a row that ranks near the top on one month after climbing several places, while ranking near the bottom over three and six months. A group improving sharply from a weak base looks nothing like one that has led all year, and only the combination of columns shows you which is which. The reverse, a long term leader slipping on the short columns, is the early warning of rotation out.
Why the Stock Count Matters More Than It Looks
A rank is a relative measure, so a top position in a large classification represents strength spread across a great many names, while a small classification can be moved by a handful of them. At sector level the largest sectors hold roughly ten times as many companies as the smallest, a tenfold difference in what a single rank describes. Always glance at the count before acting on a rank.
The Four Levels: Sectors, Groups, Industries, and Sub Industries
The first control in the header switches between the four levels of the GICS hierarchy, and the count appears in the button so you always know how many classifications you are ranking against. This one control changes the entire character of the table.
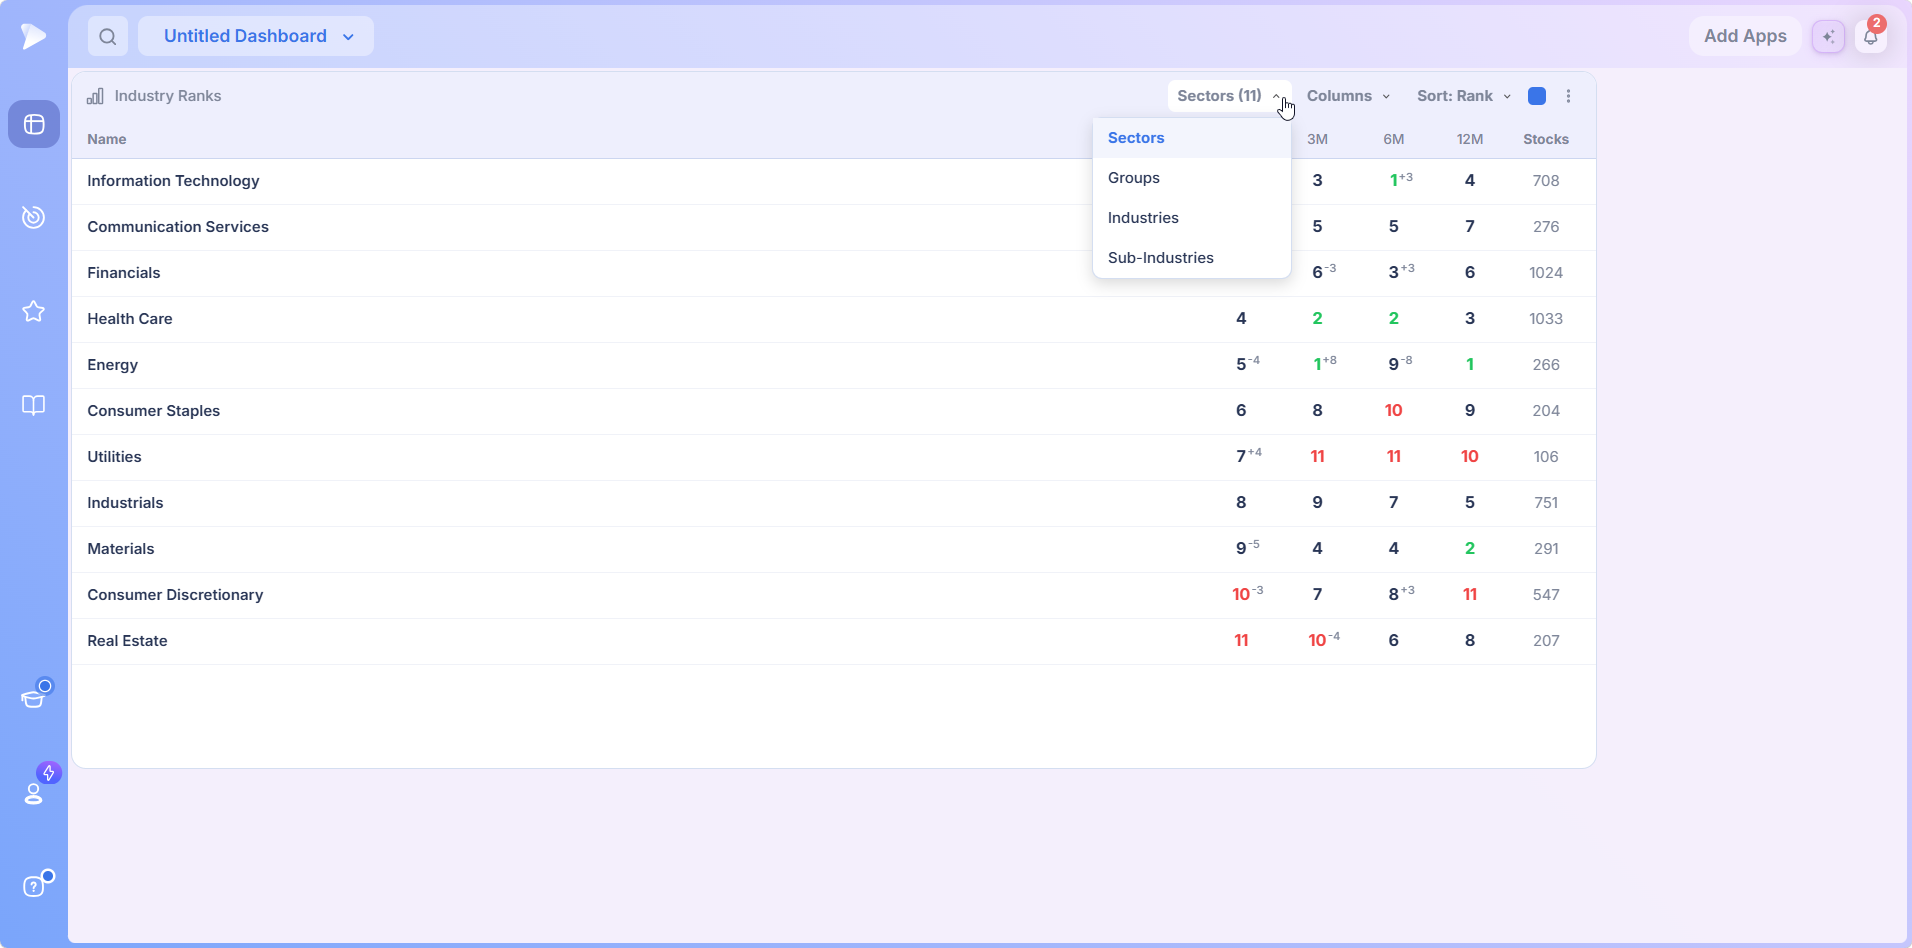
| Level | Count | Best for |
|---|---|---|
| Sectors | 11 | The broadest read. Is money in cyclicals, defensives or growth? |
| Groups | 25 | A middle view when sectors are too blunt but industries are too many |
| Industries | 73 | Deepvue’s own default. Granular enough to act on, short enough to scan |
| Sub Industries | 164 | Precision work. Isolates Gold from Silver from Copper rather than lumping them into Metals & Mining |
Sectors: the 30 Second Market Read
Eleven rows spanning the full GICS sector structure. Start here on a Monday morning or after a sharp move, because it answers the broadest question in one glance. It is also the level with the largest stock counts, so a leading sector represents money moving across hundreds of names rather than a handful.
Groups: the Middle Ground
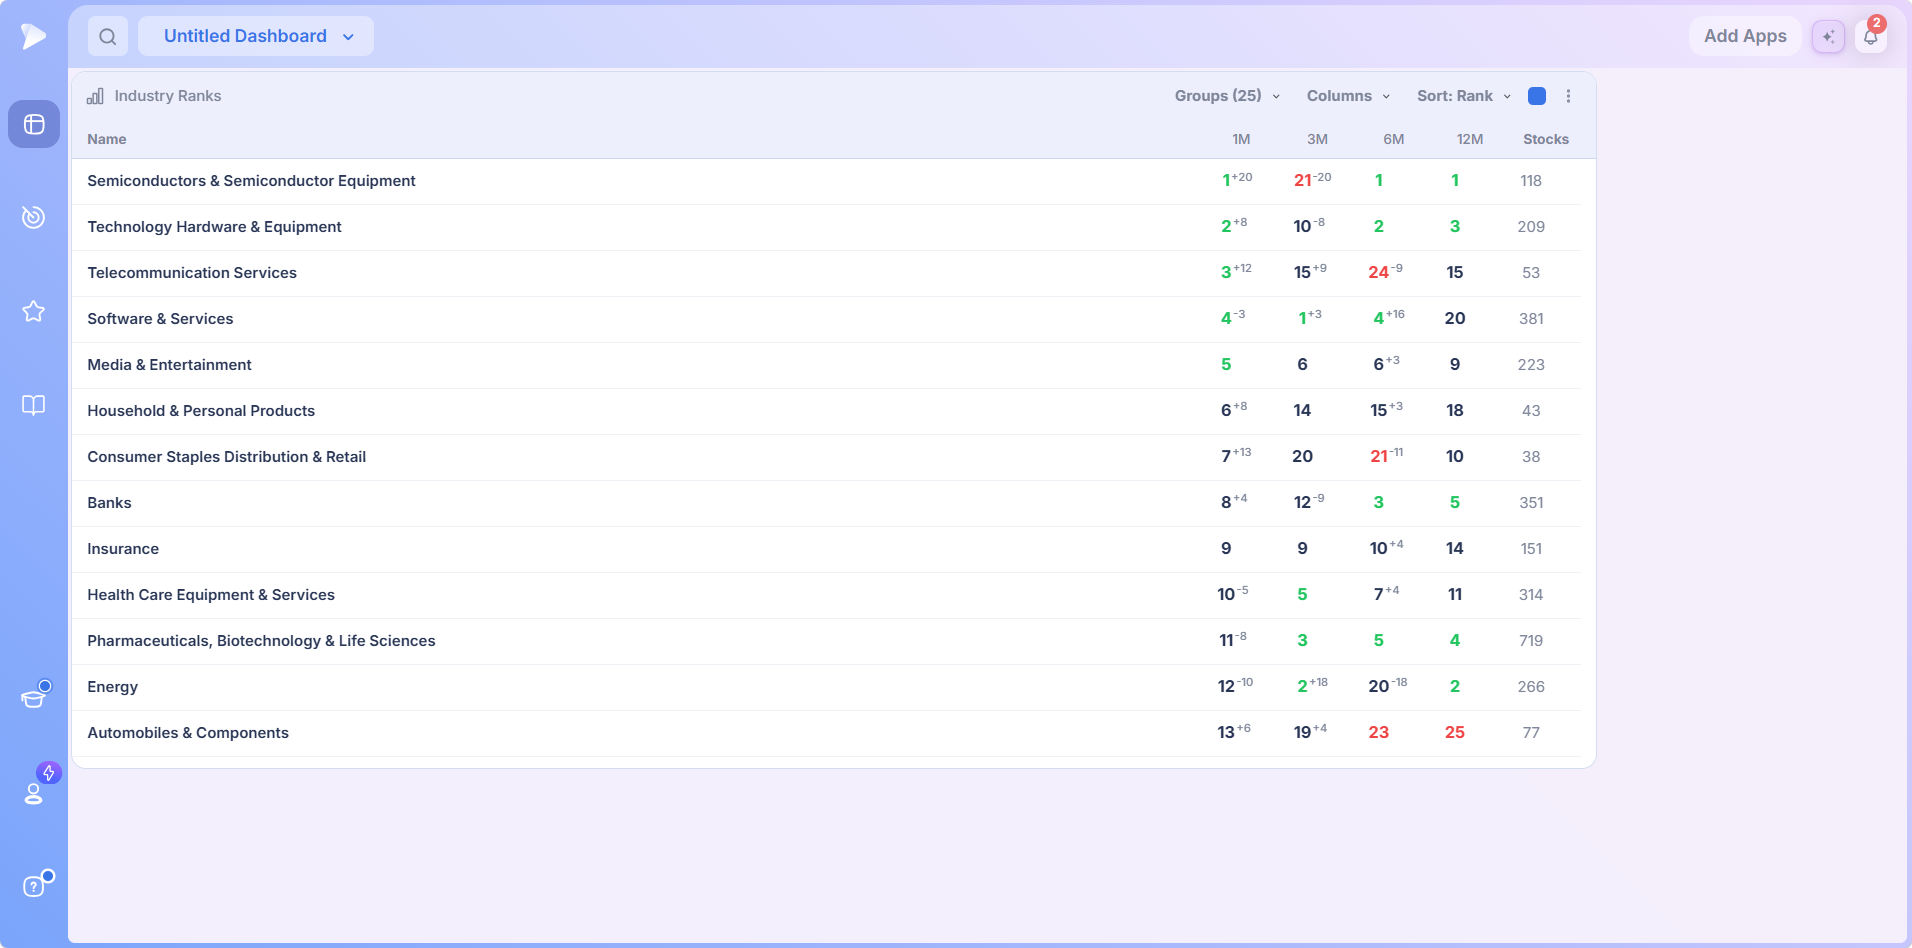
Twenty five rows between sectors and industries. Software & Services, Pharmaceuticals Biotechnology & Life Sciences, Health Care Equipment & Services, Automobiles & Components and Technology Hardware & Equipment are all group level classifications. Useful when sector level hides too much but you do not want to read 73 rows.
Industries: the Working Level
Seventy three rows, and the level Deepvue’s own team defaults to because it offers enough granularity without becoming a chore to read. A rank here tells you something specific, and the whole table scans in under a minute. Metals & Mining, Software, Health Care Technology, Life Sciences Tools & Services, Biotechnology, Capital Markets and Marine Transportation are all industries.
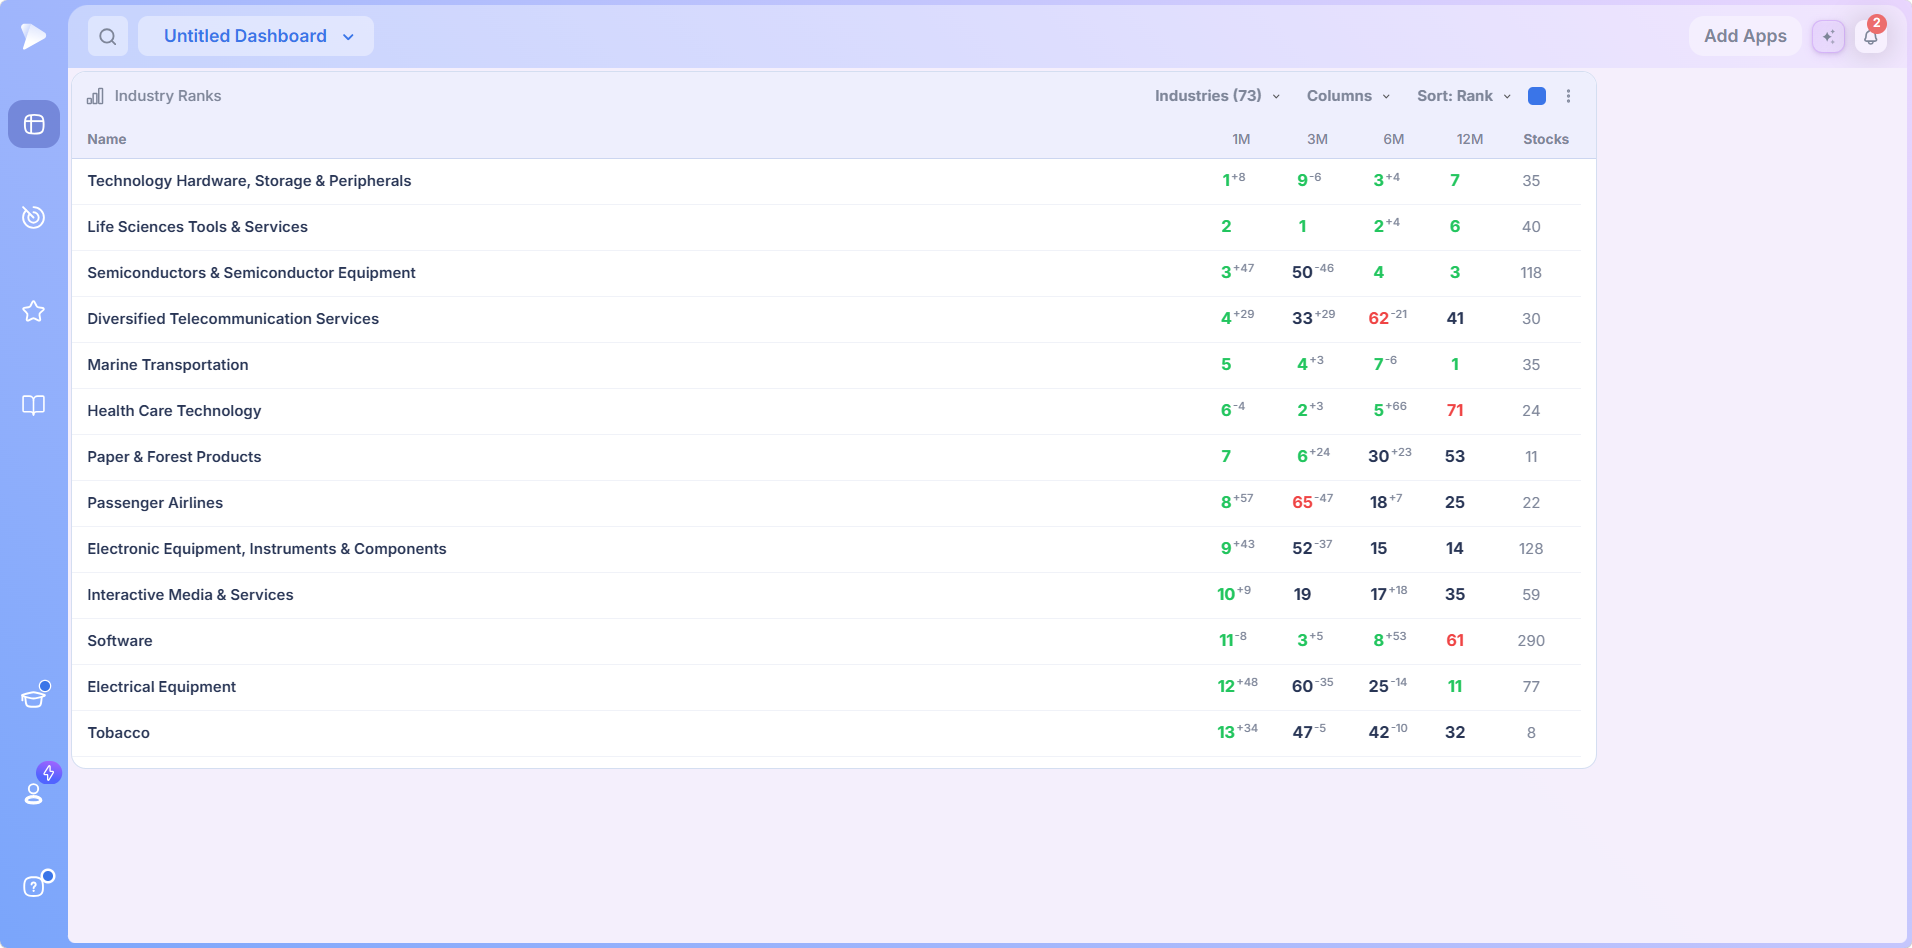
Look at the rank change figures and the value becomes obvious. Moves of dozens of places in a single update are common at this level, and none of it shows on a percentage table, because a percentage tells you what a group did while a rank change tells you what it did relative to everything else.
Sub Industries: Precision Work
A hundred and sixty four rows, and the level that separates what the broader classifications blur together. Gold, Silver, Copper, Precious Metals & Minerals and Diversified Metals & Mining are five distinct sub industries that all belong to Metals & Mining one level up. If gold miners are running and copper is not, only this level will show you.
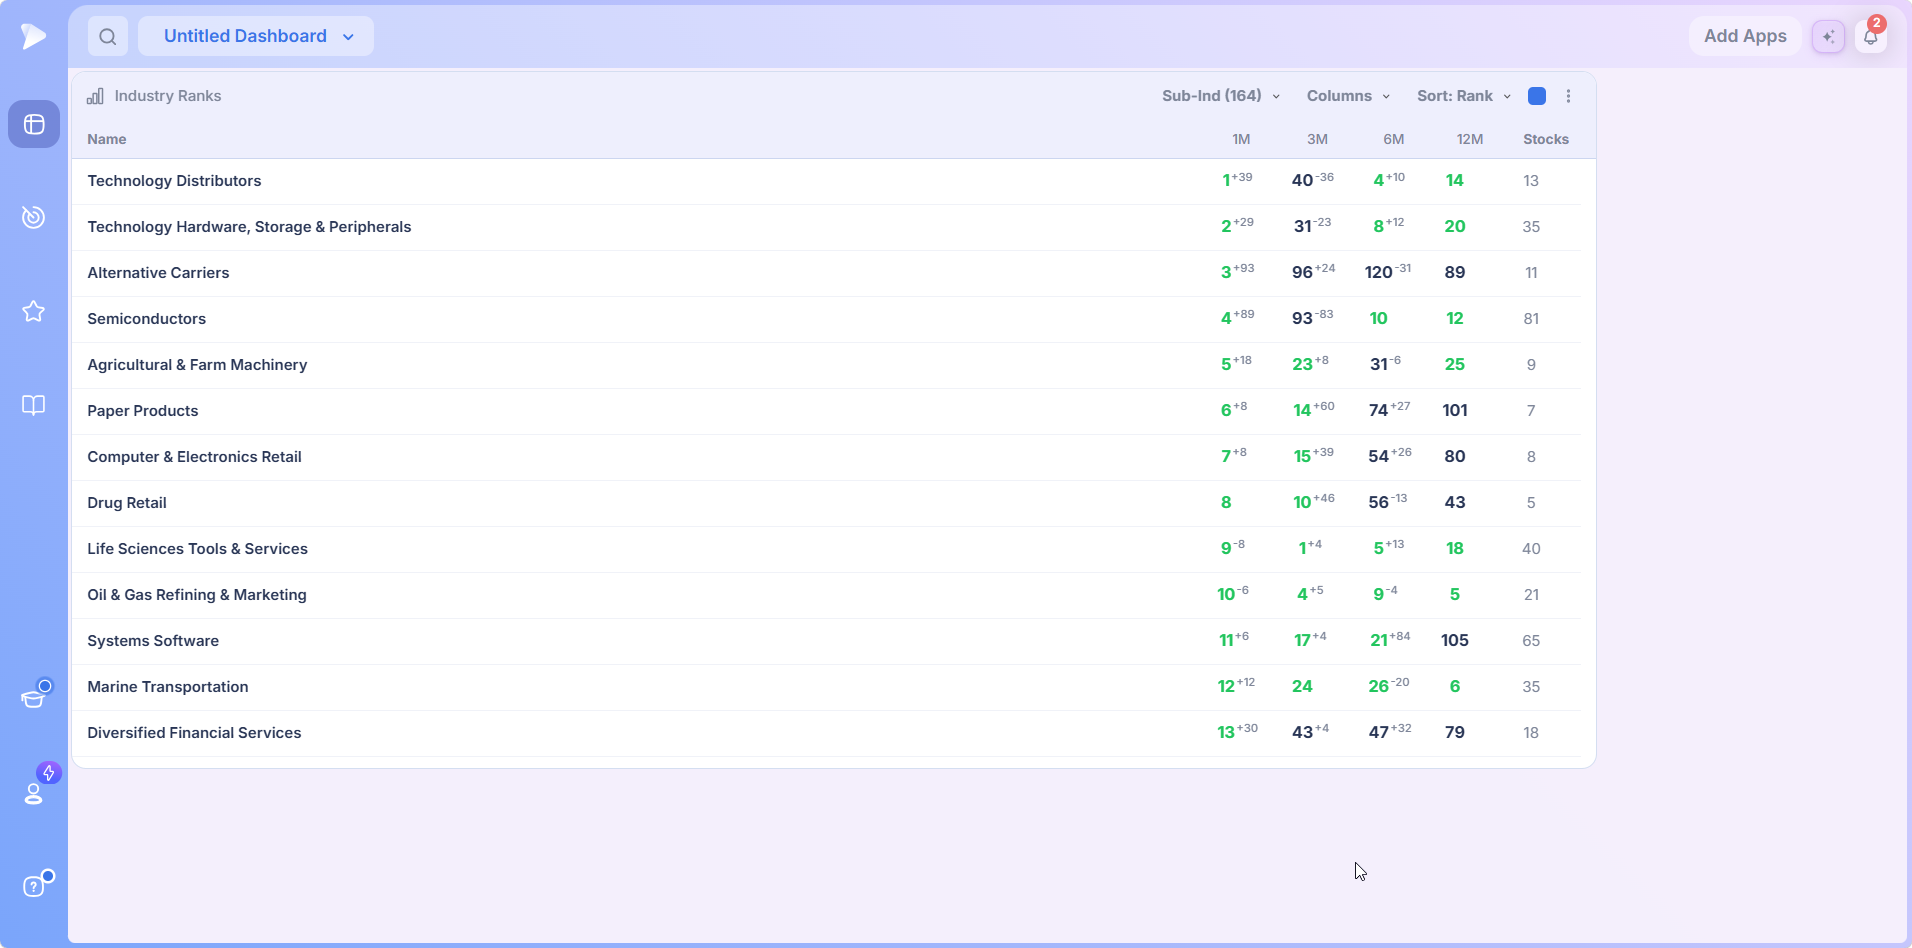
Two cautions come with this level:
- •The classifications get small. Some hold only a handful of companies, so a single stock can swing the ranking.
- •Rank changes get dramatic. Moving 20 places out of 164 is a much smaller real shift than moving 20 places out of 11. Read the count and the denominator together.
Try Deepvue and see which sub industries are climbing fastest right now.
Choosing Your Timeframe Columns
The Columns control holds six checkboxes, and you decide which appear in the table. By default the app shows 1 Month, 3 Month, 6 Month and 12 Month, with 1 Day and 1 Week available but switched off.
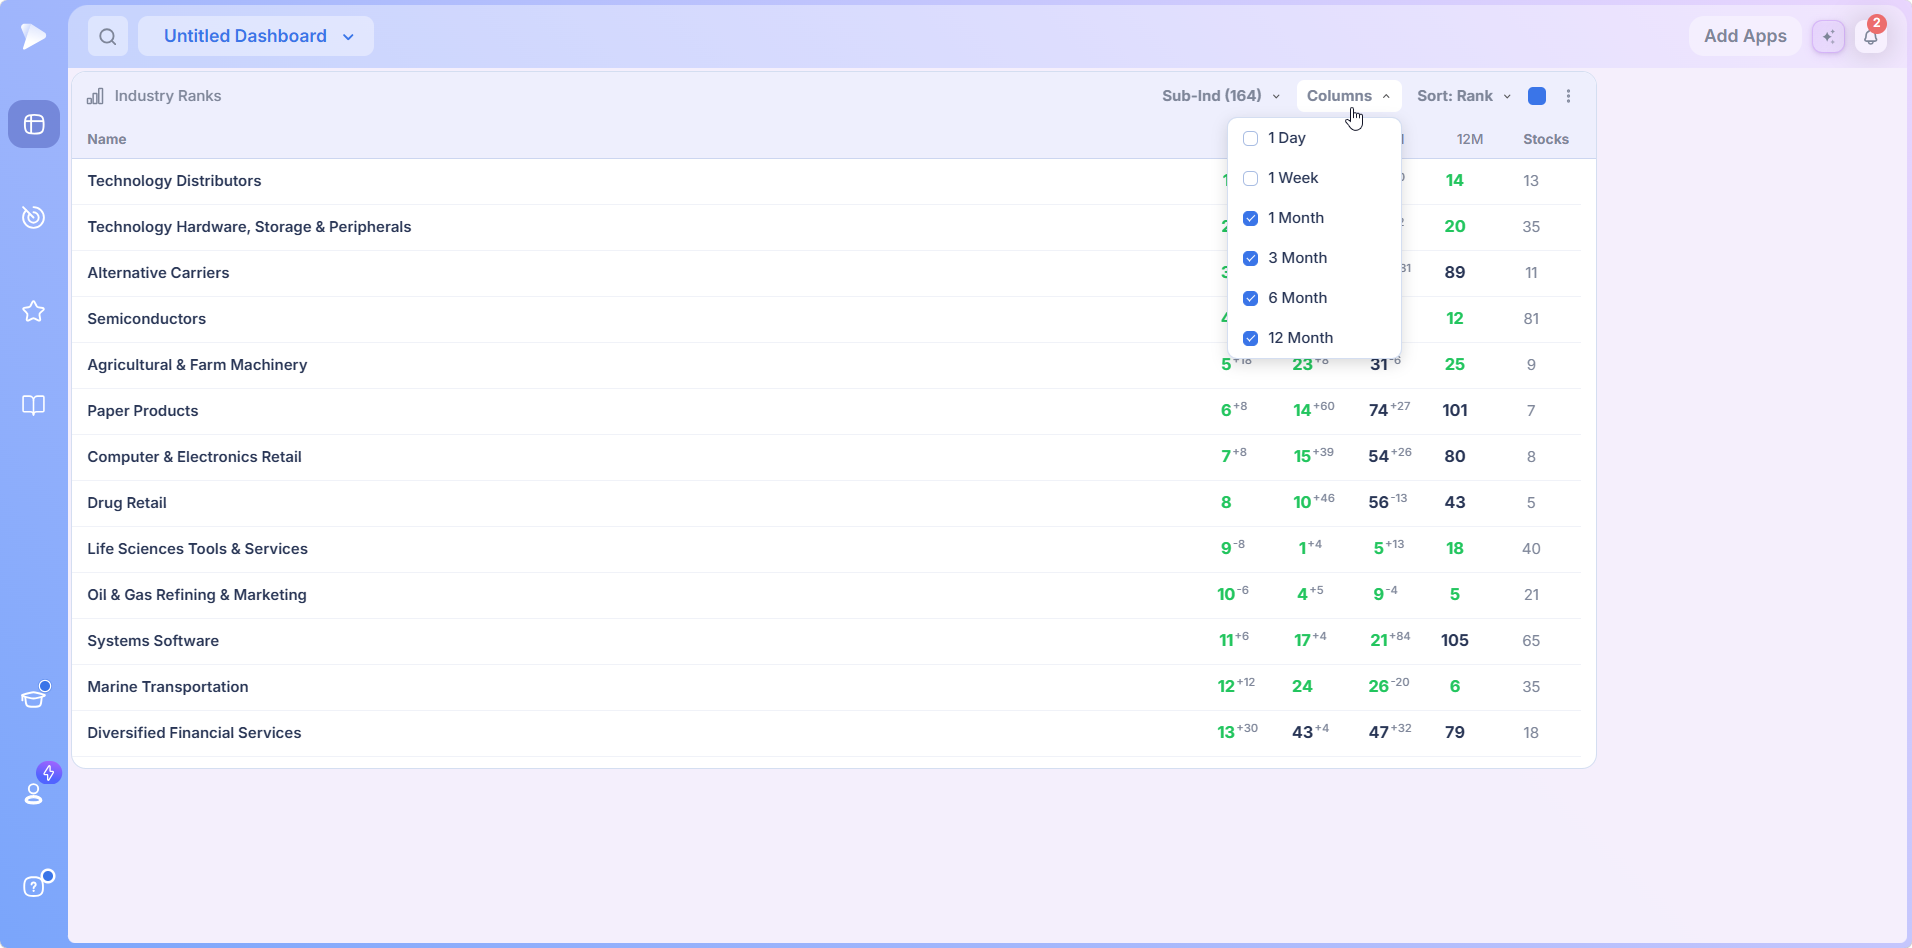
| Column | What it tells you | Who tends to use it |
|---|---|---|
| 1 Day | Where money went in the most recent session | Traders watching for the first sign of rotation |
| 1 Week | Whether a one day move followed through | Confirmation that a shift is real rather than noise |
| 1 Month | The current working leadership | The default reference point for most swing work |
| 3 Month | Whether leadership is established | Separating durable trends from recent pops |
| 6 Month | Medium term standing | Position traders assessing a longer hold |
| 12 Month | The full cycle picture | Longer horizon positioning and context |
Trimming the table is a real decision rather than a cosmetic one. Turning on 1 Day and 1 Week while turning off 6 Month and 12 Month produces a rotation focused view for shorter swing horizons; keeping the longer columns produces a positioning view. Four columns is a good balance; six starts to crowd the row.
The combination is where the insight comes from. A group ranked 2 on one day but 31 on three months is waking up. A group ranked 2 on three months but 11 on one day is established but resting. Neither reading is available from a single column.
Rank Versus Rank Change: the Two Ways to Sort
The Sort control offers two modes, and switching between them is the single most useful habit to build with this app.
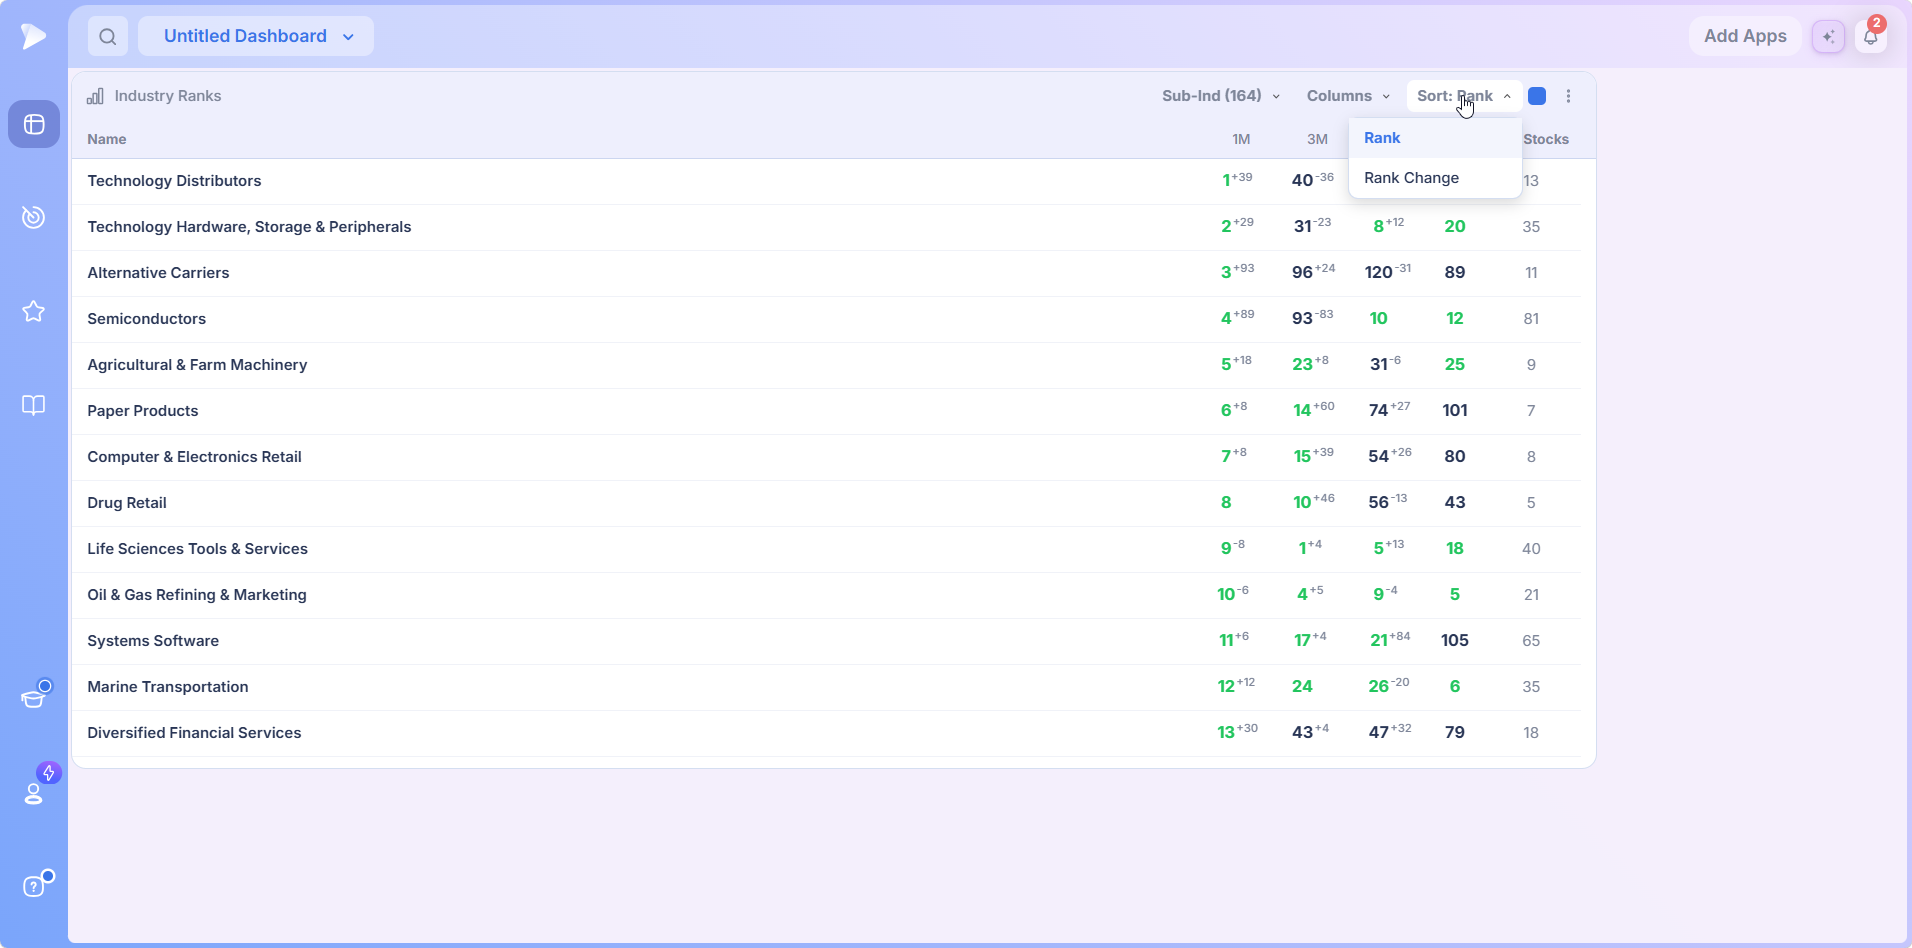
Sort by Rank: Who Is Leading
The default. The table orders itself by current standing on whichever column you click, so the top rows are the strongest classifications on that horizon. This is the view for answering where leadership stands and where you should be fishing. Clicking a column header switches which timeframe drives the ordering, so the same table reads on one month one moment and three months the next.
Sort by Rank Change: Who Is Climbing
The more actionable mode, and the one Deepvue’s team reaches for most. Instead of ordering by position, the table orders by movement, floating the classifications that have gained the most places to the top.
By the time a group reaches the top five of a one month ranking, a good part of the move has already happened. A group that has jumped sixteen places in a day, or seventeen over a month, is where the money is arriving right now. Deepvue’s tutorial describes exactly this, with an electrical equipment group moving from 23rd to first, and construction materials climbing 16 places to third.
The Filter That Combines Both
Ask two questions of every row:
Is this classification in the top third of the rankings?
Is it improving sharply?
A group that answers yes to both is worth opening up, because it has real standing and fresh money behind it. One without the other is either an established leader that has stopped attracting flows, or a fast climber that started from the bottom.
Drilling Into a Classification
Click any row and the app replaces the table with that classification’s members, drawn as a horizontal bar chart of change against yesterday’s close, ranked strongest to weakest. The classification name and its constituent count appear above the chart, a footer confirms how many stocks are shown, and a back arrow returns you to the table exactly as you left it.
This view answers the question the ranking creates. A leading industry group is interesting on its own; seeing strength run right down the list rather than resting on one or two names is what tells you it is genuinely being bought.
Reading a Lopsided or Split Group
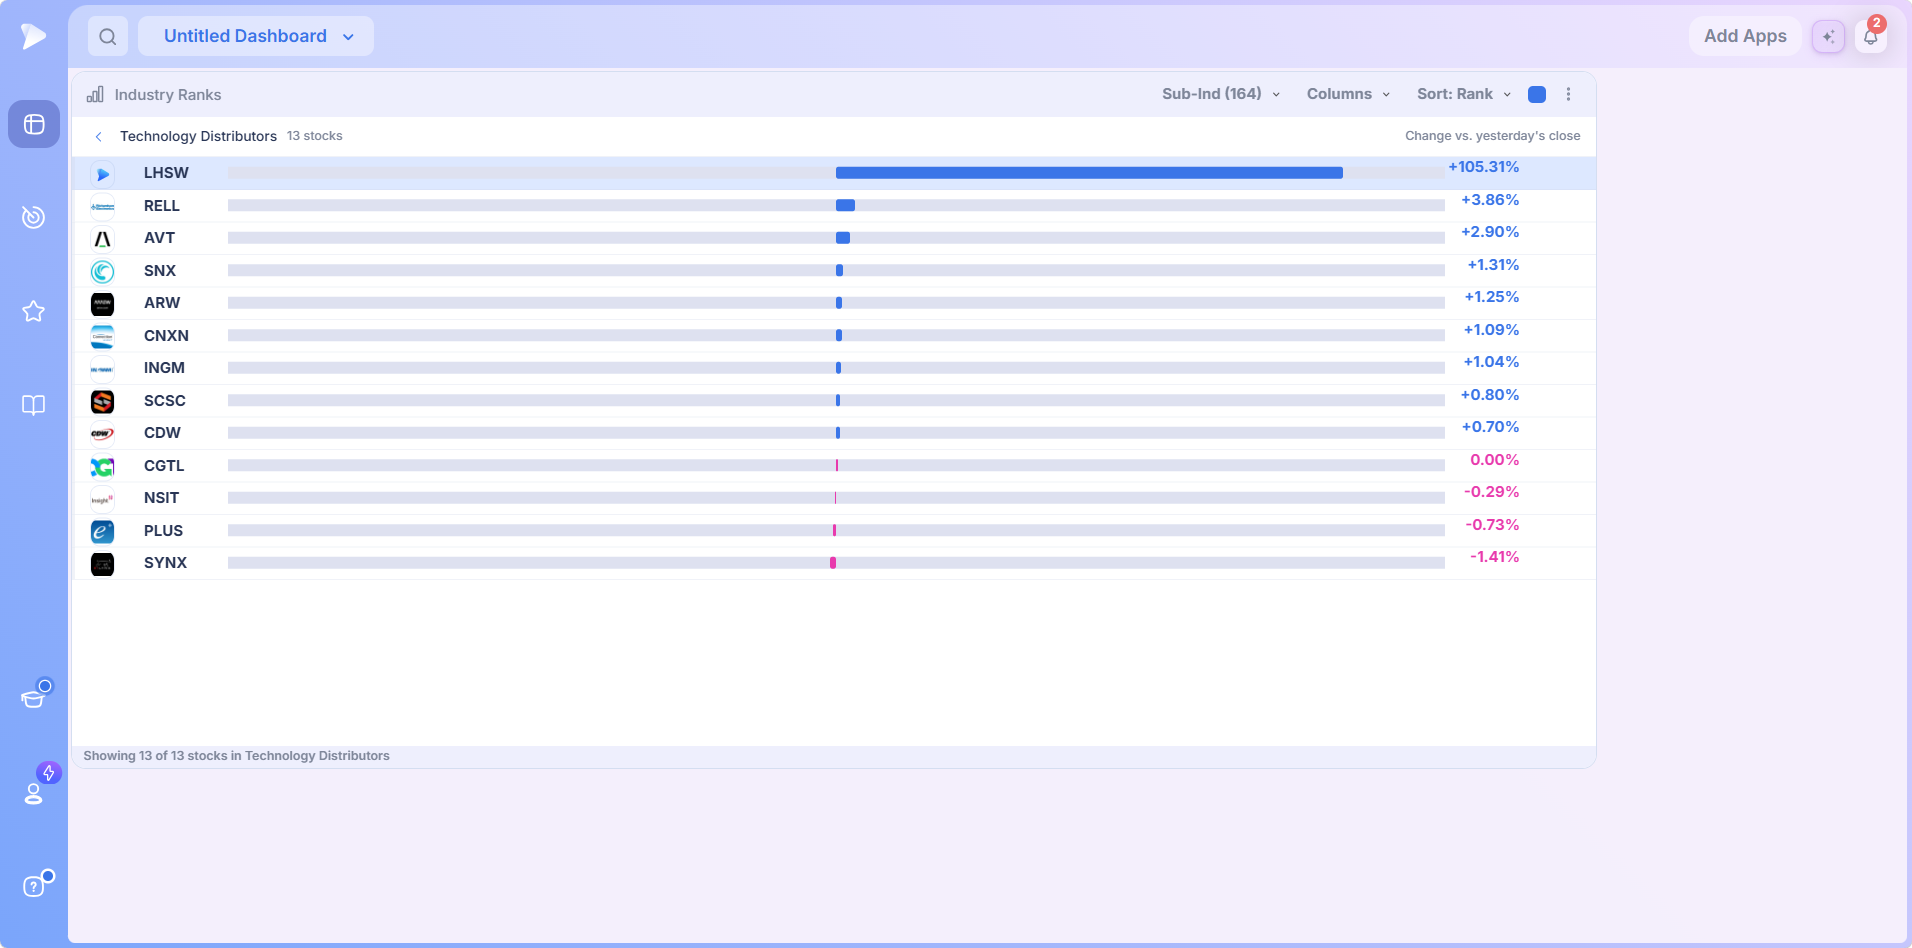
Two things to watch for whenever you open a classification:
- •A single dominant bar. A group can rank well on the strength of one outlier, and only the drill down reveals it. If the top name is up many times more than the second, the ranking is really describing one stock.
- •Decliners at the bottom. If a meaningful share of the group is negative on the day, plotted in pink, the ranking is carried by part of the membership rather than all of it.
From the Drill Down Straight to a Watchlist
Click the plus button that appears beside a symbol and a small menu opens, which turns a ranking into a shortlist without leaving the app.
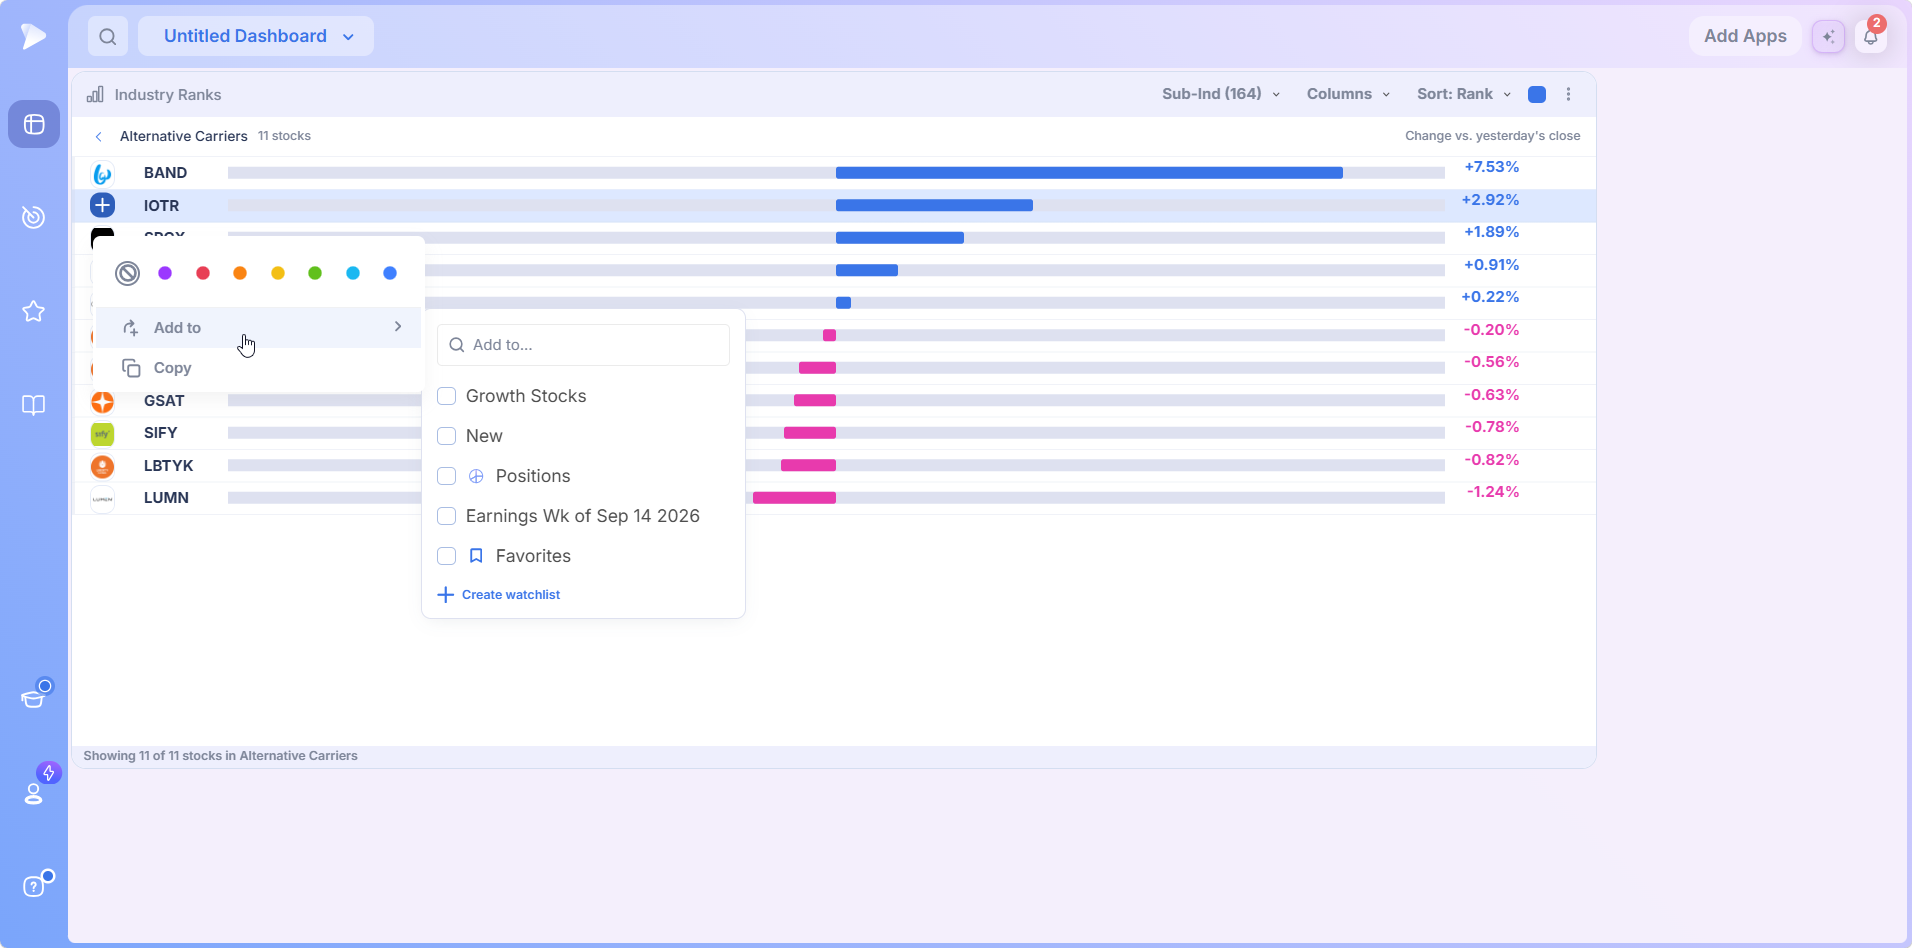
- •Color tags along the top to code a name at a glance, with a clear option to undo it.
- •Add to, for saving the name into any of your watchlists or a brand new one.
- •Copy, for pasting the symbol elsewhere.
So the path from a climbing group to a saved list of candidates is three clicks: open the classification, open a name’s menu, and add it to awatchlist.
Start a Deepvue subscription and turn tonight’s rank change scan into tomorrow’s watchlist.
Two Widgets Are Better Than One
Because you can add the same app twice, the setup Deepvue’s team recommends is a pair. Configure both to the same level and the same columns, then set one to sort by Rank and the other by Rank Change.
Side by side, those two tables answer the whole question at once: the left shows established leadership, the right shows where money is arriving. Groups high on both deserve the most attention, and that overlap is far easier to see across two tables than by toggling one back and forth.
Layouts Worth Building
- •Ranks plus chart. Both in one color group, so clicking a classification loads its constituents and the chart follows as you move through them.
- •The rotation pair. Two rank widgets, one by rank and one by rank change, as described above.
- •Ranks plus Theme Tracker. Formal GICS structure beside curated themes, a genuine cross check rather than the same information twice.
- •Ranks plus bubble chart. The same rotation read in table form and in visual form; Deepvue’s team describes the Bubble Chart as the visual counterpart to this table.
How to Use Industry Ranks: Core Workflows
The app is simple to read. Getting value from stock trading industry ranks is about the sequence you read them in.
The Top Down Sweep
Start at sectors. Eleven rows, sorted by rank on your primary column. Note which two or three are leading.
Drop to industries. Seventy three rows. Look for leaders inside the sectors you just flagged, which confirms the strength is broad rather than isolated.
Switch to rank change. Note anything climbing hard that was not already on your radar.
Go to sub industries for the finalists. Check whether the strength is concentrated in one narrow slice or spread across the wider group.
Open the winners. Drill into two or three classifications and read the constituent charts.
Five steps, a few minutes, and you finish with named stocks in named groups rather than a vague sense that healthcare looks strong.
The Improving Group Scan
The fastest daily routine in the app. Set the level to industries, sort by rank change, and read the top of the table on your preferred timeframe. Deepvue’s team watches one month for established themes and shorter columns for early movement.
Log what appears. A classification that shows up repeatedly across several days is seeing sustained industry rotation rather than a one session pop, and that repetition is what deserves action.
From a Ranking to a Trade Candidate
Once a group has your attention, the path to a trade candidate is short. Click into the classification, and if a chart app shares its color group you can move through the constituents with the spacebar exactly as you would through a watchlist. Deepvue’s charts carry Stage Analysis, the RS Line, Enhanced Volume and AVWAP for exactly that assessment. Judge each name on its setup rather than its percentage.
Industry Ranks Inside the Data Panel
The rankings are not confined to the dashboard. Industry rank and sub industry rank are available as data points in the Data Panel, so a stock’s group standing can appear beside any name you are looking at.
Open the Data Panel and click the gear icon.
Search for industry rank, or sub industry rank, and file it into whichever category group you prefer.
Close the settings. Each stock now displays its classification’s standing against the full field, on whichever timeframes you added.
Click the arrow beside the data point to expand the full ranking. It jumps straight to the stock’s own classification and highlights it.
This closes the loop from the other direction. Instead of starting with a group and finding stocks, you start with a stock and immediately know whether its group is helping or hurting. When a name looks good but its industry ranks near the bottom on every horizon, that is worth knowing before you commit.
Pairing With the Rest of the Rotation Toolkit
Three apps read industry rotation in three different registers, and agreement between them is stronger than any one alone.
- •Industry Ranks gives structure through formal classifications.
- •The Theme Tracker gives narrative through curated themes.
- •The Heat Map gives shape, showing the same market as a sector grouped treemap.
If an industry is climbing the ranks, its theme is leading the tracker, and its block is strong on the map, you are looking at rotation confirmed from three angles.
A Daily Routine Built on the Rankings
Six steps, run once the session has closed. Budget five minutes.
Sector check. Eleven rows on your main timeframe. Has anything changed at the top level?
Rank change scan at industry level. Note every classification that has climbed sharply.
Compare with yesterday’s notes. Repeat appearances are the signal; single day jumps usually are not.
Drill into two. Read the constituent charts and check whether the strength is broad or the work of one outlier.
Build the shortlist. Move constructive names into a watchlist for tomorrow.
Sanity check your holdings. Where do their industries rank now, and are those ranks improving or slipping?
That last step is the one people skip and the one that saves the most money. A position whose group has quietly slid 30 places over a month has lost the tailwind it was bought with.
What Sets the Deepvue Industry Ranks Apart
Industry rankings are common enough elsewhere. The details that make these stock market industry ranks genuinely useful inside a routine are narrower than that:
- ✓Rank change built into every cell, so direction of travel is visible without keeping your own records.
- ✓Four levels of the hierarchy in one control, from 11 sectors down to 164 sub industries.
- ✓Six timeframes you choose between, rather than a fixed period somebody else picked.
- ✓Sorting by movement, not just standing, which is what surfaces sector rotation early.
- ✓Constituent drill down with a ranked bar chart, so a classification opens into named stocks in one click.
- ✓Dashboard integration, so the table drives a chart and works beside the rest of your rotation tools.
No platform is right for everyone, and the honest way to decide is a proper comparison. Our Deepvue comparisons hub sets Deepvue against MarketSurge, TradingView, TC2000, TrendSpider, and Finviz feature by feature, and the compare category collects every comparison article in one place.
What Traders Say About Deepvue
Outside voices on the platform behind these rankings.
“It’s really the best screener I’ve ever used.”
u/Trading_Intern987, r/CANSLIM. Subscriber update thread
“Deepvue is the most economical and impressive trading platform I have used.”
An App Store review from November 2024. On the App Store
“Deepvue has way more options for screening.”
Posted by a MarketSmith subscriber comparing platforms. r/CANSLIM discussion
“It’s my favorite charting platform over everything else so far.”
u/lmaobihhhh, r/swingtrading. Open that thread
Deepvue’s reviews wall counts over 220 verified reviews at an average of 4.8, and 97 percent recommend the platform.
Where the Rankings Connect
Industry Ranks answers where to look. These are the tools that answer what to buy once you know.
- •The screener for narrowing a strong classification to the names that fit your rules, using its pattern and indicator screens.
- •Stage Analysis and Market Breadth for checking the condition of the market a ranking belongs to.
- •The AI Terminal for what is behind a sudden climb.
What Industry Ranks Costs
Industry Ranks is included in Deepvue’s single plan at $49 per month, with monthly and annual options. Dashboard apps are not sold separately and there is no premium tier.
That one plan covers:
- •The screener and its 1,152 data points.
- •Charts, watchlists, and alerts, all of them unrestricted.
- •Fully customizable dashboards, with every app in the catalog.
- •The Theme Tracker, Market Brief, and AI Terminal, the last with unbounded usage.
Deepvue has one plan, so there are no tiers to compare. For reference, MarketSurge, the legacy platform in this niche, runs $149 per month.
New subscribers also get a one on one onboarding session with a Deepvue team member, an onboarding email series covering platform features and use cases, and weekly live webinars that each go deep on one part of the platform.
Start Reading Rotation Instead of Guessing at It
Group strength is not a detail that improves a trade at the margin. It is a large part of why a trade works or does not.
Stock trading industry ranks hand you that information as a position and a direction rather than a percentage you are left to interpret, across four levels of the market and six timeframes.
Join Deepvue and make the rank change column the first thing you read after the close.
↑ Back to contentsFrequently Asked Questions
The questions worth settling before the rankings become a daily habit.
What are Deepvue Industry Ranks?
Deepvue Industry Ranks is a dashboard app that scores every GICS classification against every other one and displays the results as a sortable table. It covers 11 sectors, 25 groups, 73 industries and 164 sub industries, ranks each across up to six timeframes, and shows how many places each has moved since the previous daily update.
What is an industry group rank?
An industry group rank is a relative strength ranking that places an industry group against every other group by position rather than by percentage. A top ranked group is where the market’s leading stocks tend to cluster, which is why growth traders look there first. Deepvue ranks groups and industries this way and prints each one’s daily move.
What is sector rotation?
Sector rotation, or industry rotation at a finer level, is money moving from one part of the market to another as conditions, rates or risk appetite change. Leadership shifts rather than every group moving together, which is why some classifications outperform while an index looks flat. Deepvue Industry Ranks makes that shift visible as position and movement.
What are the 11 GICS sectors?
The 11 GICS sectors are Energy, Materials, Industrials, Consumer Discretionary, Consumer Staples, Health Care, Financials, Information Technology, Communication Services, Utilities and Real Estate. The Sectors level of Deepvue Industry Ranks scores all 11 against each other, and you can drop to groups, industries or sub industries for finer detail.
Which sectors are leading the market right now?
The sectors leading the market right now change constantly, which is the point of a live ranking. In Deepvue Industry Ranks, sort the sector view by Rank on your preferred timeframe and the leaders come first; sort by Rank Change instead to see which sectors are climbing fastest, which often matters more.
How do you identify sector rotation early?
You identify sector rotation early by watching movement rather than standing. By the time a group reaches the top five of a one month ranking, much of the move has happened. Sorting Deepvue Industry Ranks by Rank Change on shorter timeframes surfaces classifications gaining ground now, and repeat appearances over several days signal sustained rotation.
What does the small number beside a rank mean?
The small number beside a rank is the rank change: how many places that classification moved since the previous daily update. In Deepvue Industry Ranks a positive figure means it climbed, a negative one means it slipped, and no figure means the rank held, so you read direction without keeping records.
What is the difference between a sector, a group, an industry, and a sub industry?
The difference between a sector, a group, an industry and a sub industry is breadth: they are four levels of the GICS hierarchy, from broad to narrow. Deepvue covers 11 sectors, 25 groups, 73 industries and 164 sub industries. Sub industry separates Gold from Silver from Copper, which sector level folds into Materials.
Should I sort by Rank or Rank Change?
You should sort by Rank to see where leadership stands and by Rank Change to see where money is arriving, which is usually more actionable. The strongest filter in Deepvue Industry Ranks uses both: a classification in the top third that is also climbing sharply has standing and fresh flows behind it.
What is the best timeframe for reading industry rankings?
The best timeframe for reading industry rankings depends on your horizon, which is why Deepvue lets you choose the columns. 1 Month is the working reference for most swing trading, 1 Day and 1 Week catch rotation as it starts, and 3, 6 and 12 Month show whether leadership is established.
How often do the rankings update?
The rankings update once a day. That cadence makes Deepvue Industry Ranks a positioning tool measured in days and weeks rather than an intraday one, matching the multi week and multi month horizon the rest of the platform is built around.
Can I see the individual stocks in a group?
Yes, you can see the individual stocks in a group. Clicking any row in Deepvue Industry Ranks opens that classification’s members as a bar chart of change against yesterday’s close, strongest to weakest, and each member’s quick menu lets you color tag it, add it to a watchlist or copy the ticker.
How is this different from the Theme Tracker?
Industry Ranks differs from the Theme Tracker in its foundation. Industry Ranks follows the formal GICS hierarchy, so coverage is exhaustive and consistent for systematic top down work, while Deepvue’s Theme Tracker uses a curated list that catches groups cutting across formal classifications. Traders who run both read themes for narrative and ranks for structure.
Why does the stock count matter?
The stock count matters because a rank is relative. A top position in a classification holding a thousand companies describes strength across many names, while one holding five can be moved by a single stock. Deepvue Industry Ranks prints the count at the end of every row for exactly this reason.
Can I see industry rank on an individual stock?
Yes, you can see industry rank on an individual stock. Industry rank and sub industry rank are data points in Deepvue’s Data Panel, so they appear beside any stock you are viewing, and expanding the data point jumps to that stock’s own classification within the full ranking.
Is it useful for day trading?
No, Industry Ranks is not built for day trading. Rankings refresh daily and Deepvue is designed for positions held over weeks and months, so this is a positioning and context tool; the shorter columns exist to catch early rotation, not to trade the session.
Is Industry Ranks included in the standard Deepvue plan?
Yes, Industry Ranks is included in the standard Deepvue plan. Deepvue has a single plan at $49 per month that covers Industry Ranks along with the screener, charts, watchlists, alerts, dashboards, the Theme Tracker, the Market Brief, and the AI Terminal.