The Swing Trading Stock Screener Behind Mike Webster’s Daily List
Deepvue’s swing trading screener is Mike Webster’s Swing Trading List, a preset that returns liquid stocks showing positive relative strength across short, intermediate and long term timeframes. Six conditions do the work: price above $10, enough share and dollar volume to trade in size, and Deepvue’s own RS Rating above set floors over three, six and twelve months. Webster, who spent close to two decades at William O’Neil + Company, reviews that list for tight areas, clean breakouts and controlled pullbacks. $49 a month.
Key Takeaways
A swing trade has a short clock. You are holding for days or a few weeks, aiming for a move of perhaps 10% to 20%, and the stock has to start working soon after you buy it or the capital is better used elsewhere. That rules out most of the market before any chart is opened: stocks too thin to exit cleanly, stocks drifting sideways with nobody interested, and stocks whose long term trend is down no matter how good last week looked.
Mike Webster built his Swing Trading List to remove all three at once. It ships in Deepvue’s screener as one of his five Top Traders presets, and it hands you a universe of liquid stocks already outperforming the market on every timeframe that matters to a swing trader. What you do next is the part Webster has spent a career refining: reading that list for the handful of charts with a tradable setup today.
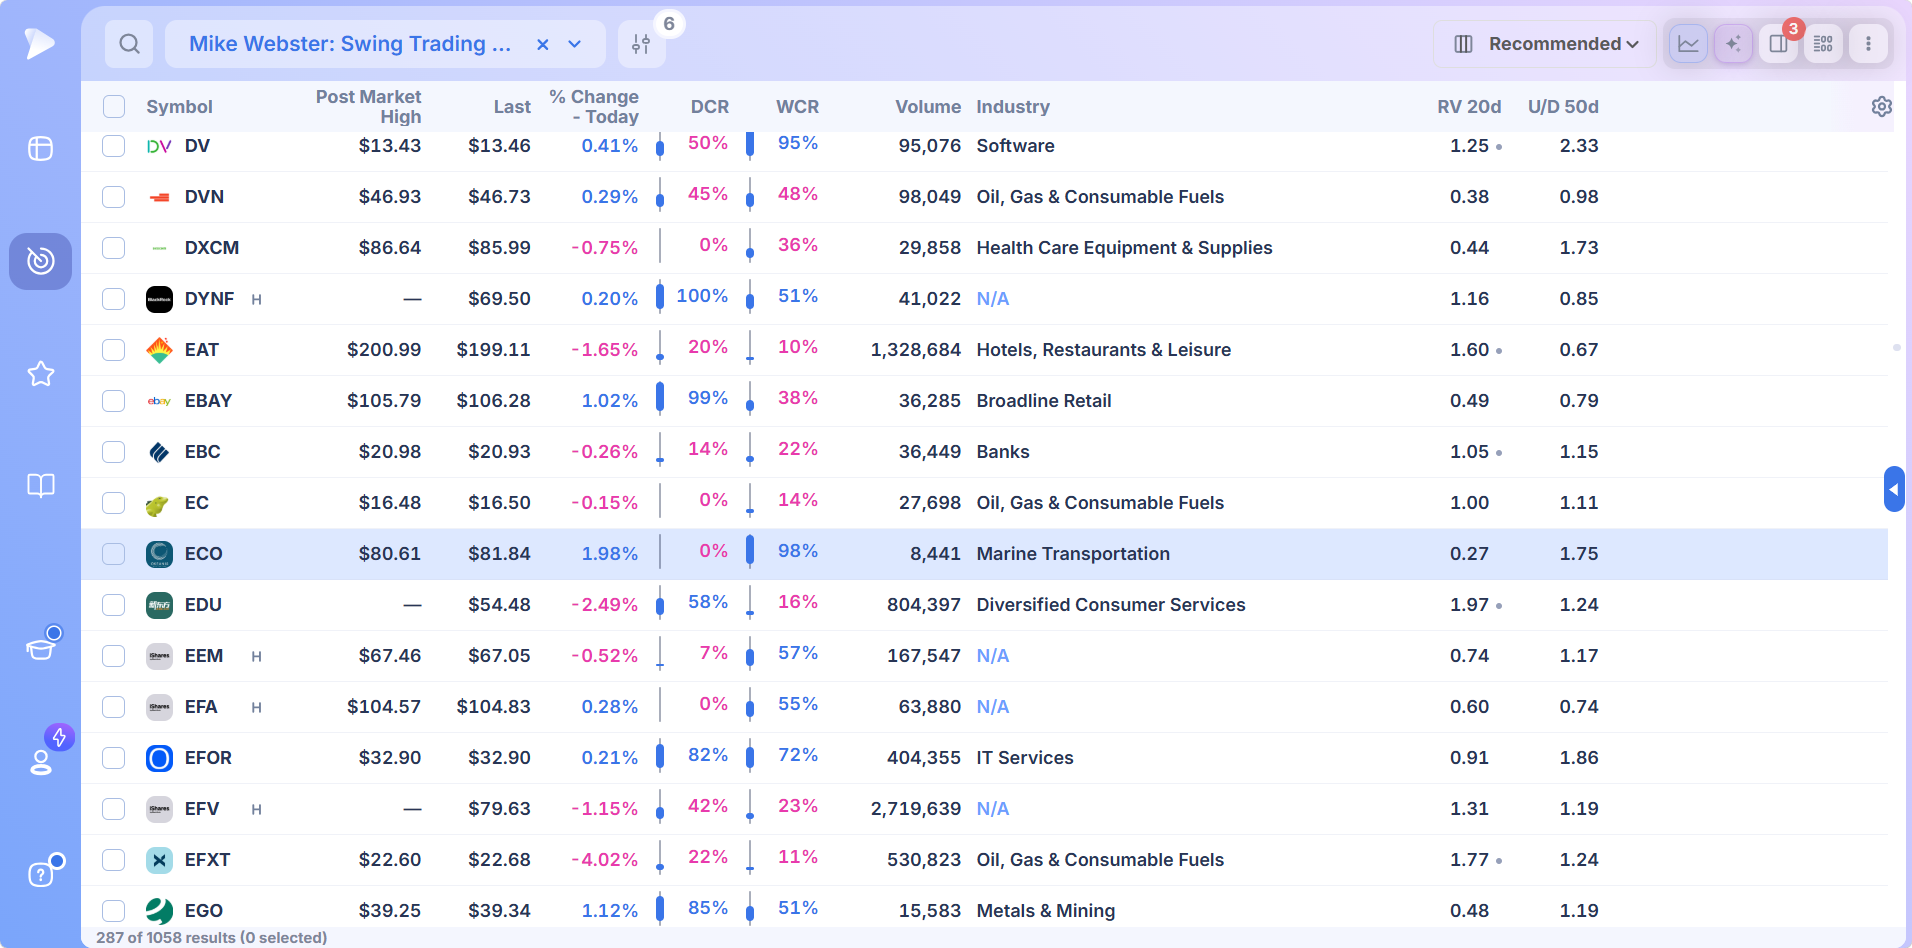
- ✓The preset keeps stocks above $10 with at least 600,000 shares and $6 million a day in average volume, so entries and exits stay clean
- ✓Relative strength has to be positive over three, six and twelve months at once, which filters out one week wonders and fading former leaders
- ✓The list is a universe, not a buy signal; Webster reviews it for tight areas, clean breakouts and controlled pullbacks with a defined stop
- ✓Daily and weekly closing range, the two columns Webster leans on, show which names buyers are holding into the close
- ✓Swing trades live or die on risk per trade, so every candidate goes from chart to position size before it goes to an order
- ✓One $49 a month plan covers Webster’s five screens, the chart pane, lists and alerts
What Is a Swing Trading Screener?
A swing trading screener narrows the whole market to stocks suited to trades lasting a few days to a few weeks. Those stocks need three things a long term investor can live without: enough liquidity to get in and out without moving the price, a trend already in motion so the trade has a tailwind, and the kind of daily range that makes a multiweek target realistic.
What Swing Trading Is, and How It Differs
Swing trading means capturing one leg of a larger move. A day trader closes everything by the bell and trades intraday noise. A position trader buys a leader and holds through corrections for months. The swing trader stands between them, entering on a setup, holding while the stock swings in the expected direction, and exiting when the leg matures or the setup fails.
| Day trading | Swing trading | Position trading | |
|---|---|---|---|
| Holding period | Minutes to hours | A few days to several weeks | Months |
| Chart used for entries | Intraday | Daily, with the weekly for context | Weekly, with the daily for timing |
| What the screen needs | Premarket movers and intraday volume | Liquid leaders with a setup forming | Leading businesses in long uptrends |
| Typical stop distance | Cents to a percent or two | Roughly 3% to 8% | Wider, often a key moving average |
The daily chart is where most swing decisions get made, which is why the best time frame for swing trading is usually the daily for entries and exits, checked against the weekly so you are not buying into a larger downtrend.
The Six Conditions in the Swing Trading List
Deepvue publishes the criteria alongside Webster’s other screens, and each one answers a specific swing trading problem.
| Condition | Threshold | The problem it solves |
|---|---|---|
| Price | Above $10 | Removes low priced stocks where spreads and erratic moves distort a tight stop |
| 50 day average volume | Above 600,000 shares | Enough daily turnover to exit a position on the day you decide to |
| 50 day average dollar volume | Above $6 million | Liquidity measured in money, so a cheap stock trading many shares cannot slip through |
| RS Rating, 3 months | Above 30 | The stock has not collapsed against the market over the last quarter |
| RS Rating, 6 months | Above 30 | The intermediate trend is intact, not rolling over |
| RS Rating, 12 months | Above 60 | Over a full year the stock has beaten most of the market |
Why Three Timeframes of Relative Strength
The combination is the clever part. The twelve month floor of 60 insists on a stock with a real record of outperformance, which rules out the one week wonder. The three and six month floors of 30 are deliberately loose: they tolerate a stock that has spent the last quarter consolidating, which is exactly what a stock building a swing setup often looks like, while still excluding names whose recent strength has fallen apart. The result keeps leaders that are resting and drops leaders that are breaking down.
Deepvue calculates its own RS Rating on each of those windows, which is why the preset can ask the question three ways instead of one.
What Webster Looks For on the List
The screen produces a long list on purpose, and Webster’s review narrows it. The patterns he looks for are consistent:
- •Tight areas. Several days of narrow ranges and closes near each other, where the next move tends to be decisive.
- •Clean breakouts. Price clearing a well defined high on volume above normal, with the day closing near its top.
- •Controlled pullbacks. An orderly dip on lighter volume toward support, rather than a sharp drop through it.
- •Constructive volume with strong relative strength. Accumulation on the way up, quiet trade on the way down, and the stock holding firm when the index slips.
- •A defined entry and stop. If there is no obvious level where the idea is proven wrong, there is no trade yet.
Who Is Mike Webster?
Mike Webster, known to most traders as Webby, joined William O’Neil + Company as a data research analyst in 1997 and became a portfolio manager in 2000, working alongside O’Neil for close to two decades.
His approach centers on how stocks behave under different market conditions, using closing ranges, relative strength and price to spot the names separating from the market, especially those holding firm while the indexes are under pressure. His work also shows up on Deepvue’s charts; the Mike Webster indicators guide covers the overlays built from it.
Why Good Swing Candidates Are Hard to Find
The difficulty is not a shortage of stocks that go up. It is the time budget. A swing trader reviewing charts after the close has perhaps an hour, and a raw market of several thousand names cannot be read in an hour.
Most of what fills that time is noise: thinly traded stocks where a single order moves price, long term laggards having a bounce that will fade, and quality names that simply are not doing anything this month.
A screen that removes those groups turns an impossible review into a manageable one. The Swing Trading List does it with conditions a swing trader already agrees with, so the hour goes on judging setups rather than discarding stocks that should never have been on screen.
Why Deepvue Is the Best Stock Screener for Swing Trading
Deepvue’s case is that Webster’s list, the columns he reads it with, the chart that confirms the setup and the tools that manage the trade all work inside one window, with the data streaming during the session.
Search the Presets by Name
The Screener Presets tab has a search box. Type swing and Webster’s list comes up with its path shown underneath, Top Traders then Mike Webster. The info icon beside it shows the description: liquid stocks showing positive relative strength across short, intermediate and long term timeframes, providing candidates for multiweek swing trades. One click loads it.
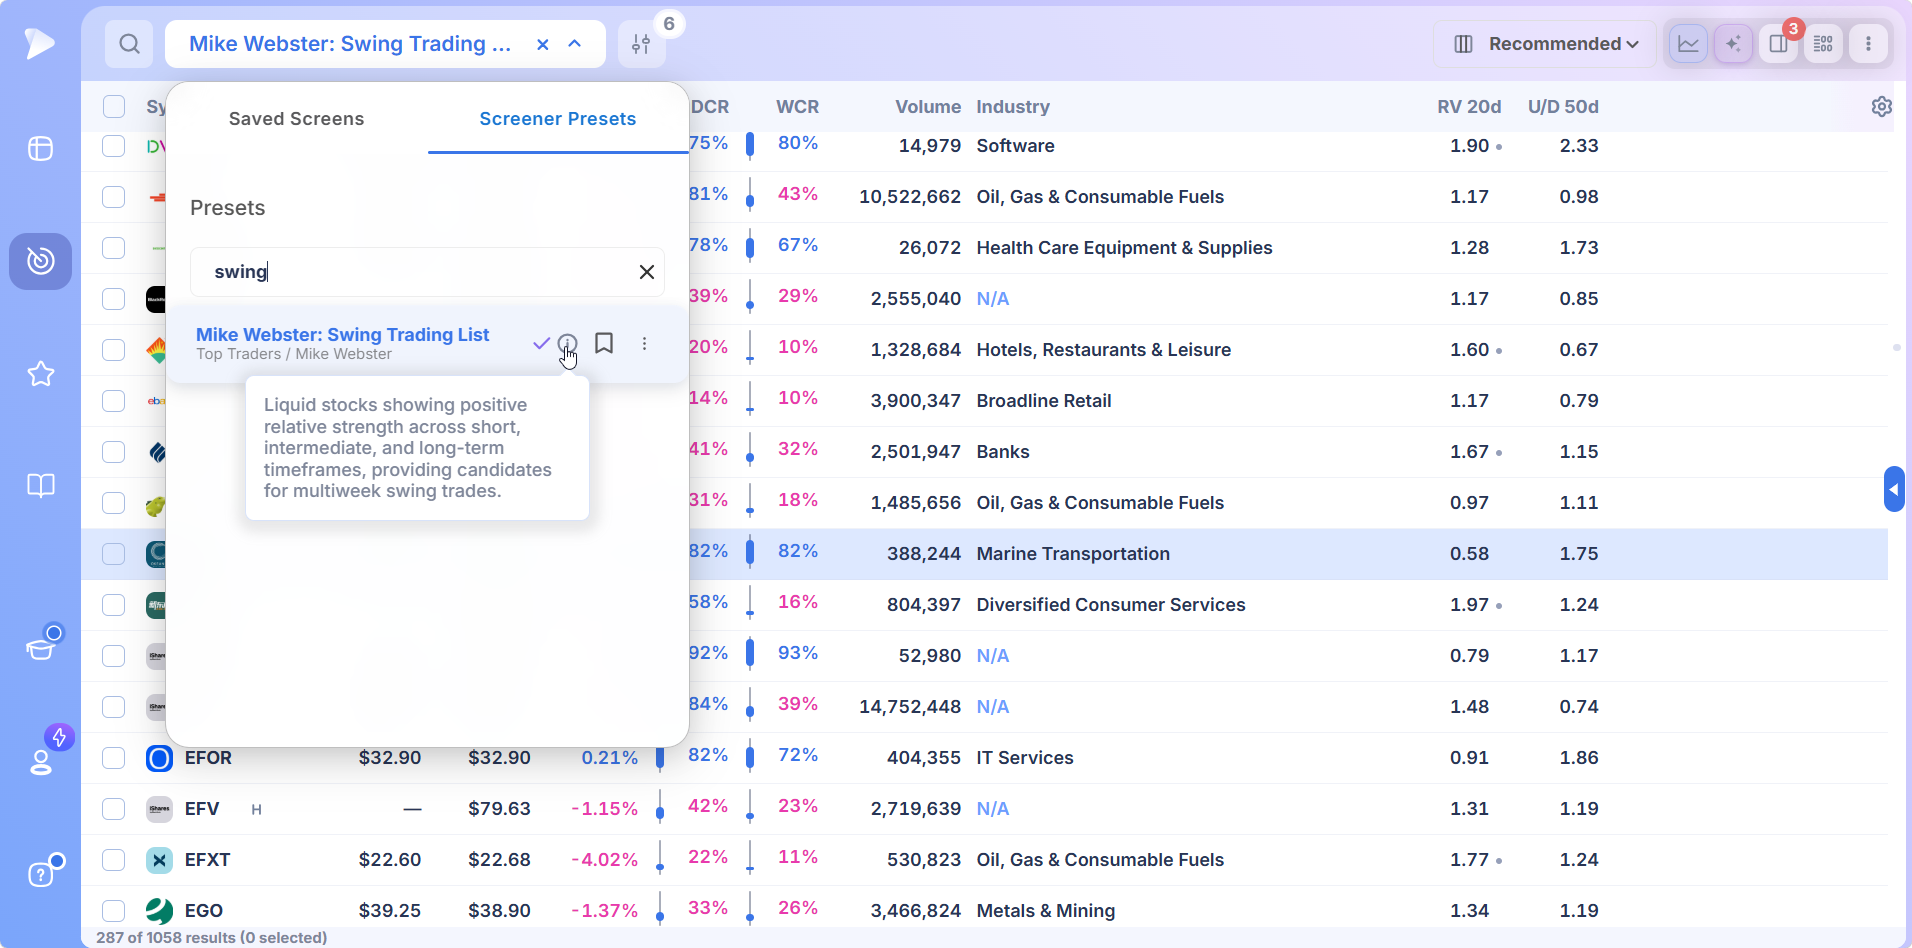
Like every shipped screen it is protected from edits, so the six conditions always mean what Webster intended. Save your own copy to change them.
Read the List the Way Webster Does
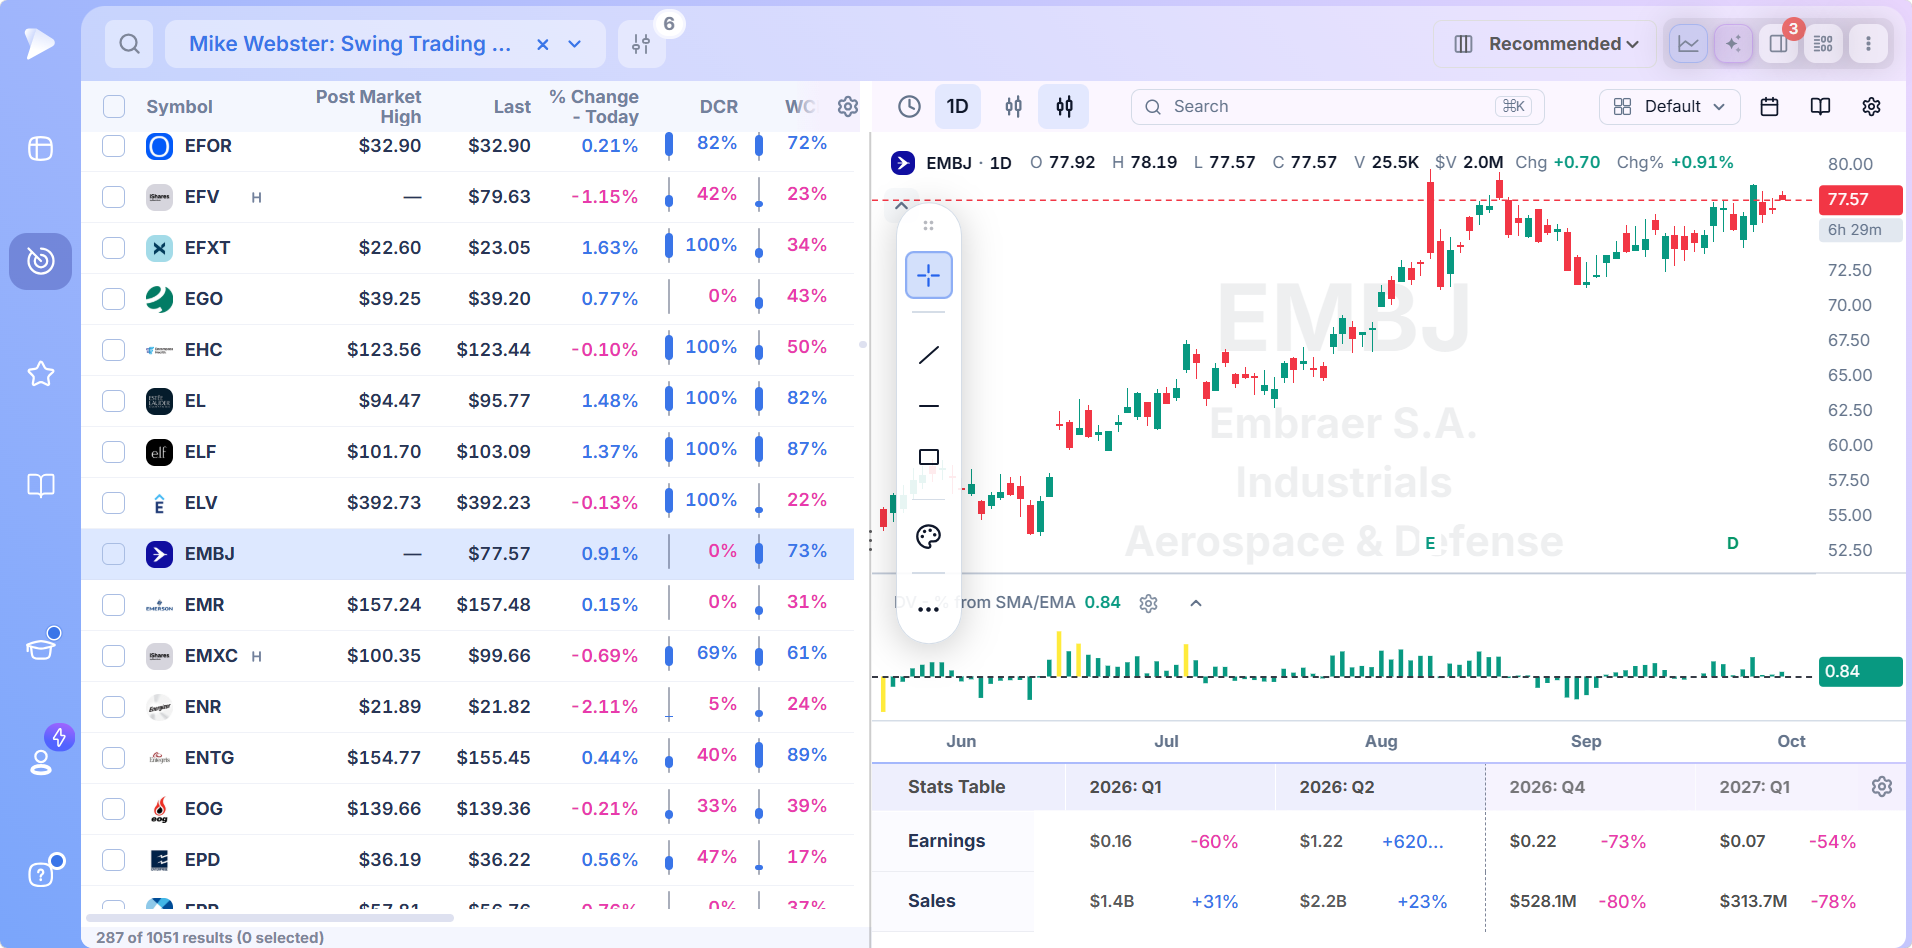
The recommended column set for the screen mirrors how Webster reads a stock. DCR and WCR, the daily and weekly closing range columns, report where each bar closed within its high to low span: a name finishing in the top quarter of its weekly range is being held by buyers, one finishing in the bottom quarter is being sold.
Twenty day relative volume flags names trading heavier than their own habit, and the up/down ratio over 50 days separates accumulation from distribution. Sort by weekly closing range first and the strongest finishers rise to the top.
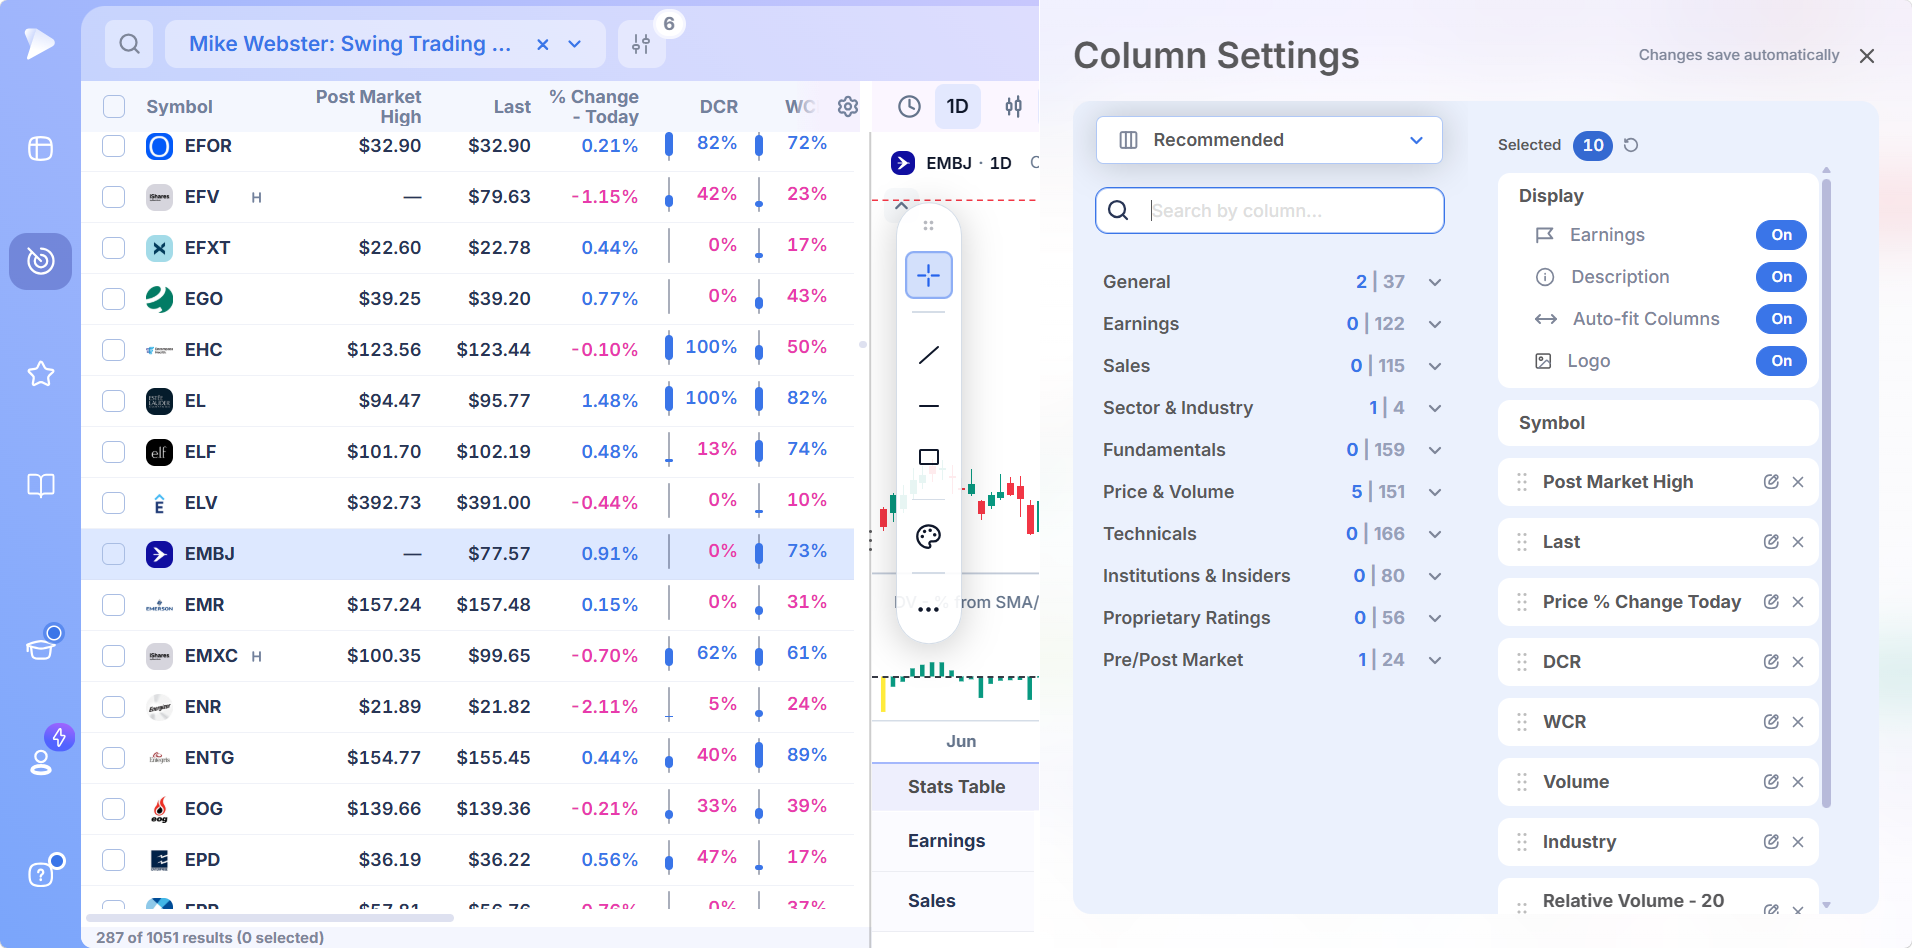
Any other field in the platform can be added the same way, from earnings and sales history to institutional ownership and Deepvue’s proprietary ratings, and each one works as a column and as a condition.
Confirm the Setup on the Chart
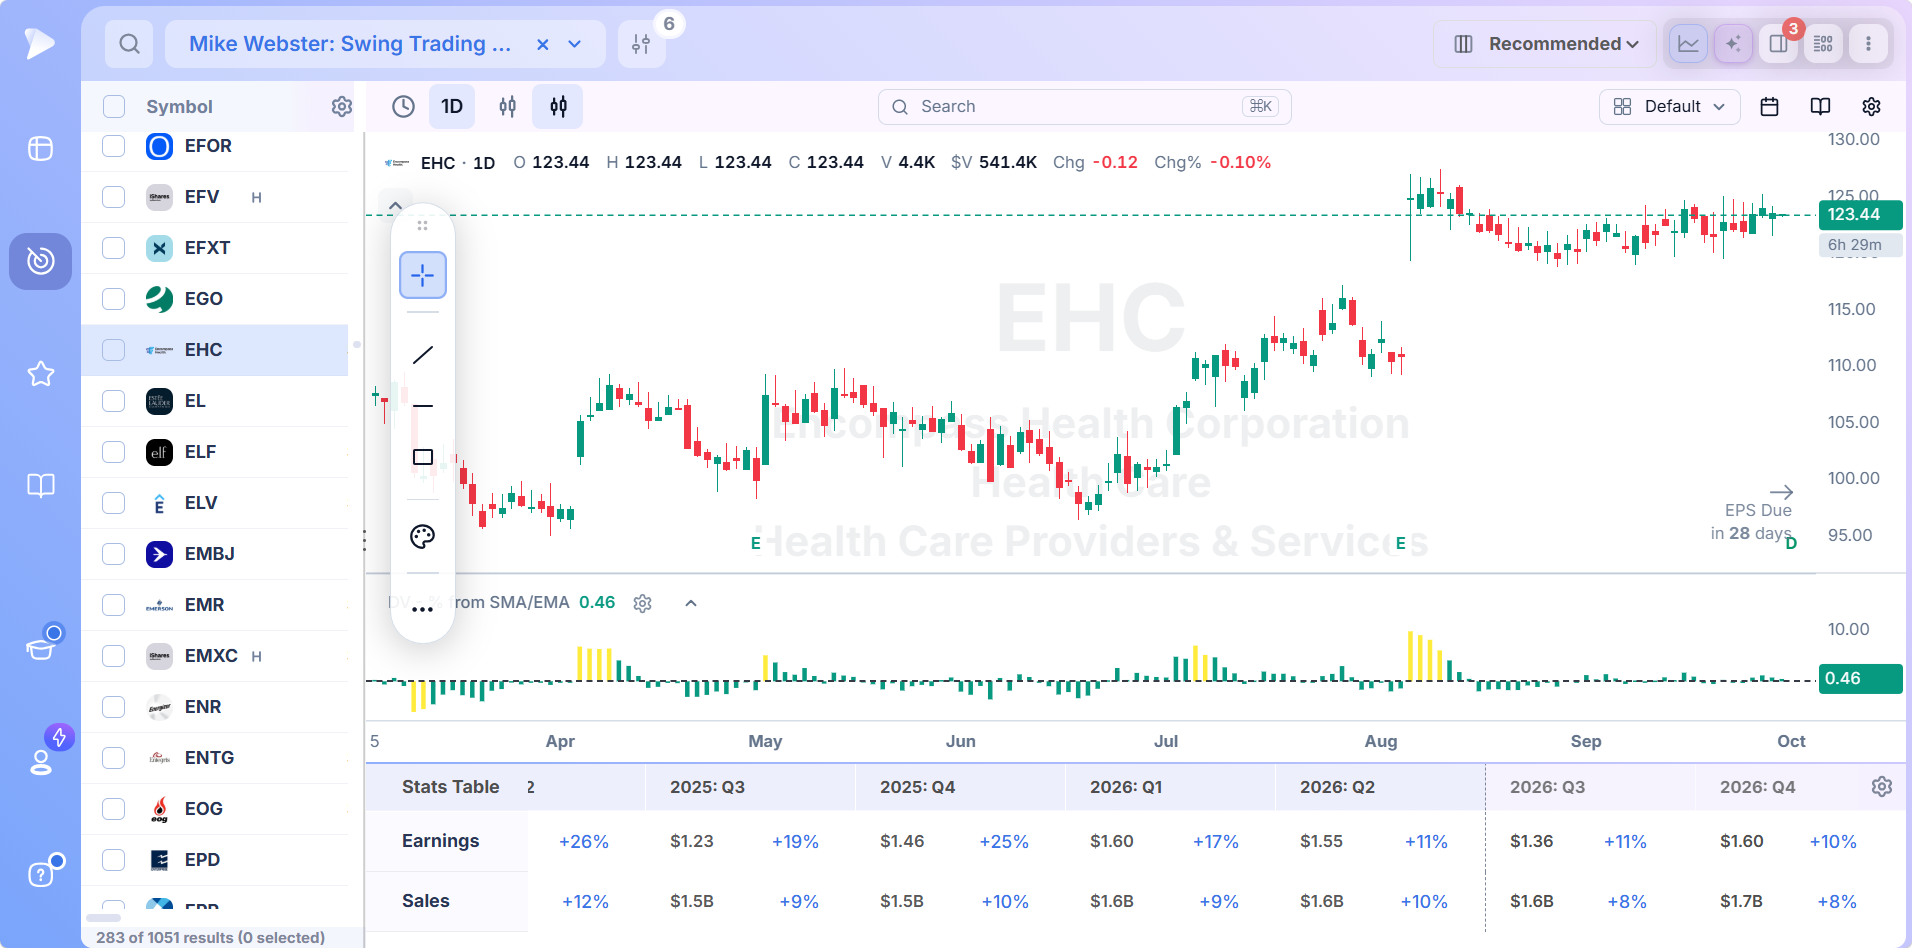
Selecting a row splits the screen, with the chart on the right and the list narrowed to its symbol column on the left, so you can move from one candidate to the next and judge each in a second or two.
A distance from moving average pane under the price shows whether a stock is resting near support or stretched, and the stats table below it holds quarterly earnings and sales, the check that separates a technical swing from one with a business behind it.
From Candidate to Managed Trade
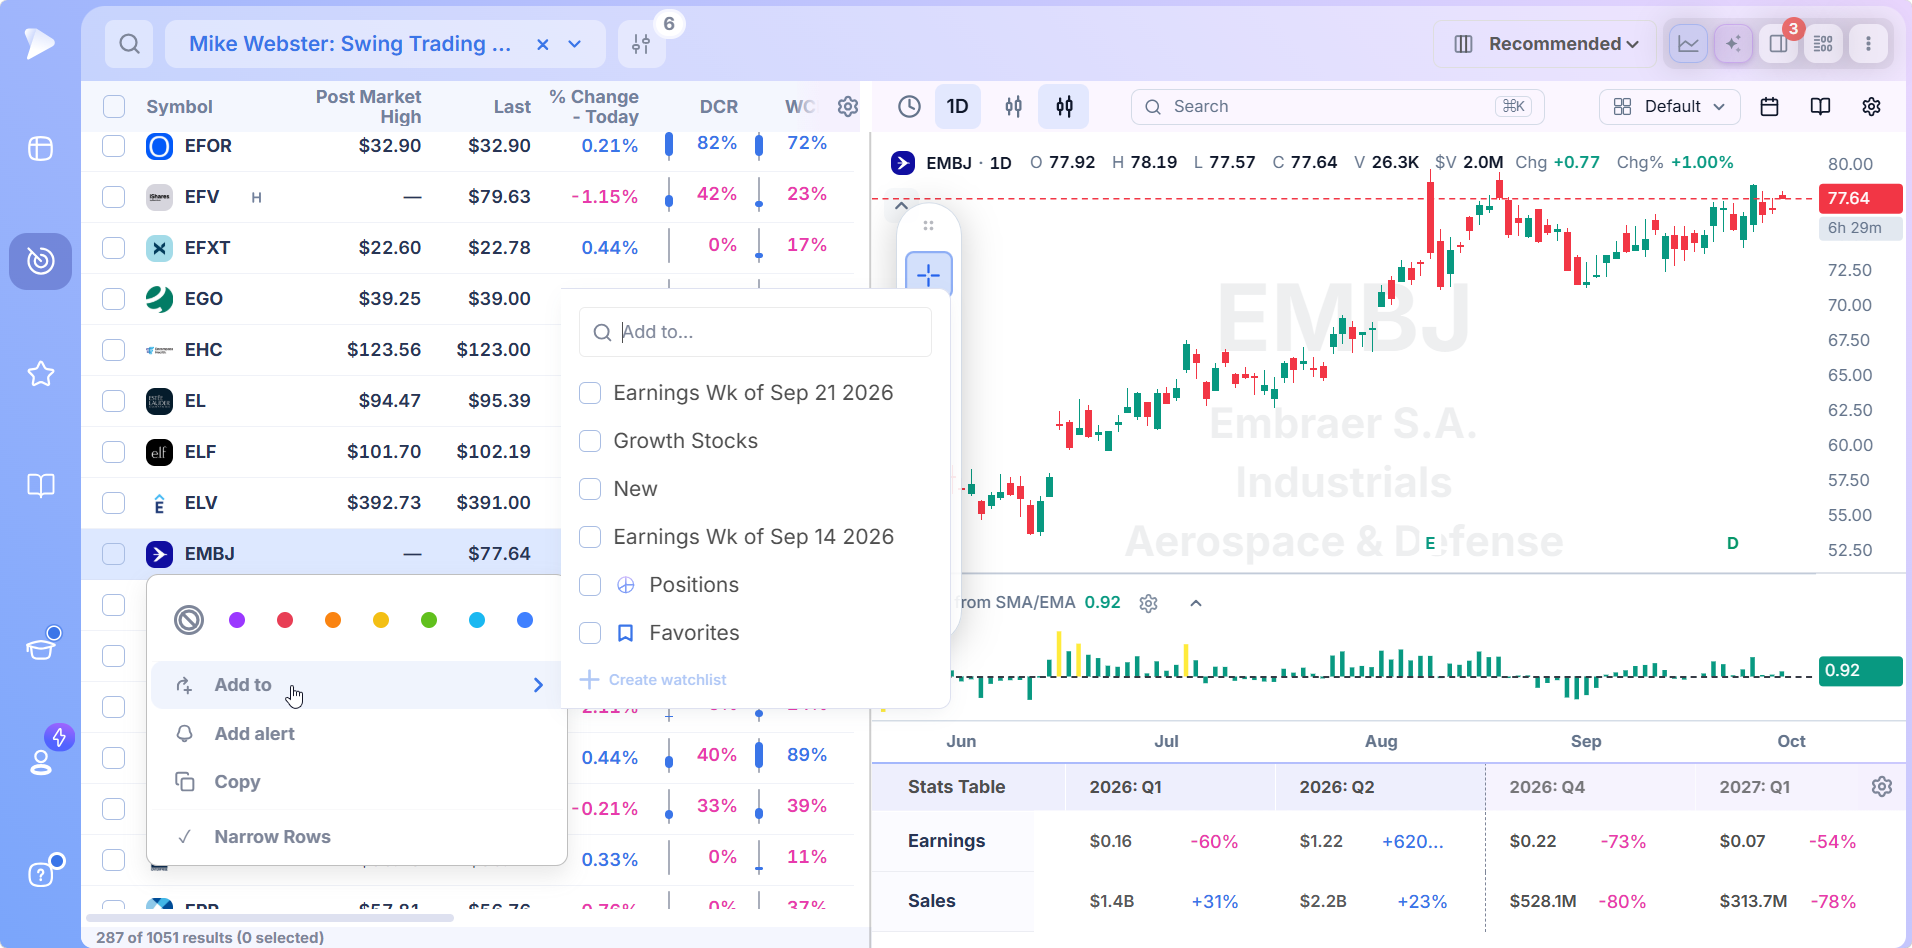
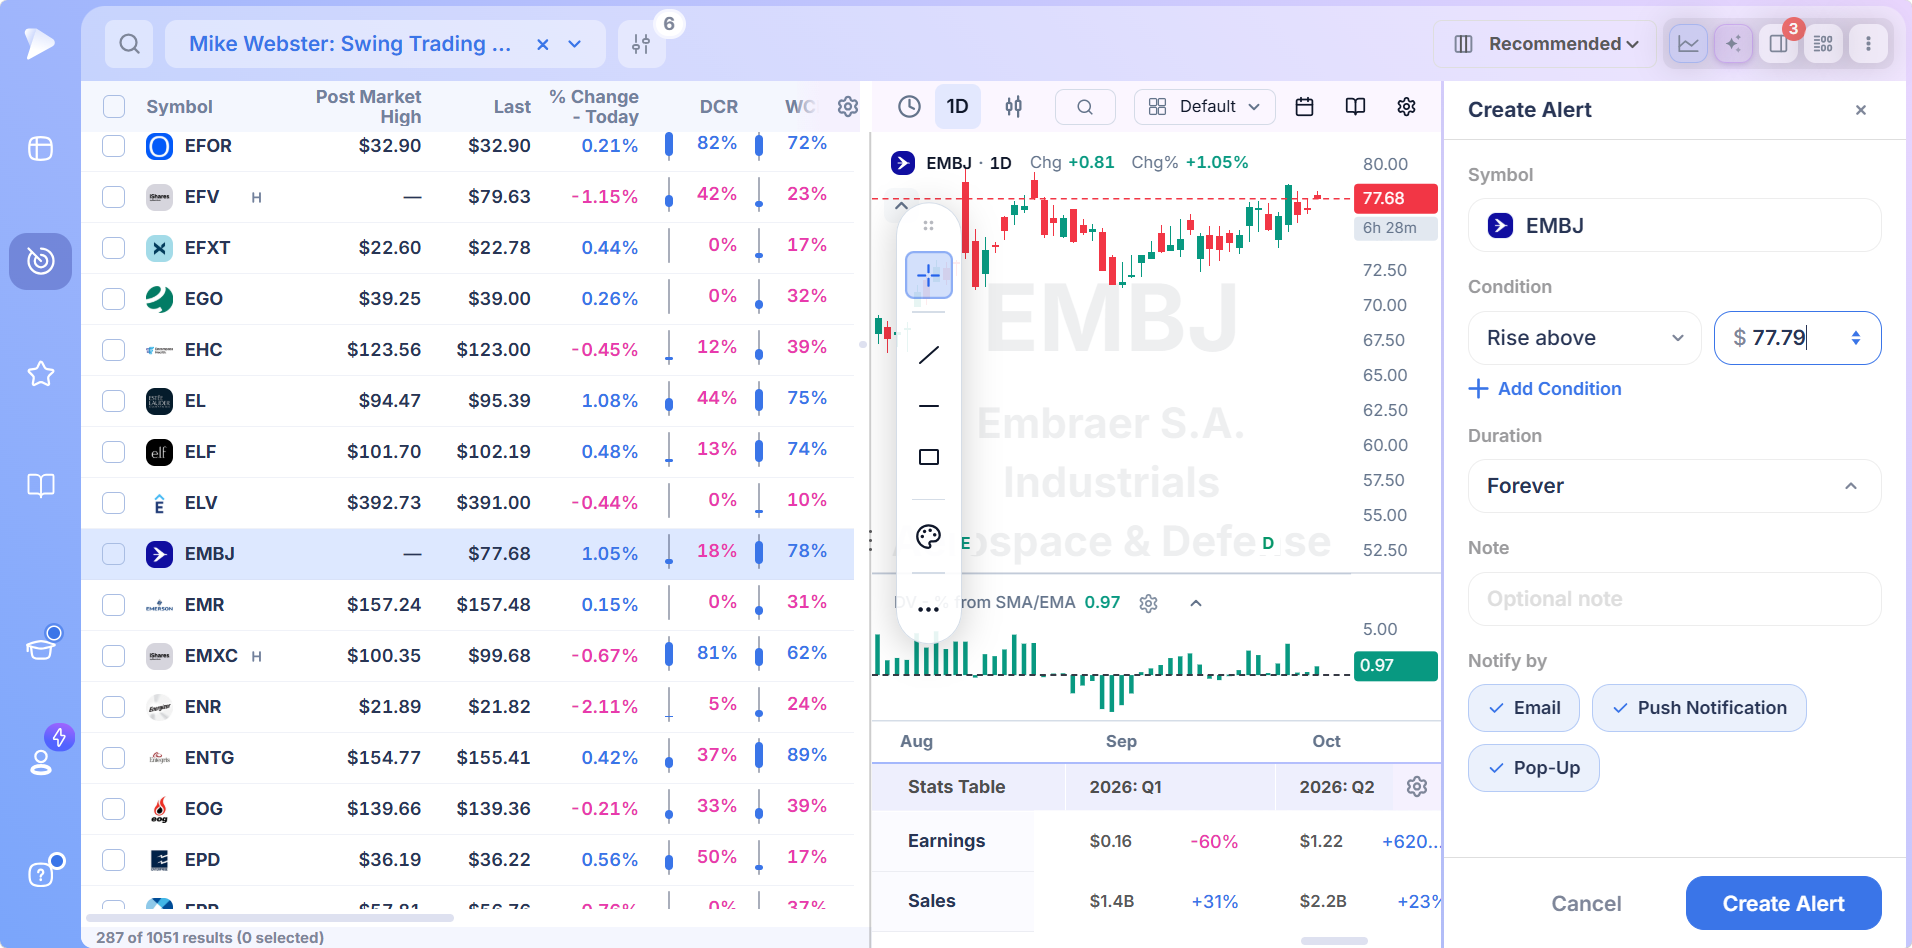
When a chart qualifies, right click the row. The menu adds the name to any of your watchlist folders, tags it with a color so it stands out on the next pass, or opens an alert directly. A rise above alert at the top of a tight area means you do not have to watch the stock all day; the notification arrives by email, push or pop up when the breakout happens. The position size calculator then converts the distance from entry to stop into a share count before the order goes in.
Webster’s Other Four Screens
The Swing Trading List shares a folder with Down Days Tell, Cross Fire, Hard Tape and Recession Proof. Down Days Tell is especially useful alongside it, since stocks that hold up when the index falls are often the first to break out when the index turns. The Mike Webster screens guide explains all five.
How to Build Your Own Swing Trading Screen
Webster’s list is intentionally broad. A saved copy lets you shape it around the setups you actually trade.
Duplicate the Swing Trading List so every threshold becomes editable.
Raise the twelve month RS floor to 80 if you only want the strongest leaders, or keep 60 for a wider net.
Lift the dollar volume minimum to match your position size, so a full position is a small fraction of a day’s trade.
Add a weekly closing range minimum, such as 60%, to keep only names finishing the week near their highs.
Limit how far price may trade above the 21 day average, which screens out stocks already too extended to buy.
Exclude companies scheduled to report within your intended holding period.
You can also describe the screen to the AI Terminal: “stocks above $10, $10 million average dollar volume, RS above 30 on three and six months and above 80 on twelve, weekly closing range above 60%, no earnings in the next three weeks” becomes a condition set you can refine.
How to Swing Trade the Names on the List
The screen supplies the universe. A swing trading strategy supplies the entry, the risk and the exit, and all three matter more than the stock you pick.
Entry: the Break From a Tight Area or the End of a Pullback
Two entries cover most of Webster’s review list. The first is a break above a tight area on expanding volume, ideally with the day closing in the top part of its range. The second is the end of a controlled pullback, bought when the stock stops falling at support and turns up. In both cases the entry comes with an obvious level below it where the setup would be broken.
Risk: Size From the Stop, Not the Conviction
Many swing traders follow the 2% rule: never lose more than 2% of the account on one trade, and often much less. That limit, divided by the distance from entry to stop, sets the share count. A stock with a 4% stop can take a larger position than one with an 8% stop for the same account risk, which is one more reason tight setups are preferred.
Exit: Take the Leg, Protect the Rest
Swing trades are about the leg, not the whole trend. A common approach is to sell part of the position into strength after a gain two or three times the initial risk, then trail the rest under the 10 or 21 day line. How long to hold a swing trade depends on the stock, but a position that has gone nowhere in a week or two is tying up capital another name on the list could use.
Where the Swing List Fits With Other Screens
Webster’s screen gives you a clean universe. Other screens in the library help sort it by setup type or by how fast the stock is moving.
The top 10 swing trading screens guide walks through ten presets that pair well with it, from 52 week highs to the 21 day pullback. The momentum stock screener covers the faster moving leaders and the pullback screens that time them. For how Deepvue fits a swing trader’s whole routine, including charts and the daily review, see Deepvue for swing traders.
When a Name on the List Should Be Ignored
Passing six conditions earns a stock a look, not a position. Move on when:
- •The setup has no stop. If you cannot point to the level where the idea fails, the risk cannot be sized.
- •It is already extended. A stock 15% above its 21 day line may still be a leader, but the swing from here is someone else’s.
- •It closes weak. Repeated closes in the bottom of the daily or weekly range, even inside an uptrend, mean sellers are winning the end of each session.
- •Earnings are inside the holding period. A swing trade is a bet on a setup, and a report turns it into a bet on a number.
- •The market is under distribution. When the indexes are taking heavy volume selling, even the best looking swing setups fail at a higher rate. Webster’s own guidance is to interpret what the market is doing now rather than predict it.
Who Gets the Most From This Screen
- •Swing traders who want a clean universe of liquid leaders to review every evening
- •Traders who follow Mike Webster’s work and want his screen and columns exactly as he uses them
- •Part time traders with limited review time who need the list short enough to finish
- •Anyone learning how to find stocks for swing trading with a screen whose logic is easy to follow
- •Position traders looking for add on points in leaders they already own
Pricing
One plan at $49 a month, with every feature included.
- •The Swing Trading List and Webster’s four other screens, plus the rest of the Top Traders library, editable once copied
- •Webster’s closing range and volume columns, alongside all 1,152 fields as columns and conditions
- •Split view charting with a quarterly stats table, so each candidate is judged without leaving the list
- •Watchlists, color tags and alerts, which carry a candidate from tonight’s review to tomorrow’s entry
MarketSurge, where many swing traders start, is $149 a month.
New accounts include a setup call, introductory emails and weekly webinars that each take one module apart.
A Shorter List, a Better Hour
Good swing trading is mostly about where you spend your attention. Webster’s screen spends it for you on liquid stocks that have led the market for a year and have not broken down since, and his columns show which of them buyers are still holding. What remains is the part no screen can do: picking the few charts with a tight setup and a clear stop, and sizing them so that no single swing can hurt you.
Screens built around other trading approaches are listed at stock screener by strategy. Webster’s folder and the presets of 27 other traders are organized at stock screener by trader, while formation screens are grouped under stock screener by pattern, indicator driven screens under stock screener by indicator and scans tied to the session clock under stock screener by market timing.
Open Webster’s Swing Trading List
↑ Back to contentsFrequently Asked Questions
What is the best stock screener for swing trading?
The best stock screener for swing trading filters for liquidity and multi timeframe relative strength, shows closing range and volume columns, and opens the chart next to each result. Deepvue does all of that for $49 a month, with Mike Webster’s Swing Trading List as a ready made starting point.
How do you scan stocks for swing trading?
You scan stocks for swing trading by filtering for liquid names above a minimum price, requiring relative strength across several timeframes, and then reviewing the results on the daily chart for tight areas, breakouts and pullbacks with a clear stop. Webster’s Swing Trading List applies the first two steps in one click.
What are the best screener settings for swing trading?
Good screener settings for swing trading start with price above $10, 50 day average volume above 600,000 shares and average dollar volume above $6 million, then add relative strength floors over three, six and twelve months. Those are the settings in Mike Webster’s Swing Trading List preset.
What does the Mike Webster Swing Trading List look for?
The Mike Webster Swing Trading List looks for liquid stocks showing positive relative strength across short, intermediate and long term timeframes: price above $10, strong share and dollar volume, RS Rating above 30 over three and six months and above 60 over twelve months.
Which stocks are best for swing trading?
The stocks best suited to swing trading are liquid, above roughly $10, outperforming the market over several timeframes and forming a setup with a defined stop, such as a tight area or an orderly pullback. Thin, low priced or long term lagging stocks tend to make poor swing trades.
What is the 2% rule in swing trading?
The 2% rule in swing trading means never risking more than 2% of your account on a single trade. Divide that dollar amount by the distance from entry to stop to get the share count; Deepvue’s position size calculator does the arithmetic for you.
Which chart is best for swing trading?
The daily chart is the best chart for most swing trading decisions, because it shows the tight areas, breakouts and pullbacks that define entries and stops. The weekly chart adds context, confirming the larger trend so you are not swing trading against it.
How long should you hold a swing trade?
You should hold a swing trade for as long as the leg you are trading is working, typically a few days to several weeks. Many traders sell part of the position after a gain two or three times their initial risk and trail the rest, and they exit trades that have not moved within a week or two.
Is swing trading profitable?
Swing trading can be profitable for traders who keep losses small, trade liquid leaders and follow a consistent process, but most losses come from oversized positions and missing stops. Screening for strong stocks improves the odds; risk control decides the outcome.
What is the difference between swing trading and day trading?
The difference between swing trading and day trading is the holding period: day traders close every position before the market closes, while swing traders hold for days to weeks to capture a larger move. Swing trading relies on the daily chart and needs far less screen time during the session.
Who is Mike Webster in trading?
Mike Webster in trading is the former William O’Neil + Company portfolio manager known as Webby, who joined the firm in 1997 and managed money there for close to two decades. Deepvue carries five of his screens as presets, the Swing Trading List among them.
Can I customize the Swing Trading List?
Yes, you can customize the Swing Trading List by saving your own copy, which unlocks all six conditions while the original stays as Webster built it. Common changes are a higher twelve month RS floor, a larger dollar volume minimum, a weekly closing range condition and an earnings date filter.