The Momentum Stock Screener That Keeps You With the Leaders
A momentum stock screener finds the stocks that are already outperforming and gives you a way into them: names making new highs, relative strength lines breaking out, big daily movers holding above their averages, and leaders pulling back to support. Deepvue’s Momentum category ships 17 presets for exactly that, from 52 Week Highs and High Octane RS to the 21 EMA and 50 SMA pullback screens and eight relative strength line screens across four lookback periods. Every result opens beside its chart. $49 a month.
Key Takeaways
Of all the patterns ever measured in stock returns, momentum is the one that refuses to go away. Academic work going back to Jegadeesh and Titman in the early 1990s found that stocks with the strongest returns over the prior several months tended to keep outperforming over the months that followed, and the effect has shown up in market after market since.
Traders knew it long before the papers: the stock making new highs is usually the one that makes more of them.
Knowing that is easy.
Acting on it means finding the leaders early, and entering them at a price where the risk is small. Deepvue’s screener builds both halves into its Momentum presets. Some screens find the strength, others find the pause inside the strength, and all of them refresh on live data while the session is running.
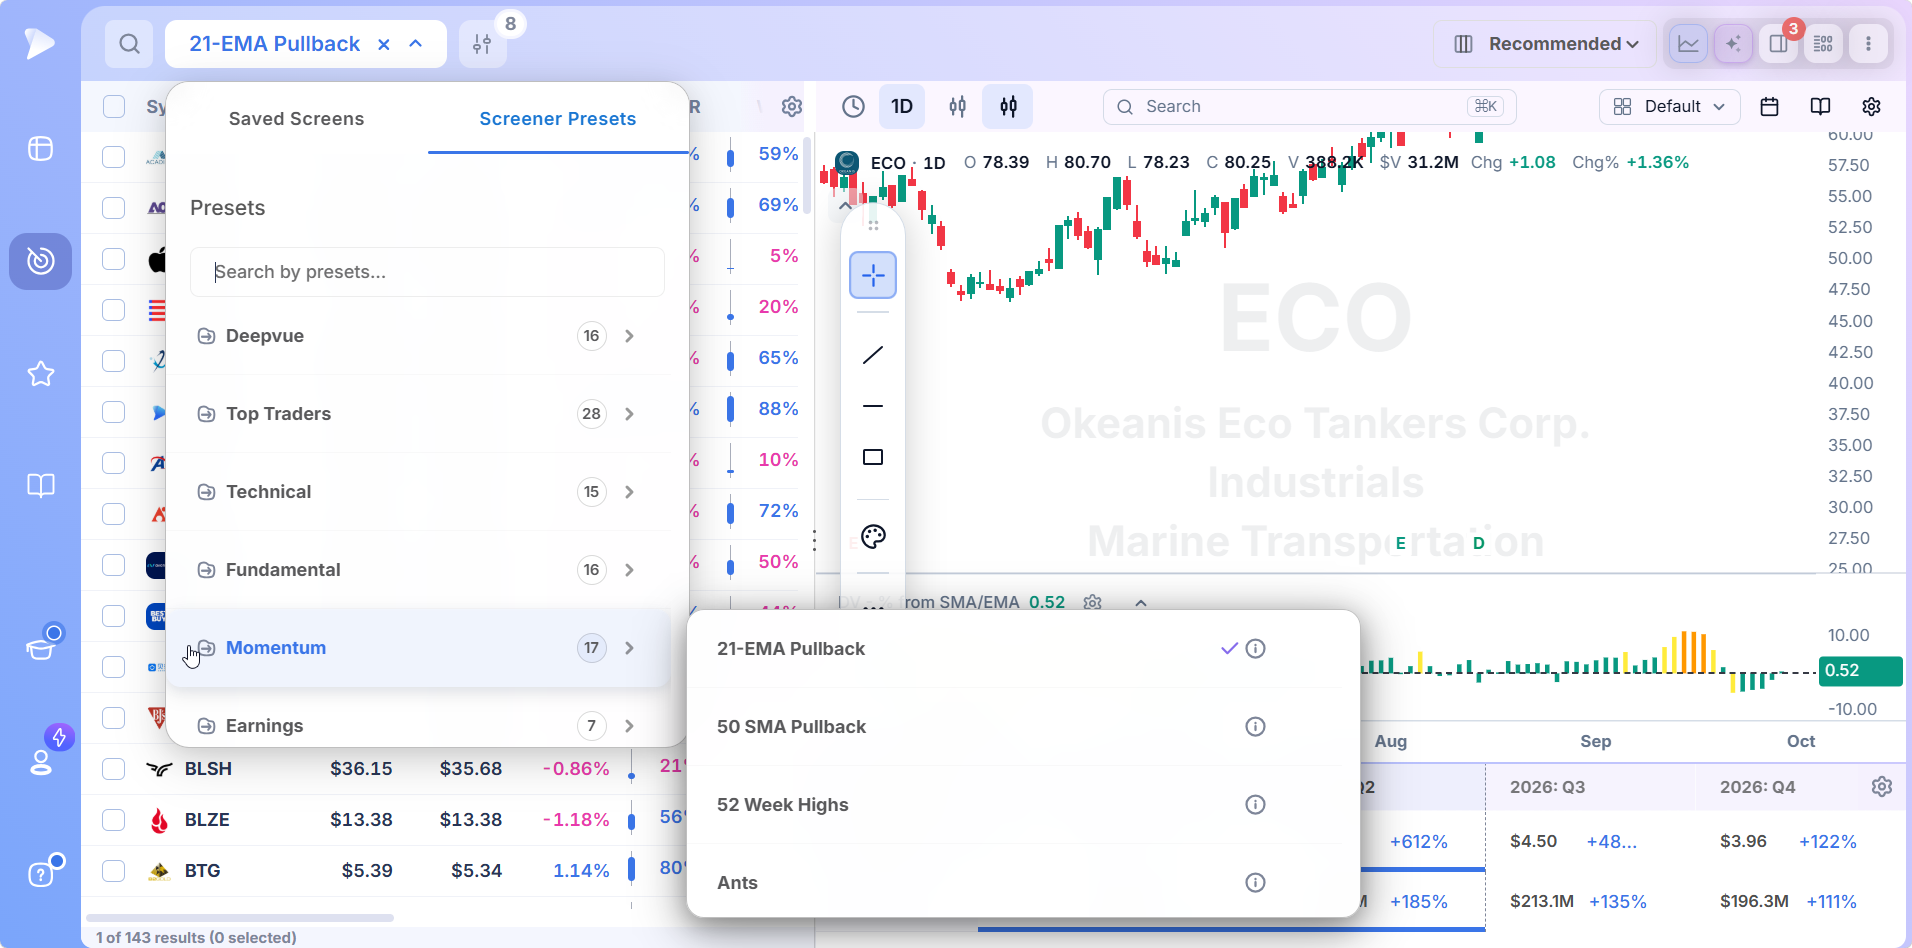
- ✓Seventeen momentum presets cover new highs, relative strength line breakouts, pullbacks to key averages and a handful of momentum setups
- ✓A momentum stock is defined by persistence: outperforming the market over weeks and months, not one big day
- ✓The RS New Highs Before Price screens look for the relative strength line leading the stock, one of the earliest signs a leader is forming
- ✓Pullback screens turn a strong but extended list into entries with a nearby stop
- ✓Columns for relative volume, closing strength and accumulation rank each result by conviction
- ✓One $49 a month plan includes every preset, streaming data, charts, lists and alerts
What Is a Momentum Stock Screener?
A momentum stock screener searches the market for stocks whose price is rising faster than everything around them and whose trend shows no sign of breaking. The filters are relative rather than absolute: price against its own history, against its moving averages, against the S&P 500. A stock up 30% in a flat market qualifies; a stock up 30% after falling 60% usually does not.
Momentum trading is the practice of buying those stocks and holding them while the strength lasts. The screen does the finding, which is most of the work, because leaders are rare and the market holds several thousand stocks going nowhere in particular.
What Makes a Momentum Stock
Three traits separate a genuine momentum stock from one that simply had a good week.
- •It leads. Its relative strength line, price divided by the index, is rising and near its highs.
- •It trends. Price holds above a rising 21 day and 50 day average, and pullbacks stop at those lines instead of cutting through them.
- •It is bought. Up days come on heavier volume than down days, the footprint of institutions building a position over weeks.
Each of the presets below tests at least one of those traits, and the best candidates pass all three.
The Seventeen Momentum Presets in Deepvue
Grouped by the question each one answers. Three are quoted in detail below from the descriptions shown in the app.
| Question | Presets | What the group catches |
|---|---|---|
| Is it at new highs? | 52 Week Highs, High Octane RS | Stocks already proving leadership in price, from fresh annual highs to big daily movers above their averages |
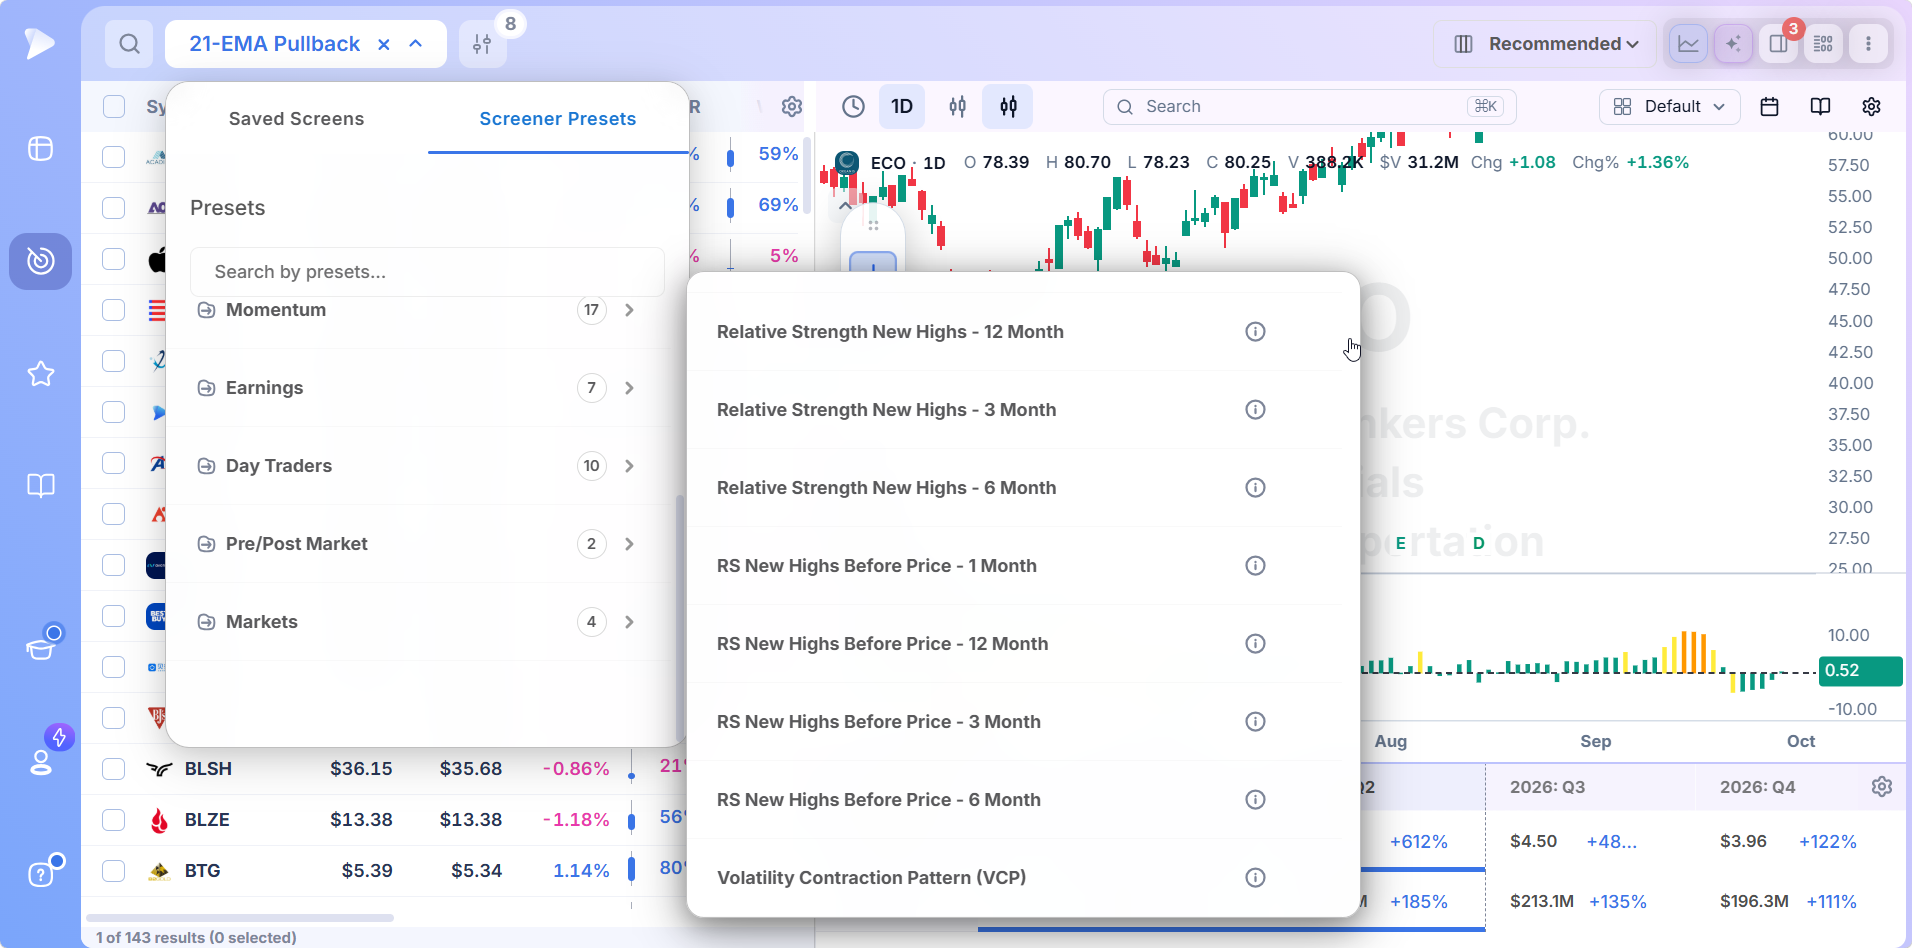
| Is the RS line breaking out? | Relative Strength New Highs (1, 3, 6 and 12 Month) | Stocks whose outperformance versus the index is the strongest of the whole lookback |
| Does relative strength lead the chart? | RS New Highs Before Price (1, 3, 6 and 12 Month) | Relative strength at a new high while the stock itself has not broken out yet |
| Is it pulling back in a trend? | 21 EMA Pullback, 50 SMA Pullback | Uptrending stocks easing back toward a key moving average, where entries have a close stop |
| Is it setting up? | Volatility Contraction Pattern (VCP), Buyable Gap Up (BGU) | Two named momentum setups: contracting bases and gaps on news that hold |
| Other momentum signatures | Power Trend, Ants, Float Squeeze | Persistent trends, streaks of buying and supply driven moves, each defined in its own description |
52 Week Highs: Leadership You Can See
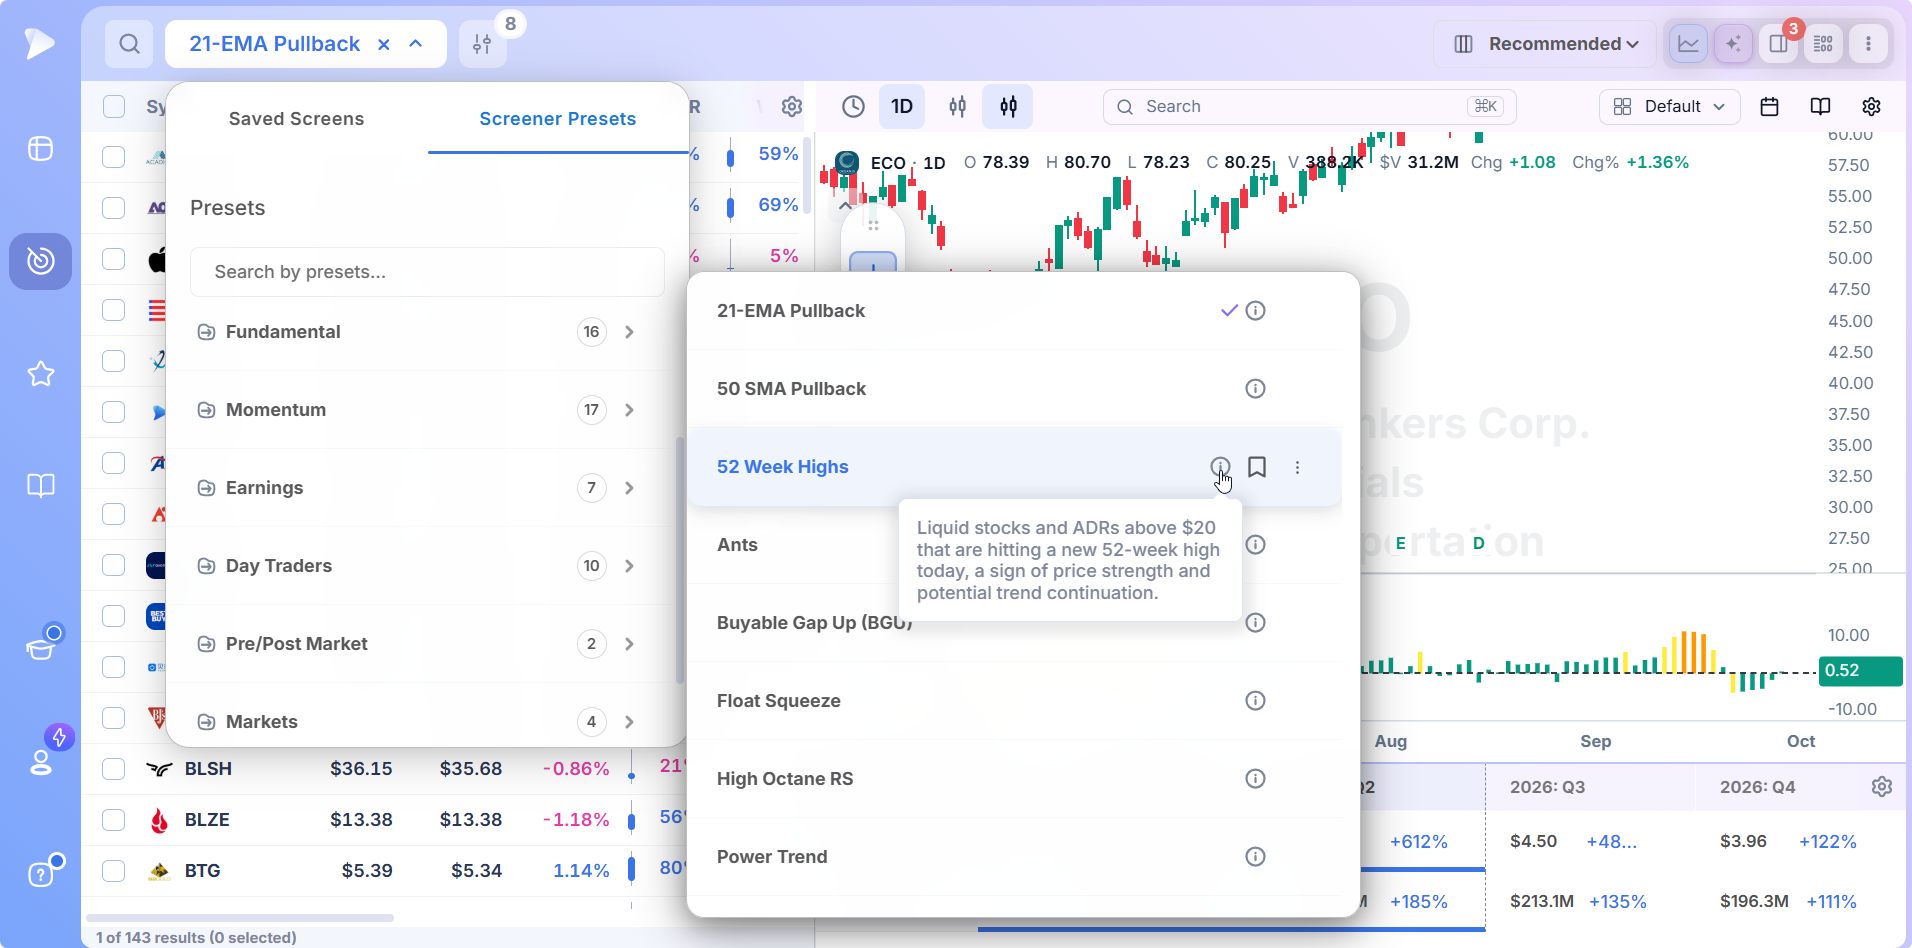
The description reads: liquid stocks and ADRs above $20 that are hitting a new 52 week high today, a sign of price strength and potential trend continuation. Buying new highs feels wrong to most people, which is part of why it works. A stock at a 52 week high has no overhead supply from holders waiting to break even, and every owner is sitting on a gain. The $20 floor and the liquidity test keep the list to names institutions can own.
High Octane RS: The Big Daily Movers That Hold Their Trend
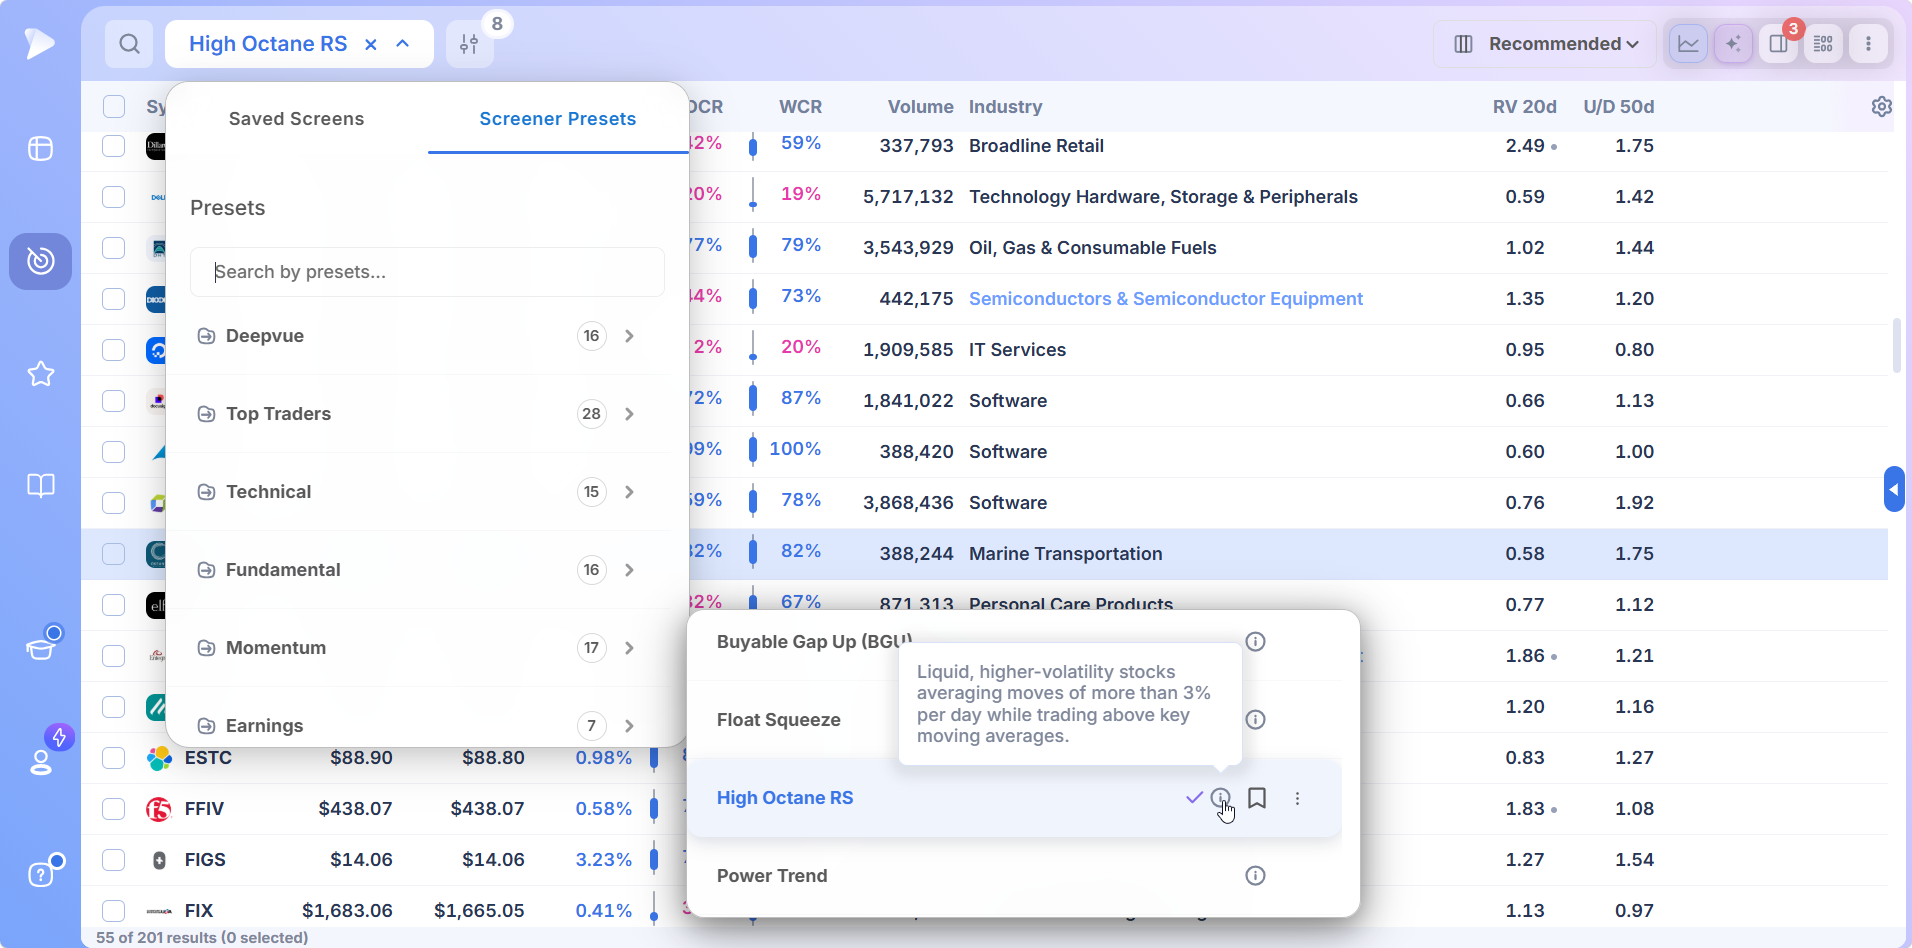
From the description: liquid, higher volatility stocks averaging moves of more than 3% per day while trading above key moving averages. This is the screen for high volatility stocks that are volatile in the right direction. A stock that routinely moves 3% or more a day offers the largest gains per unit of time, and requiring price above its key averages filters out the ones swinging wildly inside a downtrend. Position size is the lever here, since the same volatility that makes the gains cuts both ways.
RS New Highs Before Price: The Early Warning
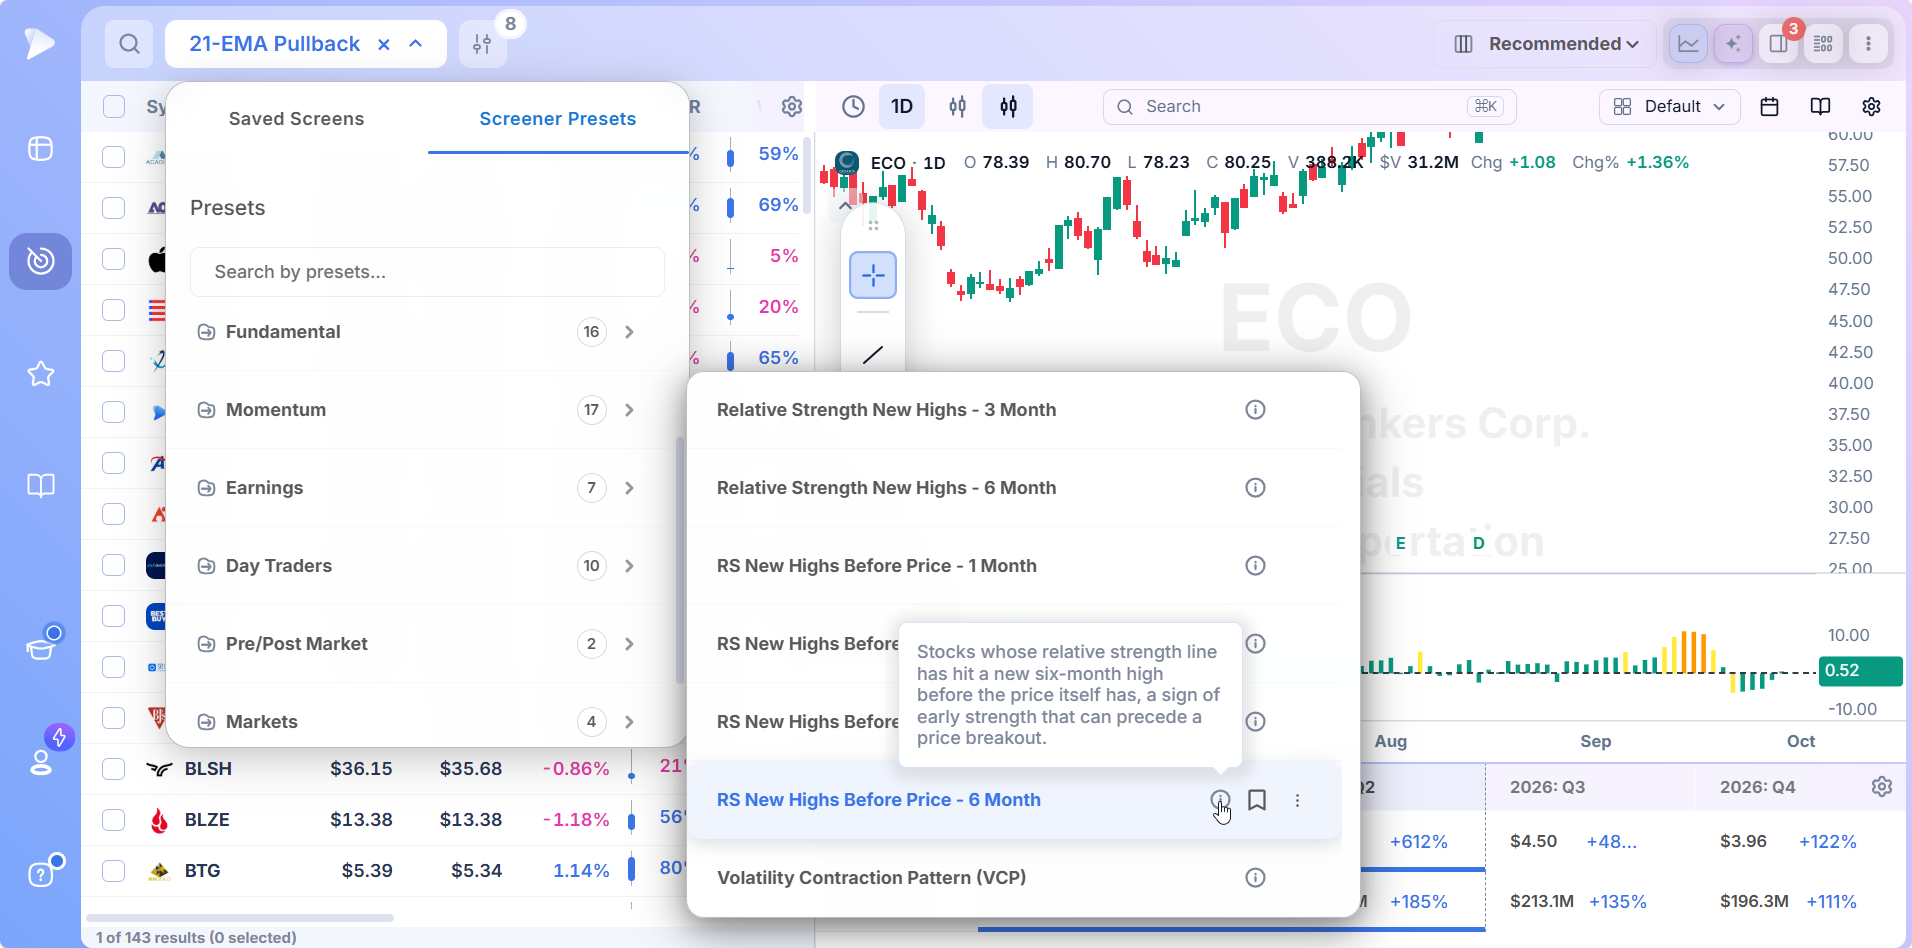
The six month version describes itself as stocks whose relative strength line has hit a new six month high before the price itself has, a sign of early strength that can precede a price breakout. When a stock holds steady while the index falls, its RS line climbs even though the price chart looks unremarkable.
That divergence is often the first visible sign that someone large is supporting the stock, and it tends to show up weeks before the breakout that makes it obvious. The relative strength stock screener covers the companion screens, where the RS line and price break out together.
21 EMA and 50 SMA Pullbacks: Entries Inside the Trend
Momentum lists are full of stocks that are strong and extended at the same time. The pullback presets solve that by finding uptrending stocks that have eased back toward a moving average. The 21 day exponential average is the line fast leaders tend to respect; the 50 day simple average is where slower, larger leaders usually find support. A pullback on light volume to either line, followed by a turn back up, is one of the lowest risk entries a momentum trader gets.
Why Momentum Is Easy to See and Hard to Catch
Every financial site publishes a list of today’s top gainers. It is the worst place to look for momentum stocks. The list is dominated by penny stocks, biotech headlines and short squeezes that reverse by the close, and the genuine leaders on it are usually already too extended to buy.
Momentum that lasts is visible over weeks, not hours, and the useful question is not what went up today but what keeps going up.
The second difficulty is timing. A screen that only returns strength hands you a list of stocks you are late to. A momentum screener worth using has to return the strength and the pause, which is why the Momentum category mixes leadership screens with pullback and setup screens, and why the chart opens next to every result.
Why Deepvue Is the Best Momentum Stock Screener
Momentum trading rewards speed and punishes sloppiness. Deepvue’s case rests on putting the leaders, the measure of their conviction and the chart that times the entry in one place.
Seventeen Screens Built for Leaders
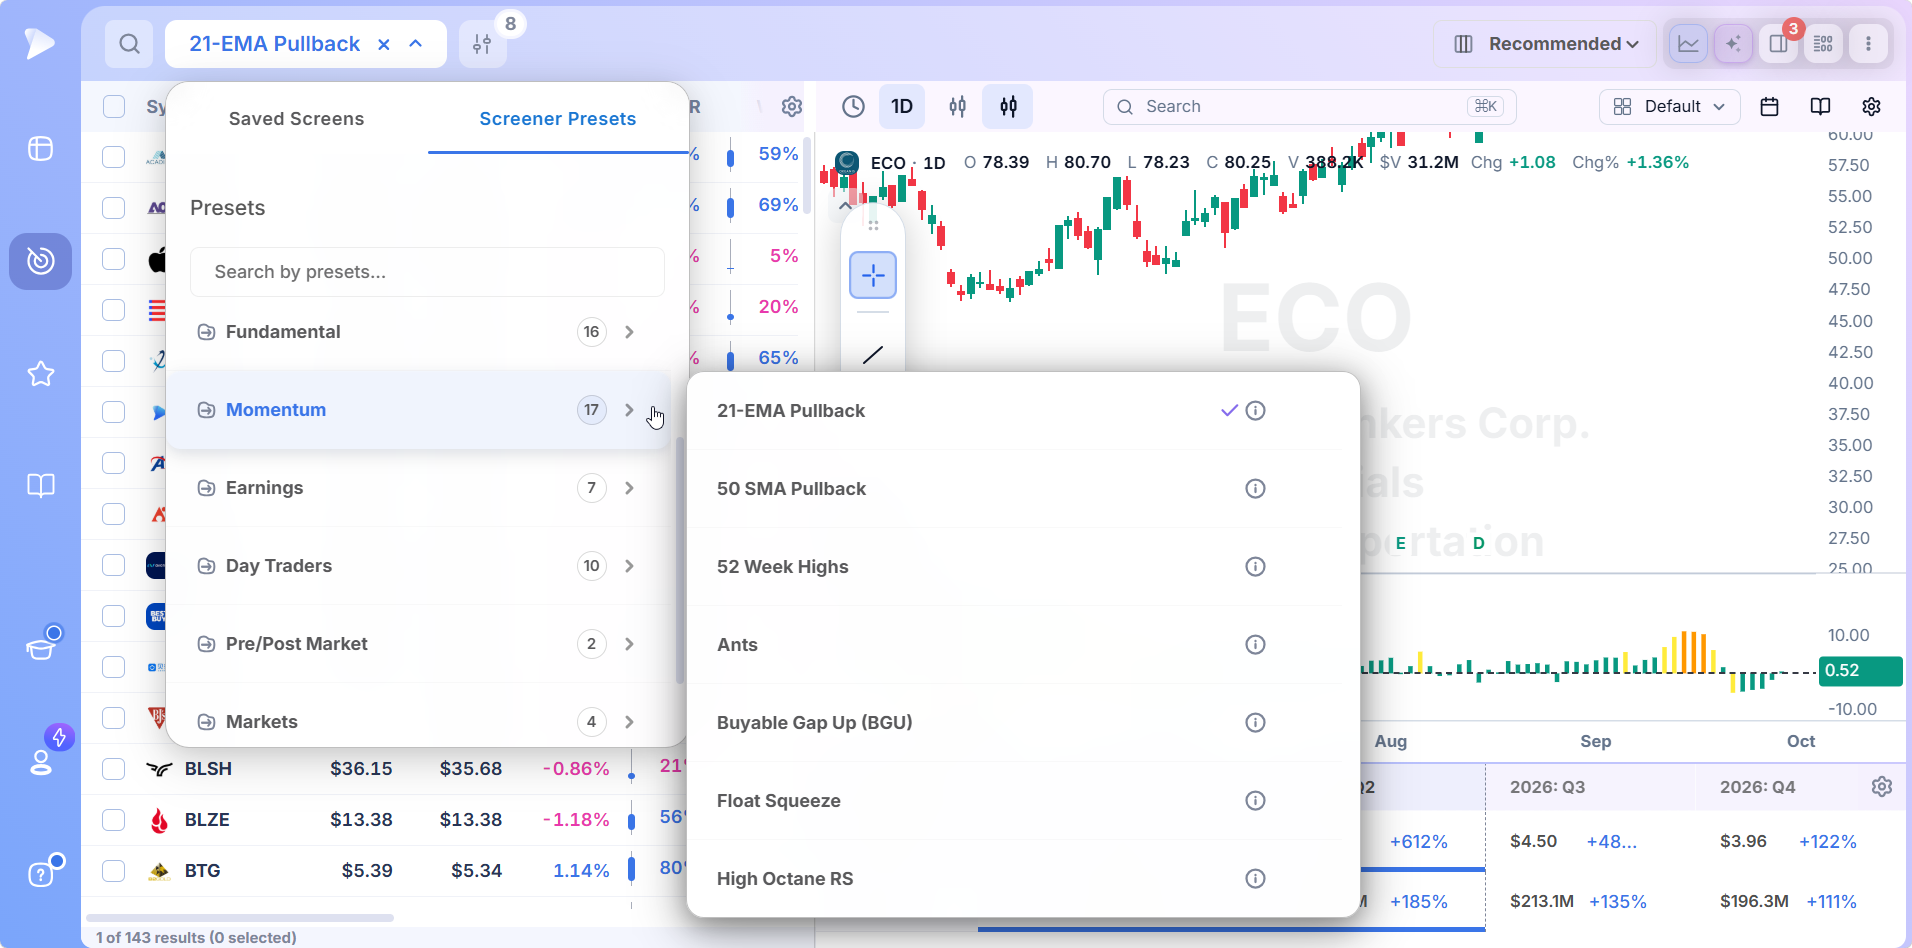
Click the name of the running screen to open the presets menu, switch to Screener Presets and choose Momentum. Its seventeen screens are listed alphabetically, each with an info icon that shows the definition before you commit. Selecting one reloads the table on live data. The presets themselves are locked, and a saved copy is where your own thresholds go.
Rank the List by Conviction
A broad momentum screen can return several hundred names in a strong market, and the columns are how you find the few that matter. The two closing range columns, daily and weekly, reveal whether buyers held the stock into the close.
Twenty day relative volume shows whether today’s trade was heavier than usual. The up/down volume ratio across 50 sessions reveals whether the trend has been built on accumulation, and anything well above 1 means up days are carrying the volume.
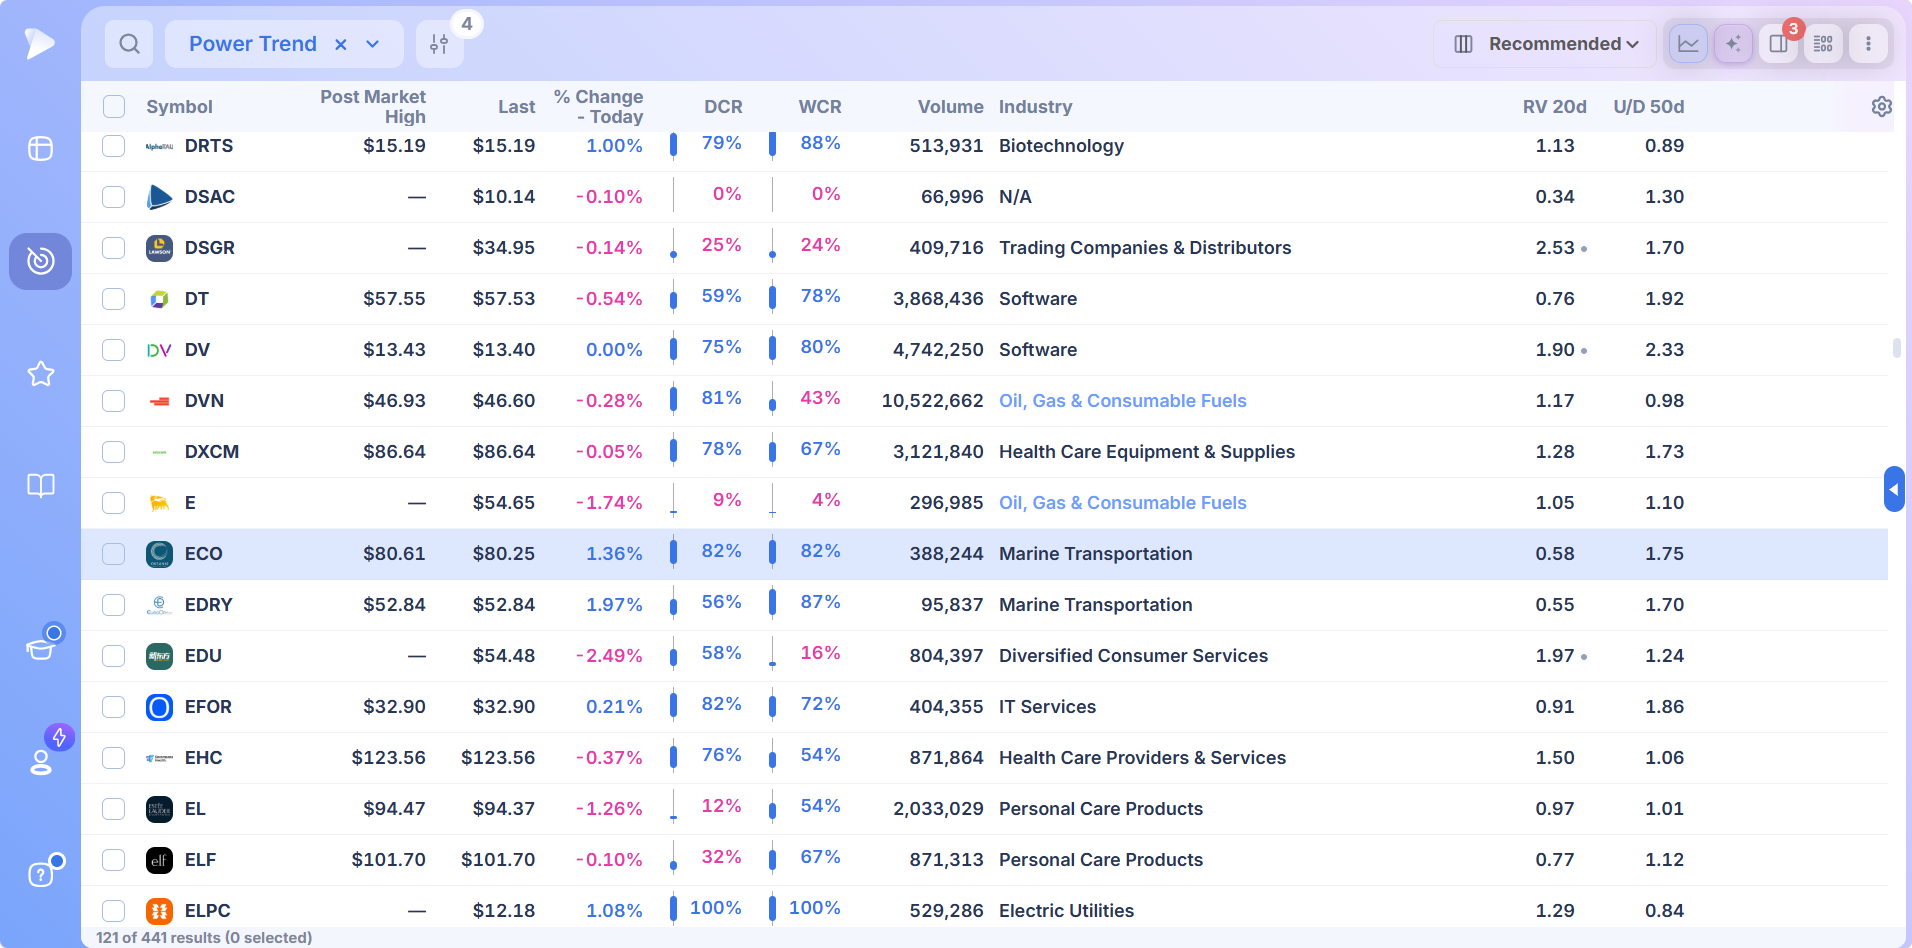
Sorting by the up/down ratio first and closing range second is a quick way to bring the most accumulated, best finishing leaders to the top of any momentum list.
The Trend and the Numbers on One Screen
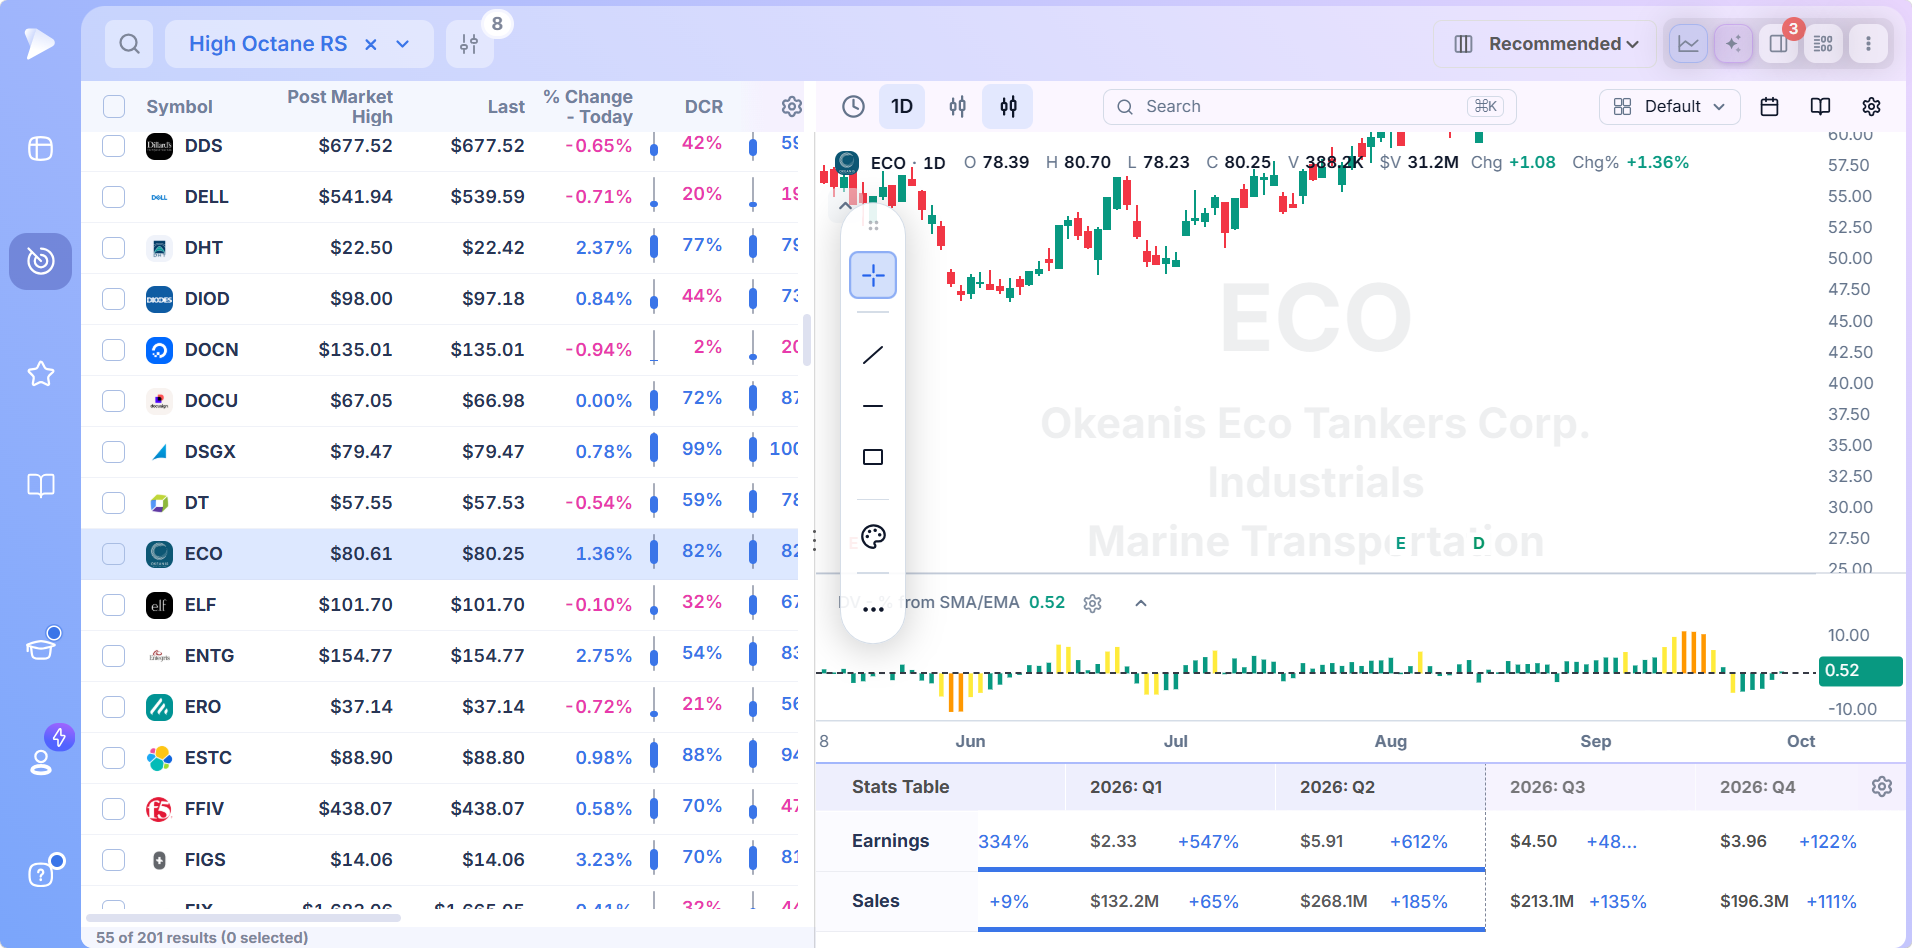
Pick a row and the chart loads in split view. A pane beneath the candles plots how far price has moved from its moving average, which is the fastest way to tell a leader near support from one stretched too far to buy. Below that, the stats table lays out quarterly earnings and sales growth, because the momentum stocks that run longest usually have numbers accelerating underneath them.
From Leader to Position
A leader that is extended today goes on a watchlist from the right click menu. An alert placed at the 21 day line or at the pivot of its next base means you hear about it when it is buyable, not when it is up another 15%. When the alert fires, the position size calculator sizes the trade to the distance between entry and stop, which matters more with momentum stocks than anywhere else.
How to Build Your Own Momentum Screen
Most momentum traders end up with one saved screen that combines leadership, trend and an entry condition.
Begin from 52 Week Highs or one of the RS New Highs presets and save a copy.
Require price above both the 21 day and 50 day averages, with the 50 day rising.
Add an entry filter: within a few percent of the 21 day line for pullback buyers, or within a few percent of the high for breakout buyers.
Add an up/down volume ratio above 1 so the trend is backed by accumulation.
Set a floor on price and average dollar volume to keep out thin, promotional names.
Name it, file it and run it after the close each day.
The AI Terminal accepts the same idea as a sentence, for example “stocks within 3% of a 52 week high, relative strength at a six month high, above a rising 50 day, accumulation ratio over 1.3”, and returns conditions you can tweak before saving.
How to Trade the Names a Momentum Screen Surfaces
A momentum trading strategy has three parts, and the screen only handles the first.
Buy Strength, Not Extension
The two classic entries are the breakout from a proper base on rising volume and the dip toward a rising average in a stock already trending. Both put the stop close. What a momentum trader avoids is buying a stock 20% above its 21 day line because it made the top of the list, since the distance to any sensible stop is too large to size a position around.
Cut Losers Quickly
Momentum works on average, not on every trade. Many breakouts fail, and the discipline that makes the strategy profitable is keeping each failure small. Exit when the stock closes back below the level that defined the entry: the pivot for a breakout, the moving average for a pullback. Waiting for it to come back is how a small loss becomes a large one.
Let the Leaders Run
The gains come from the few stocks that keep going for months, and the hardest part is not selling them early. Many momentum traders trail the fast leaders with the 21 day line and the steadier ones with the 50 day, selling on a decisive close below. A sudden burst far above the averages on the heaviest volume of the move is the other exit, since climactic runs tend to mark tops.
Momentum, Growth and Technical Screens: How They Fit Together
Momentum overlaps with two other approach based screens, and most traders use all three.
- •Momentum asks what the market is already rewarding.
- •Technical asks which of those stocks has a setup today.
- •Fundamental asks whether the numbers justify the move lasting.
The technical stock screener and the fundamental stock screener cover the other two. For a wider look at the platform through a momentum lens, see Deepvue for momentum traders.
When a Momentum Result Should Be Ignored
A stock can pass every momentum test and still be the wrong buy. Pass on it when:
- •It is stretched far above its averages. The risk to the nearest support is larger than the likely reward. Wait for the pullback screen to catch it.
- •The base is late stage. Third and fourth bases after a long advance fail far more often than the first and second.
- •The volume says distribution. Heavy volume down days and an up/down ratio sliding below 1 mean the buyers are leaving even if price has not caught up.
- •It moved on a headline alone. A single day spike on news with no trend behind it is an event, not momentum.
- •The market is correcting. Momentum strategies suffer most in sharp reversals. In a correction the new highs list shrinks, and it is better to let it shrink than to force trades.
Who Gets the Most From These Screens
- •Swing traders who buy leaders on pullbacks and breakouts and hold for days to weeks
- •Position traders who want to stay with the market’s strongest stocks through a full advance
- •Relative strength traders who read the RS line as their primary signal
- •Anyone moving beyond top gainer lists toward a structured way to find momentum stocks
- •Traders who size by volatility and want the high movers flagged before they trade them
Pricing
Deepvue is $49 a month on one plan with everything switched on.
- •All seventeen Momentum presets and every other category, each editable from a saved copy
- •Relative strength, moving average and volume fields, usable to filter and to rank
- •Split view charts with a moving average distance pane and quarterly stats, beside every result
- •568 fields streaming live, so a new high made at 11:00 appears at 11:00
MarketSurge, the platform many momentum traders come from, is $149 a month.
New accounts include a setup call, introductory emails and weekly webinars that each take one module apart.
Stay With What Is Working
The market spends most of its time rewarding a small group of stocks and ignoring the rest. A momentum stock screener keeps that group in front of you, flags the new members as their relative strength turns, and tells you when the established ones pull back to a place you can buy. The rest is patience and a stop.
Other approach based screens are listed at stock screener by strategy. Formation screens are under stock screener by pattern, single reading screens under stock screener by indicator, trader presets under stock screener by trader and session scans under stock screener by market timing.
↑ Back to contentsFrequently Asked Questions
What is a momentum stock screener?
A momentum stock screener scans the market for stocks outperforming the index and holding a strong trend, using conditions such as new highs, relative strength line breakouts, price above rising moving averages and accumulation volume. Deepvue ships seventeen momentum presets built on those conditions.
How do you find momentum stocks in a screener?
You find momentum stocks in a screener by requiring relative strength near its highs, price above a rising 21 day and 50 day average, and more volume on up days than down days, then adding an entry condition such as a pullback to the 21 day line. Deepvue’s Momentum presets cover each part.
What is a momentum stock?
A momentum stock is one that has outperformed the market over recent weeks or months and continues to trend higher, with rising relative strength, price above its key moving averages and heavier volume on up days. The defining trait is persistence rather than a single large move.
What is momentum trading?
Momentum trading is buying stocks that are already outperforming and holding them while the trend lasts, on the evidence that strong recent performance tends to persist over the following months. Traders enter on breakouts or pullbacks and exit when the stock closes below the level that defined the entry.
Does momentum trading actually work?
Momentum trading has worked over long periods in academic studies across many markets, which is why it is one of the most researched effects in finance. It works on average rather than on every trade, and it suffers in sharp market reversals, so risk control and position sizing decide the results.
What is the best momentum indicator for stocks?
The best momentum indicator for growth stock traders is the relative strength line, which divides a stock’s price by a benchmark index, because it shows leadership directly and frequently climbs ahead of the breakout itself. Deepvue’s Momentum category tests it across four lookbacks, with and without a matching price high.
Which momentum screens does Deepvue include?
Deepvue’s Momentum category includes 21 EMA Pullback, 50 SMA Pullback, 52 Week Highs, Ants, Buyable Gap Up, Float Squeeze, High Octane RS, Power Trend, Relative Strength New Highs and RS New Highs Before Price (each at 1, 3, 6 and 12 months) and Volatility Contraction Pattern, seventeen presets in total.
What does the High Octane RS screen look for?
The High Octane RS screen looks for liquid, higher volatility stocks averaging daily moves of more than 3% while trading above key moving averages. It targets high volatility stocks moving in an uptrend, which offer larger gains per day and call for smaller position sizes.
What is the difference between RS New Highs and RS New Highs Before Price?
RS New Highs returns stocks whose relative strength line has reached a new high for the lookback period, while RS New Highs Before Price adds the condition that the stock itself has not yet made a matching price high. The second set finds leadership earlier, before the breakout is visible on the price chart.
Why buy stocks at 52 week highs?
Buying stocks at 52 week highs puts you in names with no overhead supply from trapped holders and with proven demand, which is why new highs often lead to more new highs. Deepvue’s 52 Week Highs preset limits the list to liquid stocks and ADRs above $20.
What is the best momentum stock screener?
The best momentum stock screener combines leadership screens with entry screens, updates during the session and shows the chart beside each result. Deepvue covers every part of that at $49 a month, with seventeen Momentum presets plus columns that rank each list by conviction.
Can I edit the momentum presets?
Yes, the momentum presets can be edited once you save a copy of one; the shipped version stays unchanged. Typical edits tighten the distance from the high or from the 21 day line, raise the price and liquidity floor, and add an up/down volume or earnings growth condition.