The Fundamental Stock Screener That Finds Growth Before the Chart Does
A fundamental stock screener sorts the market by the business behind the ticker: how fast earnings and sales are growing, whether that growth is speeding up, how results compare with analyst estimates, and who is buying the shares. Deepvue’s Fundamental category holds 16 presets built for growth traders, from Accelerating Earnings and Big Sales Surprise to Increasing Institutional Ownership and New CEO, all running on the same data as the chart beside them. Behind the presets are 159 fundamental, 227 earnings, 126 sales and 84 ownership fields. $49 a month.
Key Takeaways
Study the biggest stock market winners of any cycle and the same thing shows up in the quarters before their largest advances: earnings and sales growing fast, and growing faster each quarter than the one before. The chart eventually reflected it. The numbers said it first, in a quarterly report anyone could read, and most traders never looked because nothing on their screen told them to.
Deepvue’s screener makes those reports searchable. The Fundamental category turns the patterns growth traders care about, acceleration, surprise, rising estimates and rising ownership, into presets that return a list, so the companies whose numbers are changing are in front of you the morning after they report.
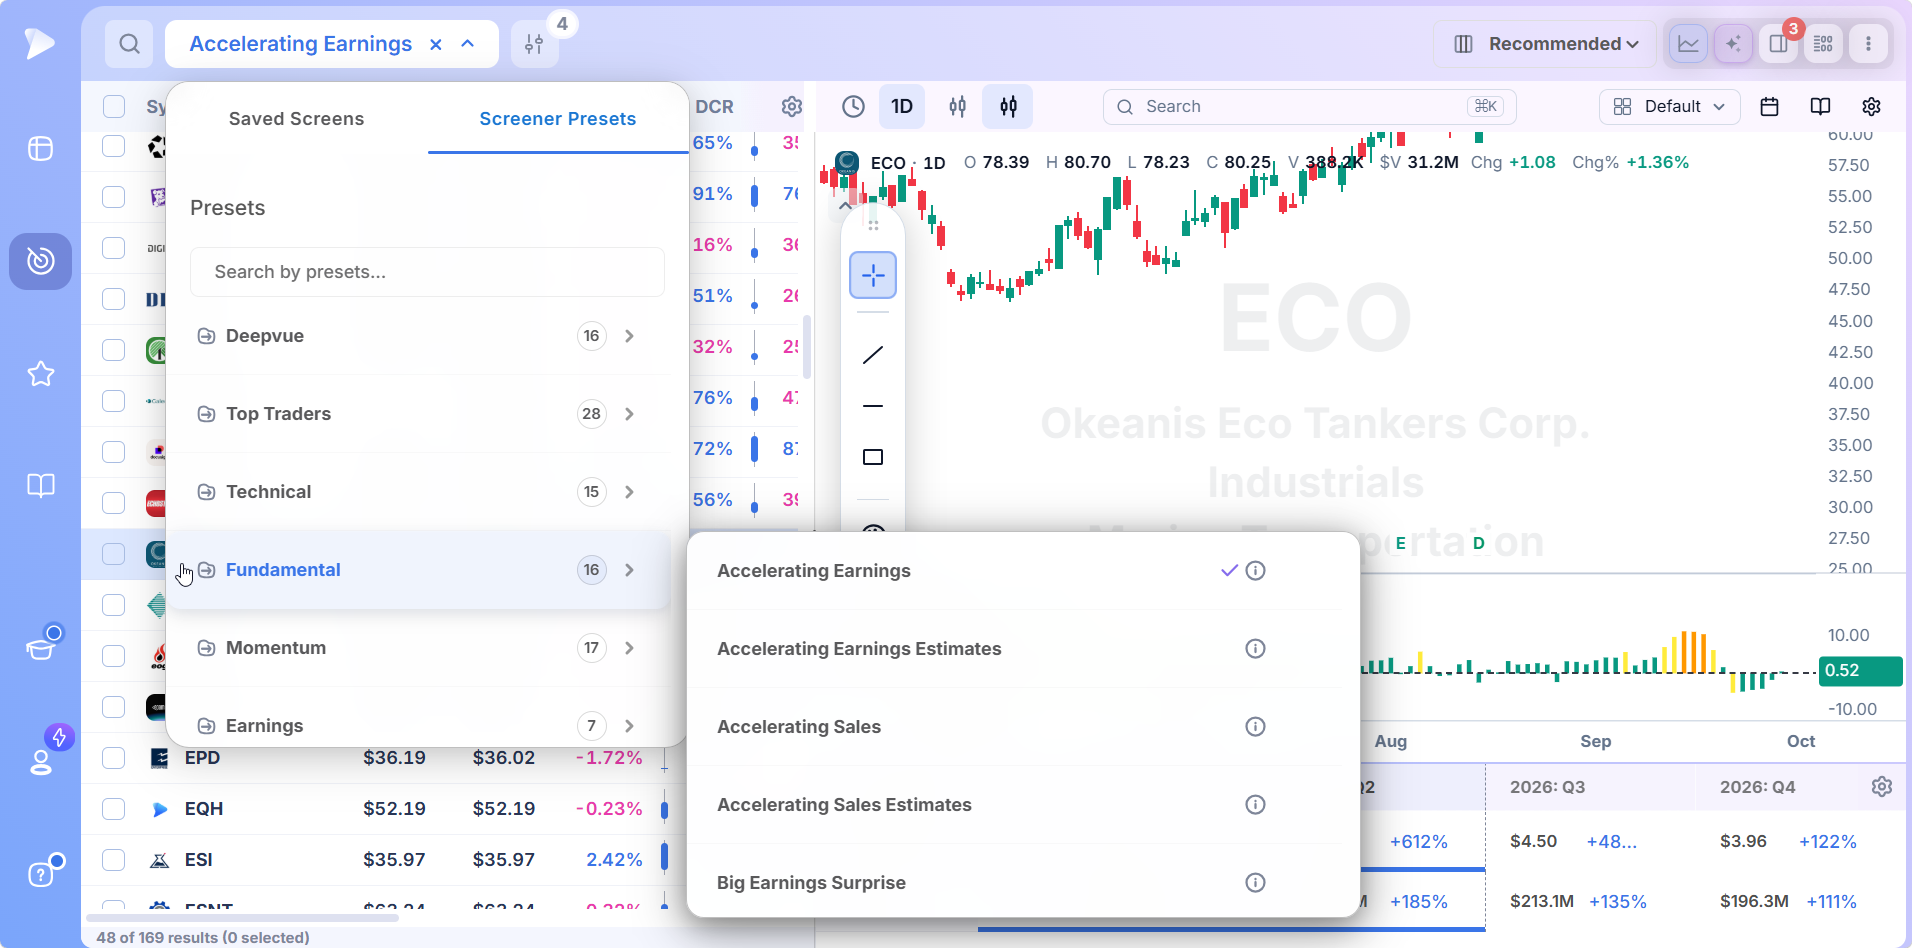
- ✓Sixteen fundamental presets test earnings acceleration, sales growth, estimates and surprises, ownership and management
- ✓Growth traders screen on the direction of the numbers: a rate that is rising matters more than a level that is high
- ✓Every result opens with its quarterly earnings and sales history beneath the chart, so the thesis is checked without leaving the screen
- ✓Fundamental conditions stack with technical ones in the same builder, which is how a list of good companies becomes a list of good setups
- ✓Presets are locked to protect the definition; a saved copy makes every threshold yours
- ✓One $49 a month plan covers the presets and all 1,152 fields, plus charting, lists and alerts
What Is a Fundamental Stock Screener?
A fundamental stock screener evaluates every listed company on its reported and expected financial results and returns the ones that meet a set of conditions. Where a chart based screen asks what the stock is doing, a fundamental screen asks what the company is doing: growing revenue by 40% a year, beating estimates by a wide margin, attracting new fund holders, bringing in new management.
The output is a shortlist of businesses worth owning if the price action agrees. That last condition is the reason Deepvue shows the chart and the fundamentals side by side, since growth traders use one to find the stock and the other to time it.
Fundamental Analysis, Narrowed to What Moves Growth Stocks
Fundamental analysis in the textbook sense covers everything from price to earnings ratios and dividend yield to debt coverage and discounted cash flow. Most of that was built for value investors, who want a dollar of assets for fifty cents. Growth traders ask a narrower question: is this business improving quickly enough that institutions will have to own it? The answer comes down to a handful of measures, all of them about change rather than level.
- •Growth rate. Quarterly EPS growth and sales growth compared with the same quarter a year earlier.
- •Acceleration. Whether those growth rates are higher this quarter than last.
- •Surprise and revisions. How reported results compare with consensus, and which way analysts are moving their estimates.
- •Sponsorship. Whether funds and insiders are adding to their positions.
Those four are the backbone of the Fundamental category.
The Sixteen Fundamental Presets in Deepvue
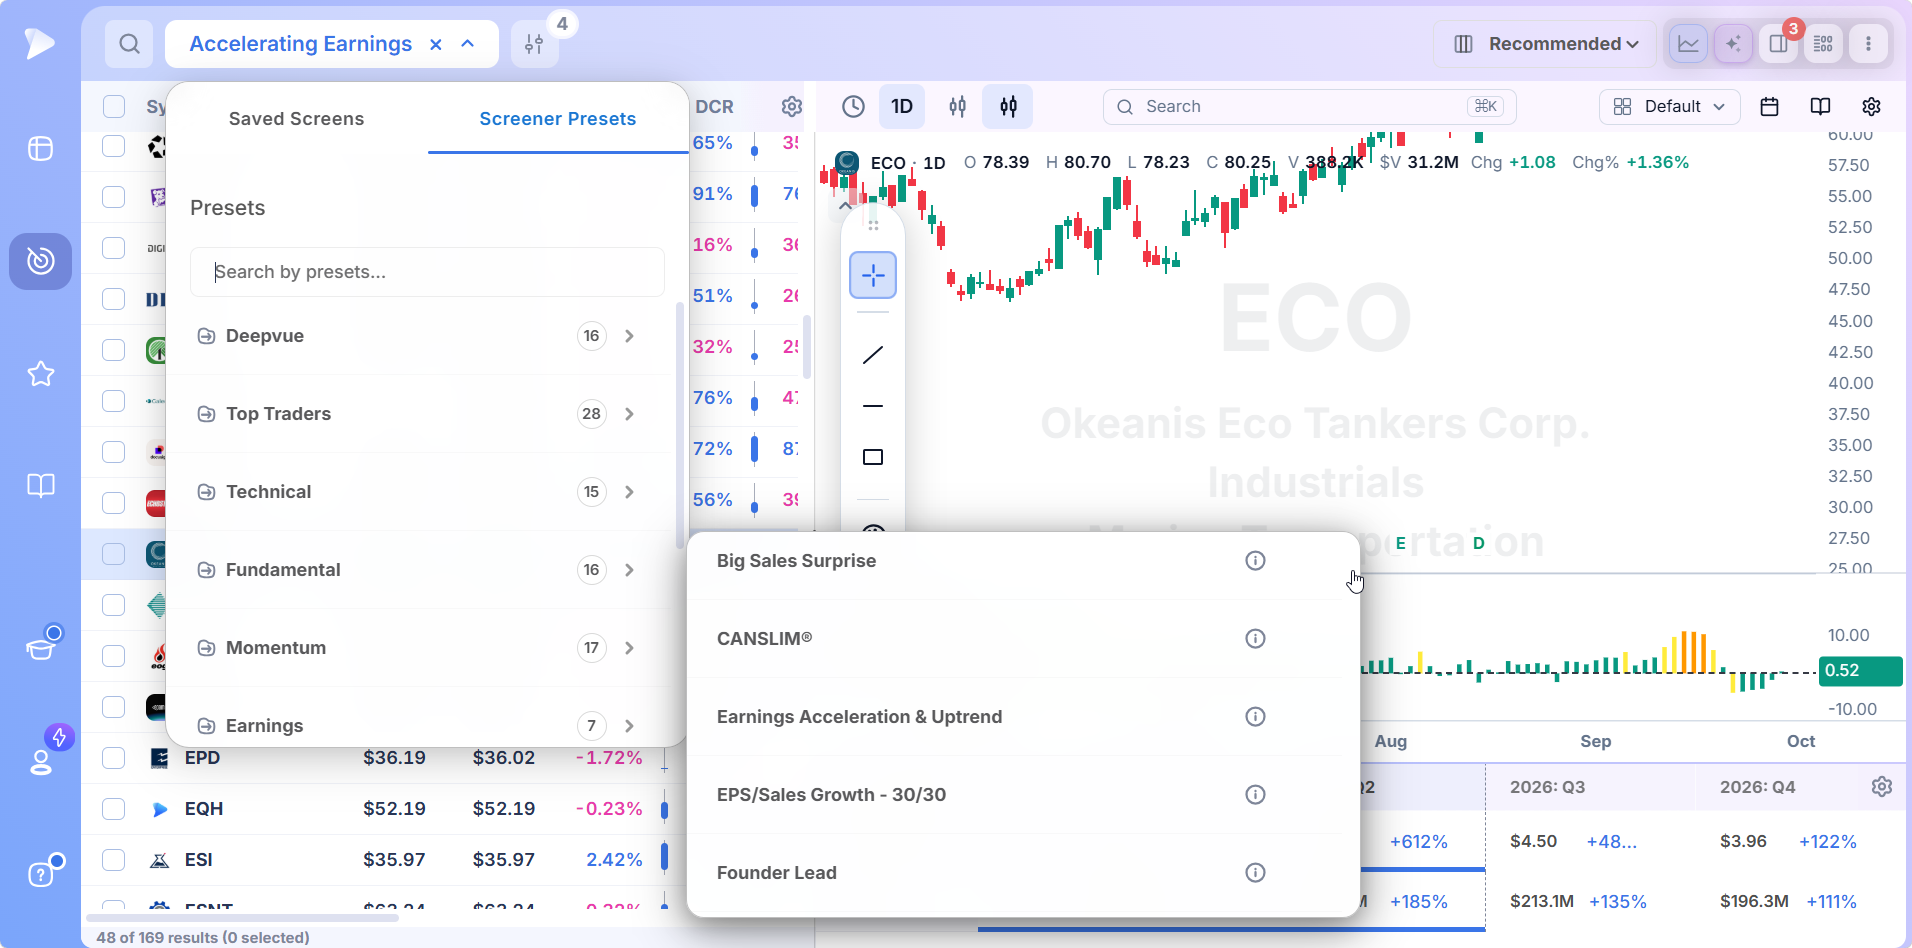
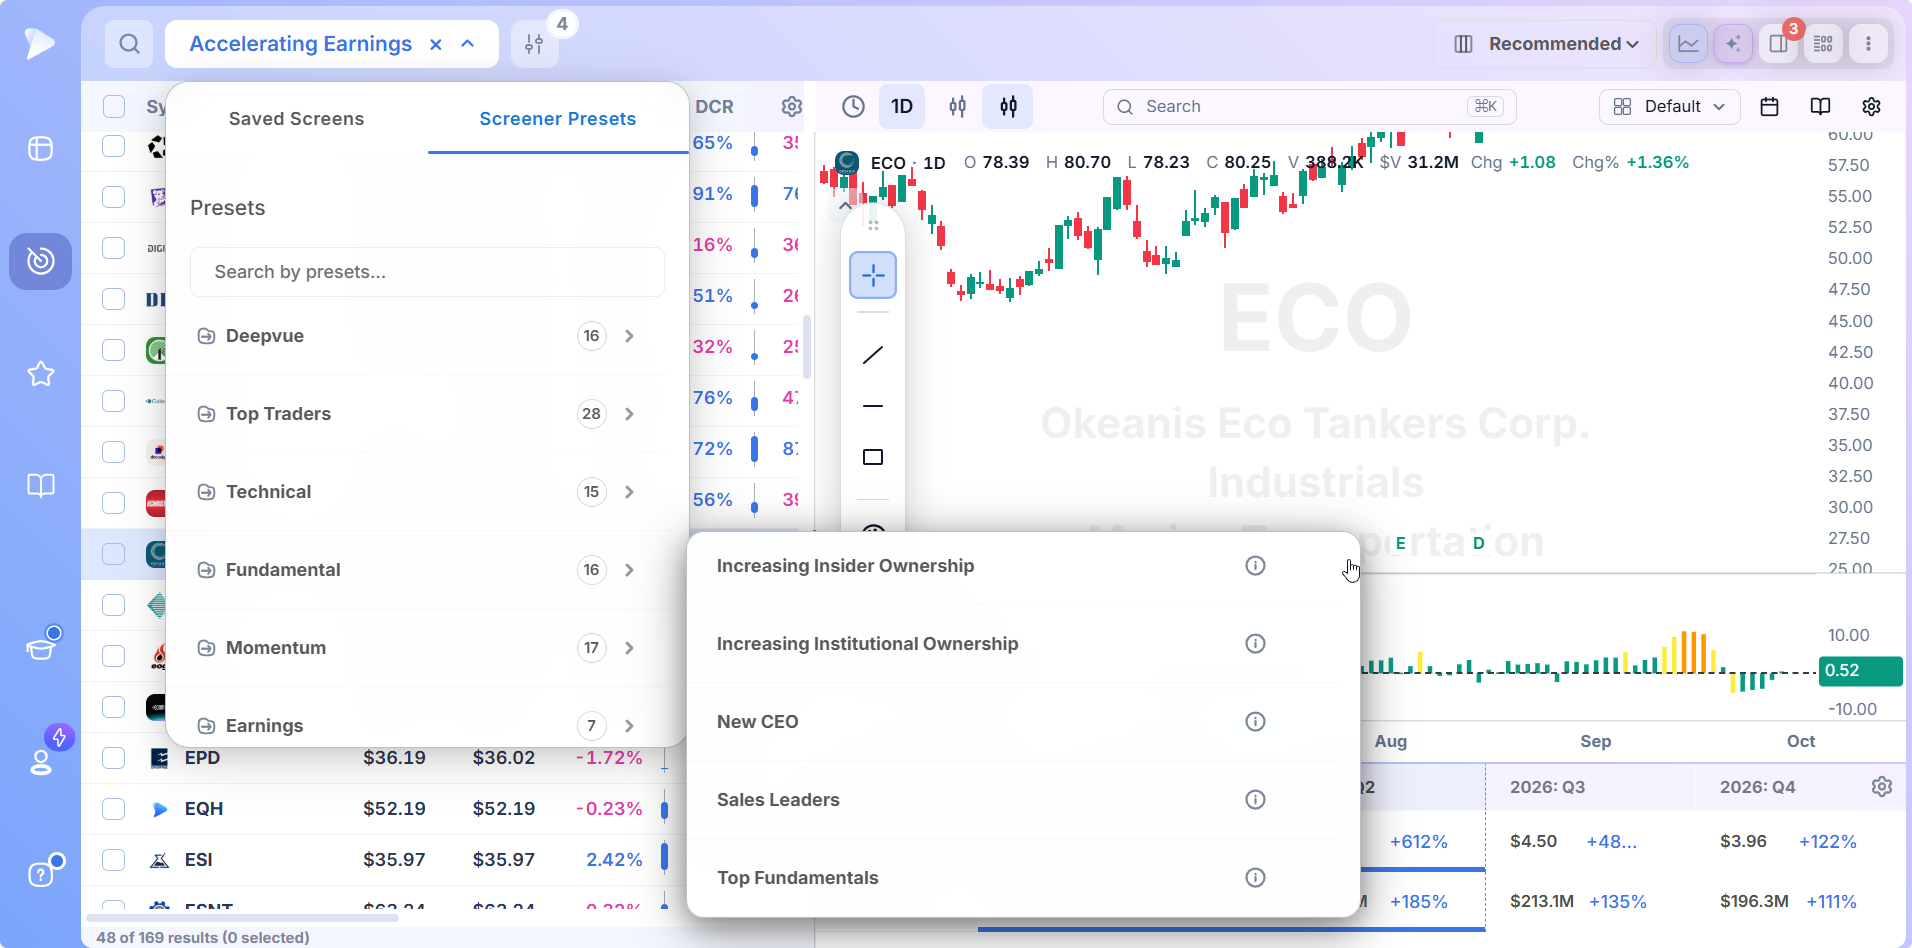
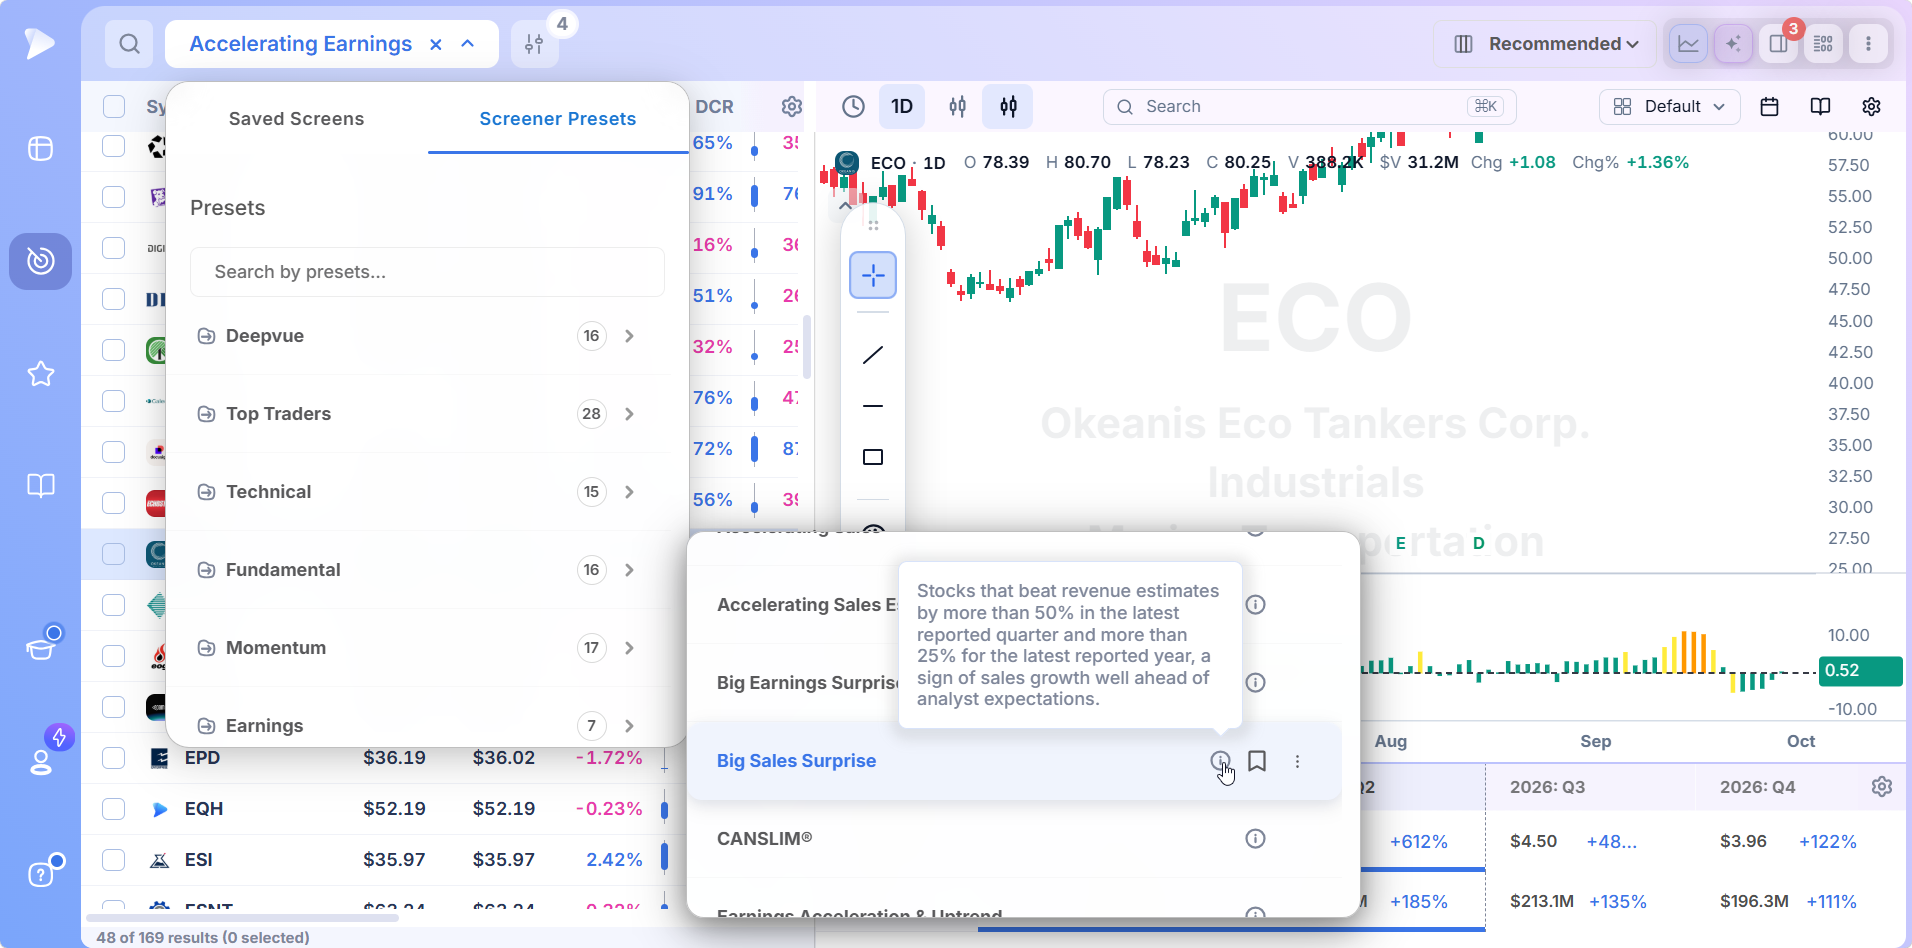
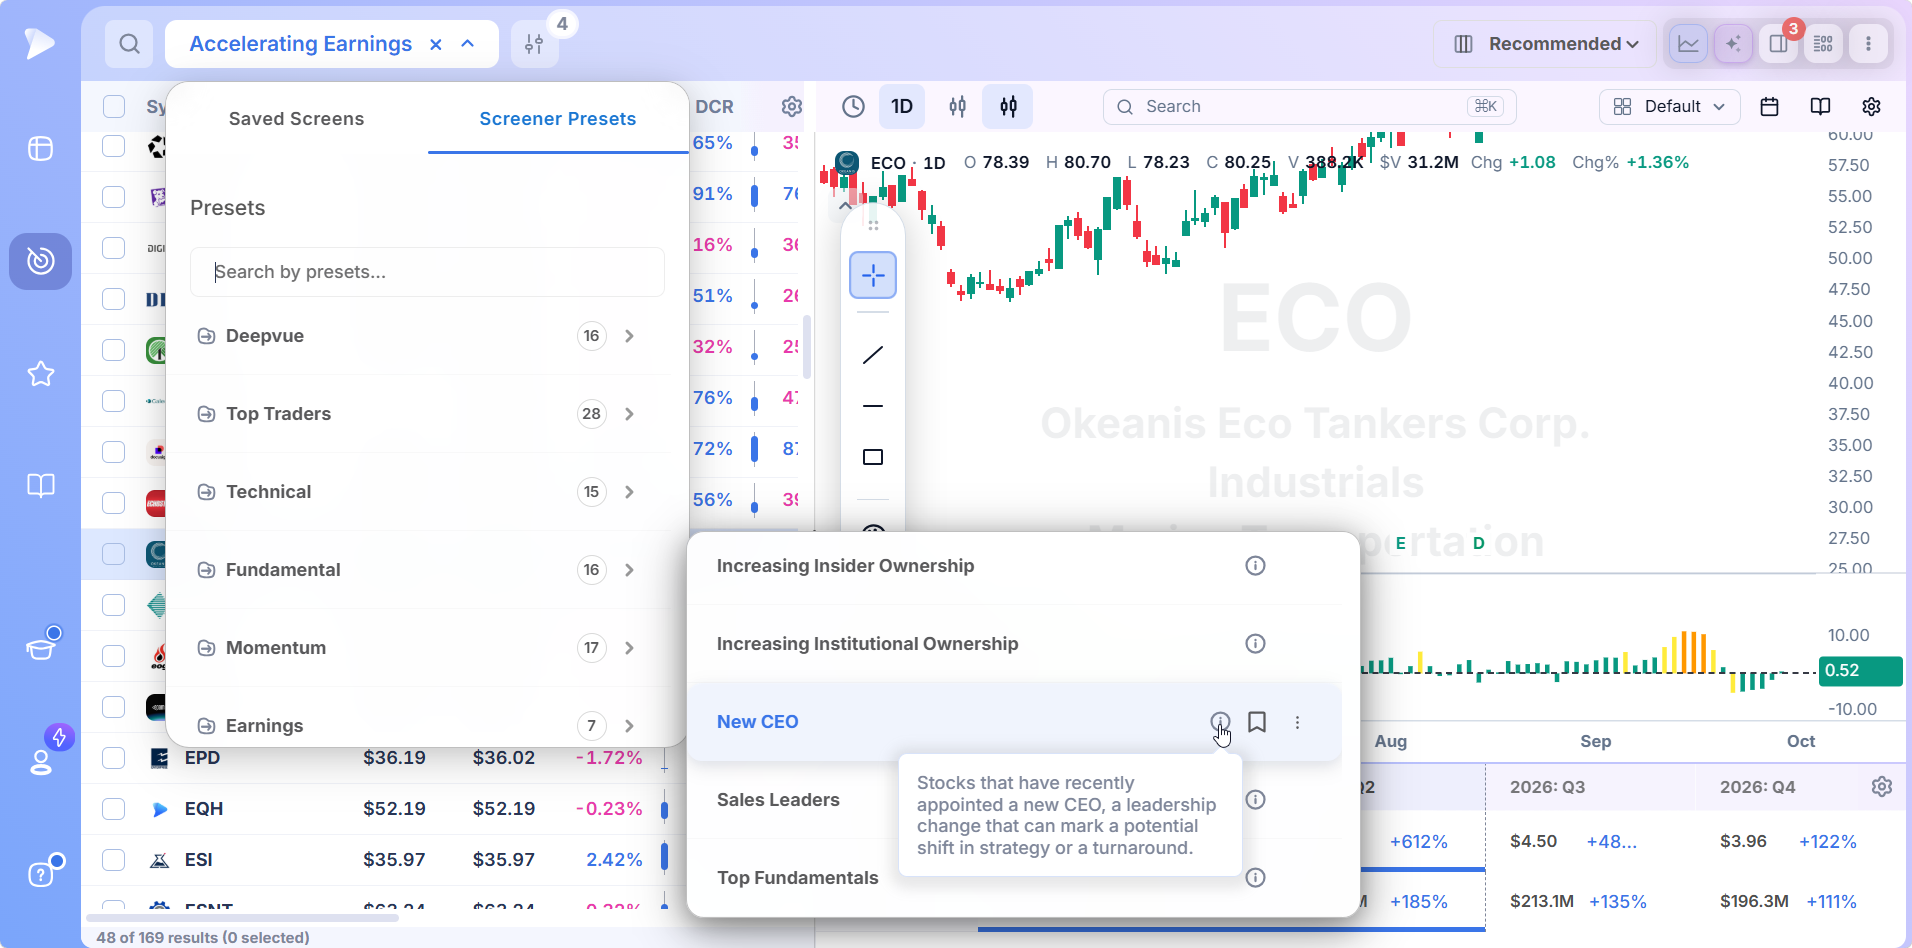
The category groups naturally by which part of the business each screen tests. Hovering the info icon beside a preset shows its definition, and the two quoted below come from there.
| What it tests | Presets | Why a growth trader cares |
|---|---|---|
| Earnings acceleration | Accelerating Earnings, Earnings Acceleration & Uptrend | A rising EPS growth rate is the single most common trait of big winners before their run |
| Sales growth | Accelerating Sales, Sales Leaders | Revenue is harder to engineer than earnings, so it confirms the growth is real |
| Estimates and surprises | Accelerating Earnings Estimates, Accelerating Sales Estimates, Big Earnings Surprise, Big Sales Surprise | Analysts who keep raising numbers, and companies that keep beating them, force institutions to reprice the stock |
| Ownership | Increasing Institutional Ownership, Increasing Insider Ownership | The buyers who move growth stocks are funds, and the people with the best information are insiders |
| Leadership | Founder Lead, New CEO | Who runs the company shapes how aggressively it grows and when the strategy changes |
| Combined thresholds | EPS/Sales Growth 30/30, Top Fundamentals | Several conditions at once for a shorter, higher quality list |
Big Sales Surprise: Revenue Well Ahead of the Street
The description in the app reads: stocks that beat revenue estimates by more than 50% in the latest reported quarter and more than 25% for the latest reported year, a sign of sales growth well ahead of analyst expectations. A 50% revenue beat is rare. It usually means demand arrived faster than the company itself guided, and analysts who were that far off tend to spend the following quarters catching up with higher estimates. Each upward revision gives funds another reason to buy.
New CEO: When the Story Is About to Change
From the description: stocks that have recently appointed a new CEO, a leadership change that can mark a potential shift in strategy or a turnaround. A new chief executive is not a buy signal by itself. It is a reason to watch, because the first few quarters under new leadership often show up in the numbers first, as margins widen or a neglected product line starts to grow. Pair the screen with an acceleration condition and it finds the turnarounds that are already working.
Accelerating Earnings: The Change in the Rate
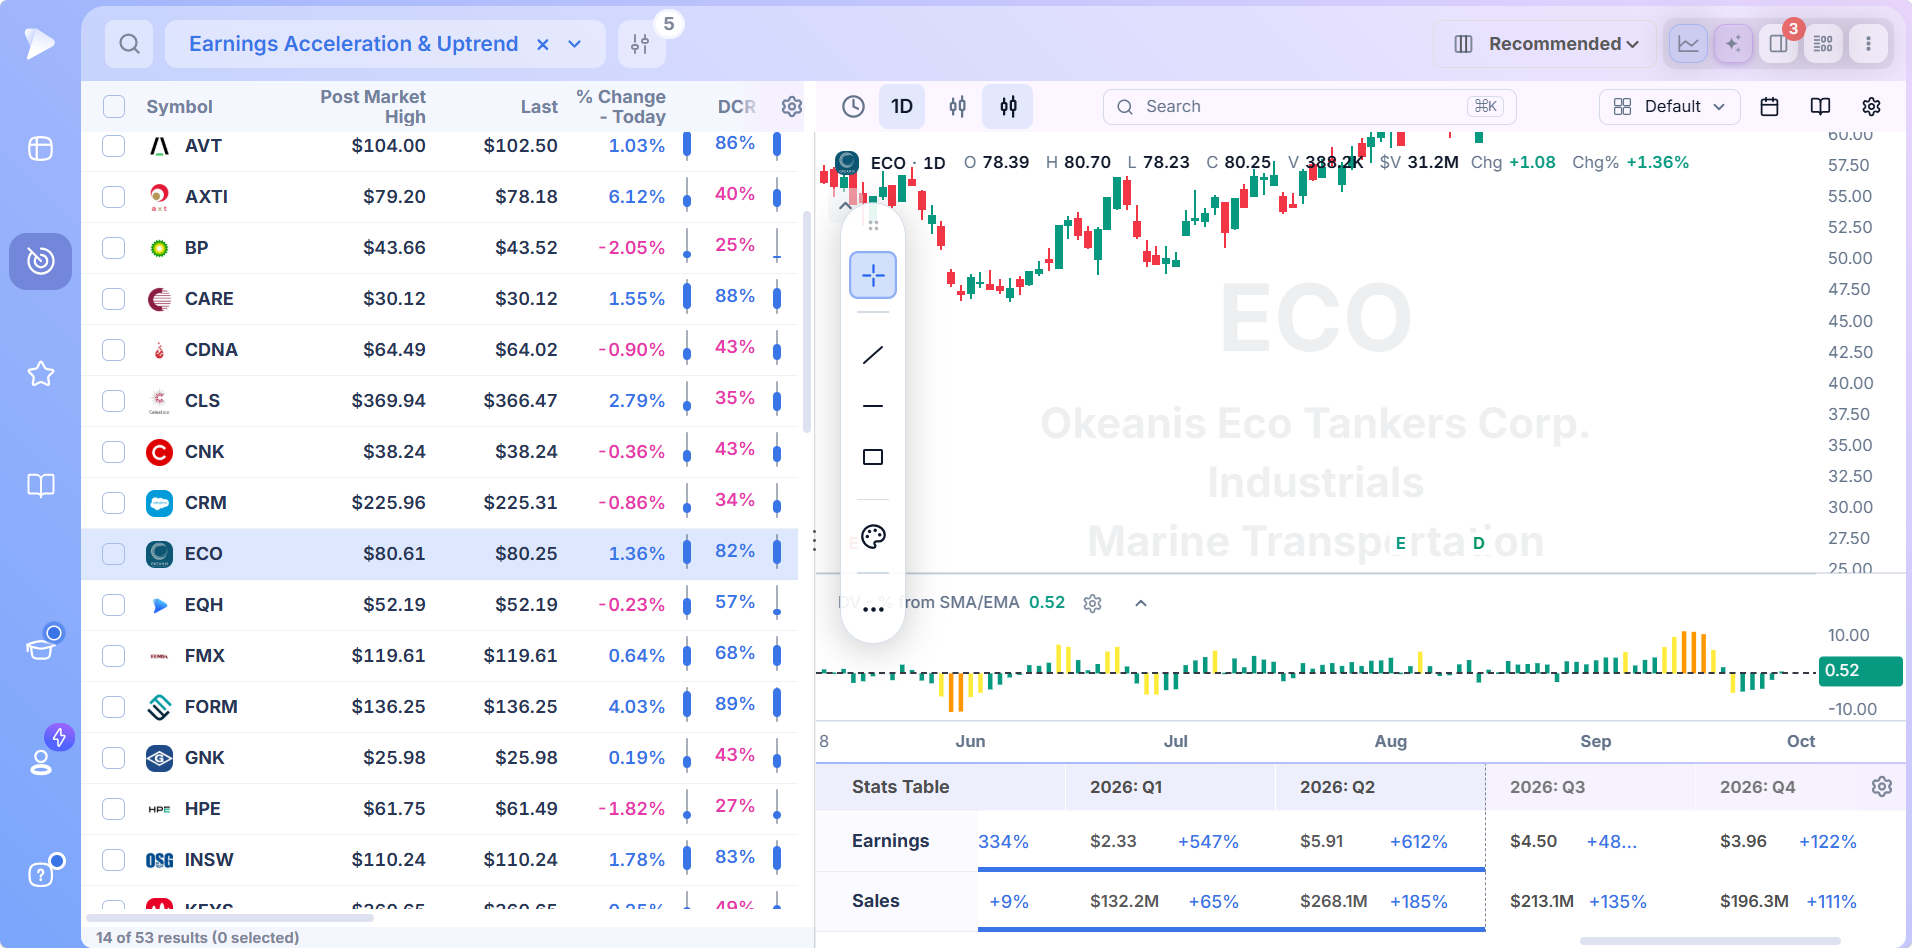
A company growing EPS at 25% for five straight quarters is a good business. A company whose growth went from 15% to 30% to 55% over three quarters is a stock institutions are about to rediscover. The acceleration screens are built around that difference. Earnings Acceleration & Uptrend adds a price trend requirement to the same idea, so the list holds only companies whose numbers and chart are improving together.
Why Most Screeners Get Fundamentals Wrong for Growth Traders
Open the fundamental filters on a typical screener and you find valuation: P/E, price to book, dividend yield, debt to equity. Useful for a value portfolio, and close to useless for finding the next leader, because the stocks that double in a year almost always look expensive on the way up. The fields a growth trader needs are the second derivative ones: growth compared with last quarter’s growth, actual compared with estimate, this quarter’s fund count compared with last quarter’s.
Timing is the other problem. Earnings season compresses thousands of reports into a few weeks, and a fundamental screen is only useful if the new quarter is in the data when the stock reacts to it. A screen that updates a week later hands you the story after the gap.
Why Deepvue Is the Best Fundamental Stock Screener for Growth Traders
The case comes down to three things a growth trader checks in every candidate: are the numbers accelerating, is the chart confirming it, and is anyone with size buying. Deepvue puts all three in one window.
Sixteen Screens Built Around Growth
The dropdown on the active screen’s name opens two tabs, Saved Screens and Screener Presets. Under Screener Presets, Fundamental is one of nine categories, and its sixteen screens each carry an info icon with the definition. Pick one and the table refills. Copy it to make changes; the shipped version stays as it is so the definition always means the same thing.
The Quarterlies Under Every Chart
Click a row and its chart opens in split view with a stats table beneath the candles: quarterly earnings and sales, each with its growth rate, running left to right across recent and estimated quarters. Reading acceleration takes one glance along a row. Reading whether the market has noticed takes one glance up at the price.
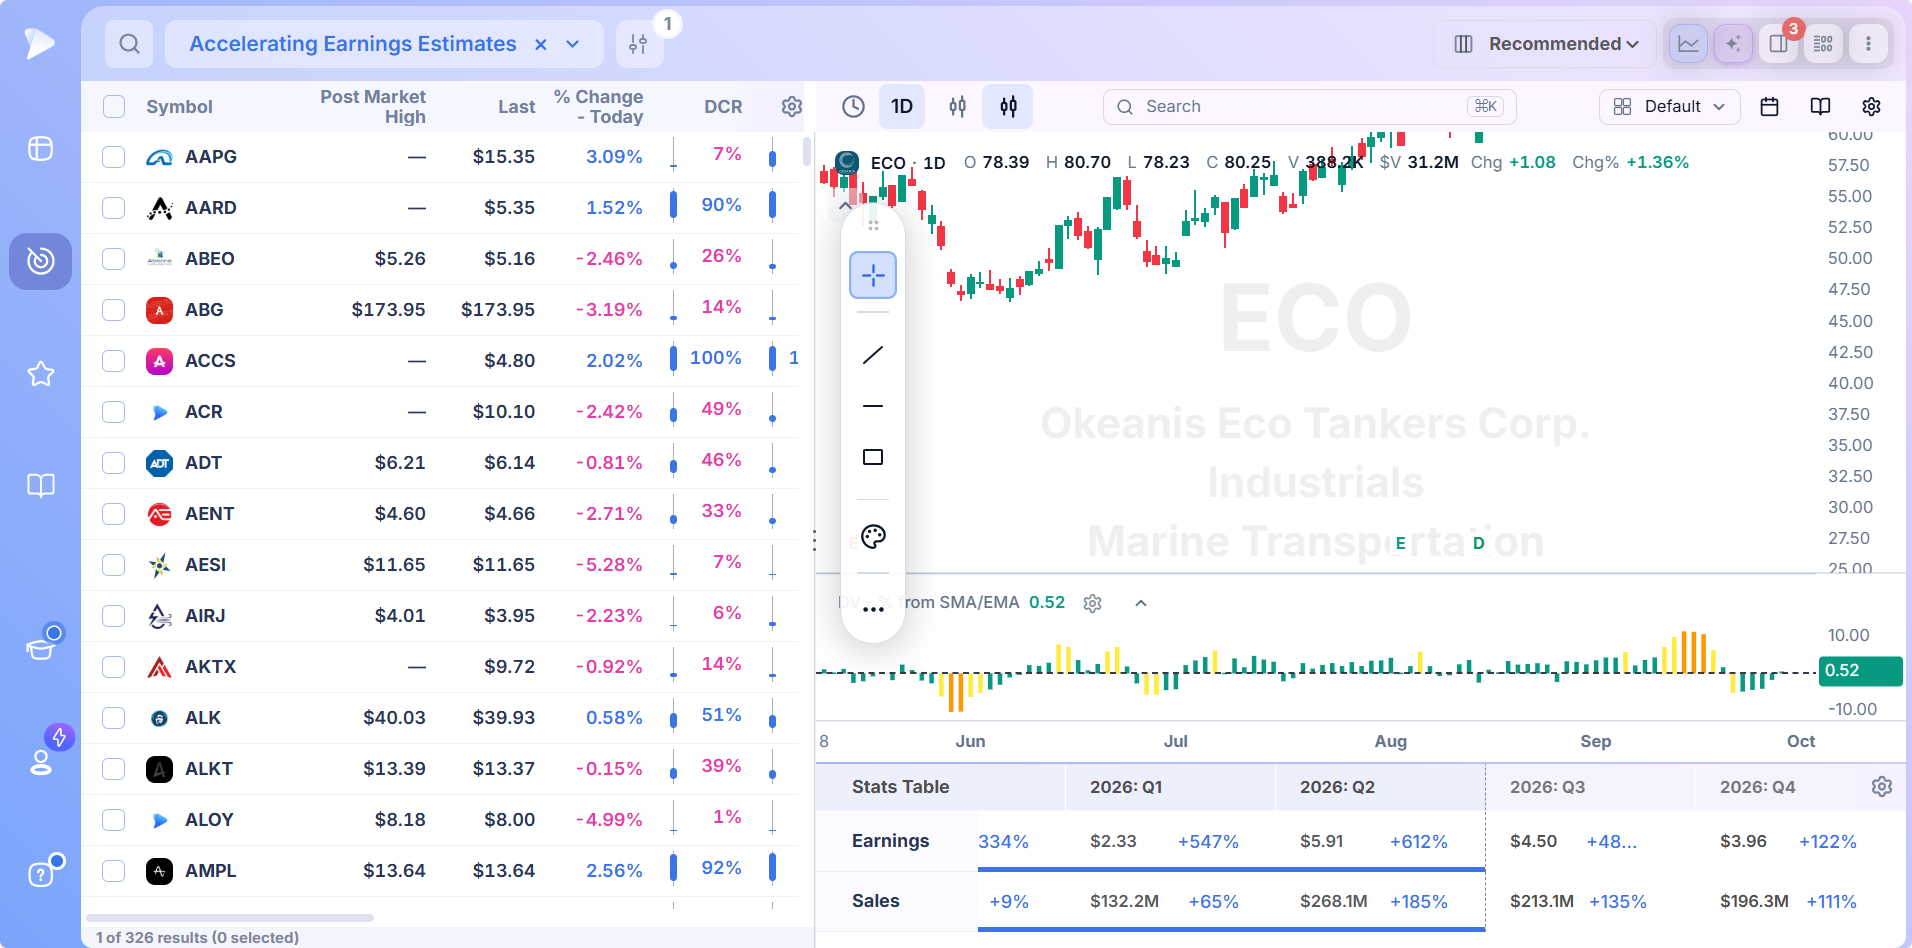
Broad screens like estimate acceleration return a long list, which is expected: plenty of companies see estimates move up in a given month. The closing range and percent change columns help sort it, and a technical condition added to a copy cuts it to the names already acting well.
Fundamentals and Price in the Same Screen
Every field in Deepvue, fundamental, earnings, sales, ownership, rating and technical, is available in one condition builder. That is what makes a preset like Earnings Acceleration & Uptrend possible, and it is what lets you add a trend line or leadership requirement to any fundamental screen you copy. The result is a list of strong businesses in strong charts, which is the only list a growth trader acts on.
Ratings That Summarize the Quarterlies
For a faster read, Deepvue’s own EPS Rating condenses a company’s earnings growth and stability into a single score compared against every other stock. It works as a condition, a floor of 80 or 90 is common, and as a column for ranking any fundamental list. Ownership has its own depth too: the institutional ownership guide explains how fund counts and sponsorship changes are read.
From Report to Position
Names worth keeping move onto a watchlist by right clicking the row, where they wait for a setup. An alert at the pivot or at a key moving average handles the waiting, and once it fires the position size calculator works out the share count from your entry and stop.
How to Build Your Own Fundamental Screen
The presets each test one idea. Most growth traders run a saved screen that combines three or four of them.
Start from the preset nearest your method, such as Accelerating Earnings, and save a copy.
Set a minimum quarterly EPS growth rate, then require it to be higher than the prior quarter’s.
Add a sales growth floor so the earnings gains are backed by revenue rather than cost cuts.
Add one forward looking condition: rising estimates or a recent positive surprise.
Add one technical condition, such as price above a rising 50 day average, so every name left is one buyers are already supporting.
Require enough average dollar volume to trade your size, then save the screen into a folder for daily use.
The AI Terminal builds the same thing from plain English: “quarterly EPS growth above 25% and accelerating, sales up at least 20%, estimates rising, above the 50 day” produces the full condition set, editable before you save it.
How to Trade the Stocks a Fundamental Screen Finds
A fundamental screen tells you what to own. It says nothing about when, and handling that gap is most of the skill.
Let the Chart Pick the Day
A company with accelerating earnings can keep falling for months if the market is correcting or the stock is working off an old top. Put every fundamental candidate on a list and wait for a proper base and a breakout on volume, or a pullback to a rising average in an established uptrend. The fundamentals decide whether you want the stock. The chart decides whether you want it today.
Plan Around the Next Report
Growth stocks make their largest single day moves on earnings. A fundamental position entered a few days before a report carries that risk at full size. Common practice is to enter early enough to build a cushion before the report, or to hold a smaller position through it and add afterward if the numbers and the reaction are both strong.
Sell When the Story Changes
Deceleration is the fundamental sell signal. One slower quarter can be noise; two in a row, especially with sales slowing alongside, usually means the growth phase is maturing and the stock will be repriced lower. Watch the stats table after each report. The row that first showed acceleration is the same row that shows it ending.
Fundamental vs Technical Analysis: Which Screen Comes First?
Both, in sequence. The argument between the two camps is mostly about investors with different time horizons; growth traders settled it long ago by using fundamentals to choose the stock and technicals to choose the entry. The question is only which filter runs first.
- •Fundamentals first suits position traders who hold for months and want a short list of the best businesses, checked against the chart once a week.
- •Technicals first suits swing traders who start from the day’s setups and use the stats table to drop names with weak numbers.
The technical stock screener covers the chart side with fifteen presets of its own.
When a Fundamental Result Should Be Ignored
Numbers can pass a screen and still be the wrong numbers. Look past the result when:
- •The comparison is too easy. Growth of 200% off a quarter that earned two cents is arithmetic, not momentum. Check the dollar figures in the stats table.
- •Earnings grew and sales did not. Cost cuts and buybacks lift EPS for a few quarters. Without revenue behind it, the growth has a ceiling.
- •A one time item did the work. A tax benefit or asset sale inflates a single quarter. If the jump has no follow through in estimates, treat it with suspicion.
- •The chart disagrees. Great numbers in a stock making lower lows means the market knows something, or simply is not interested yet. Either way, wait.
- •Nobody can buy it. A tiny company with superb growth and minimal dollar volume will never draw the institutional demand that drives a growth stock higher.
Who Gets the Most From These Screens
- •Earnings first traders who want the accelerating names found for them after every report
- •Position traders holding through several earnings cycles who need the quarterly trend in view at all times
- •Swing traders who want a quality filter on their technical lists
- •Anyone who has outgrown valuation based screeners and needs growth, surprise and sponsorship fields instead
- •Traders studying how to find growth stocks who want the textbook criteria as working screens
Pricing
$49 a month for a single plan with nothing held back.
- •All sixteen Fundamental presets plus every other category, each one editable after you copy it
- •159 fundamental, 227 earnings, 126 sales and 84 ownership fields, usable as conditions and as columns
- •A stats table under every chart, with quarterly earnings and sales growth in one row each
- •Watchlists and alerts, so a candidate found during earnings season is tracked until its setup appears
MarketSurge, the other platform built for growth stock research, is $149 a month.
New accounts include a setup call, introductory emails and weekly webinars that each take one module apart.
Read the Numbers Before the Market Does
Every quarter, a few hundred companies report numbers that change what they are worth. Most traders hear about them weeks later, when the chart has already moved. A fundamental stock screener reads every report as it lands and hands you the companies whose growth is speeding up, so your watchlist holds tomorrow’s leaders while they still look like ordinary stocks.
More approach based screens are grouped at stock screener by strategy. For chart formations, see stock screener by pattern; for single readings, stock screener by indicator; for the traders behind the presets, stock screener by trader; and for scans tied to the session, stock screener by market timing.
Browse the Fundamental presets
↑ Back to contentsFrequently Asked Questions
What is a fundamental stock screener?
A fundamental stock screener is a tool that searches every listed company by its financial results, such as earnings growth, sales growth, estimate revisions, surprises and ownership, and returns the ones meeting your conditions. Deepvue’s version ships sixteen growth focused presets and 596 fundamental, earnings, sales and ownership fields.
What is a good stock screener for fundamental analysis?
A good stock screener for fundamental analysis covers growth and acceleration rather than only valuation, updates as companies report, and shows the quarterly numbers next to the chart. For growth traders, Deepvue fits all three at $49 a month, with sixteen fundamental presets and a stats table under every chart.
How do you check if a stock is fundamentally strong?
You check if a stock is fundamentally strong by looking at quarterly EPS and sales growth against the same quarter a year earlier, whether those rates are accelerating, how results compared with estimates, and whether institutional ownership is rising. Deepvue shows the first three in the stats table under each chart.
What is better, fundamental or technical analysis?
Neither fundamental nor technical analysis is better on its own for growth stocks; they answer different questions. Fundamental analysis tells you which companies are worth owning, and technical analysis tells you when the market agrees. Most successful growth traders screen with both, which is why Deepvue keeps both in one condition builder.
What is an example of fundamental analysis?
An example of fundamental analysis is comparing a company’s quarterly EPS growth over time: if growth went from 18% to 34% to 61% across three quarters while sales rose 40%, the business is accelerating. Deepvue’s Accelerating Earnings preset screens for that pattern across every stock.
Which fundamental screens does Deepvue include?
Deepvue’s Fundamental category includes Accelerating Earnings, Accelerating Earnings Estimates, Accelerating Sales, Accelerating Sales Estimates, Big Earnings Surprise, Big Sales Surprise, Earnings Acceleration & Uptrend, EPS/Sales Growth 30/30, Founder Lead, Increasing Insider Ownership, Increasing Institutional Ownership, New CEO, Sales Leaders and Top Fundamentals, among sixteen presets.
What does the Big Sales Surprise screen look for?
The Big Sales Surprise screen looks for stocks that beat revenue estimates by more than 50% in the latest reported quarter and by more than 25% for the latest reported year. Beats that large usually lead to upward estimate revisions over the next few quarters.
What is earnings acceleration?
Earnings acceleration is a quarterly EPS growth rate that is higher than the previous quarter’s rate, such as growth rising from 20% to 35%. Growth traders rank it near the top of their checklist because it tends to come before heavy institutional buying. Deepvue screens for it with two separate presets.
Why screen for founder led companies or a new CEO?
Screening for founder led companies finds businesses run by the people who built them, who often reinvest aggressively for growth. Screening for a new CEO finds companies where strategy may be about to change. Deepvue ships both as presets, and each works best paired with a growth condition.
Is there a free fundamental stock screener?
Free fundamental screeners exist, but most focus on valuation fields, update with a delay and offer few growth measures such as acceleration or estimate revisions. Deepvue costs $49 a month and includes sixteen fundamental presets, streaming data and quarterly results beneath every chart.
Can a fundamental screen include technical conditions?
Yes, a fundamental screen can include technical conditions in Deepvue, since earnings, sales, ownership, ratings and chart fields all share one builder. The Earnings Acceleration & Uptrend preset already does this, and any copied fundamental preset can take a trend or RS Rating requirement.
Can I edit the fundamental presets?
Yes, the fundamental presets become editable once you save your own copy, and the original keeps its shipped definition. The usual edits are a higher growth floor, an added sales or estimate condition, a technical filter and a minimum dollar volume.