The Stage 2 Stock Screener Built on Stan Weinstein’s Method
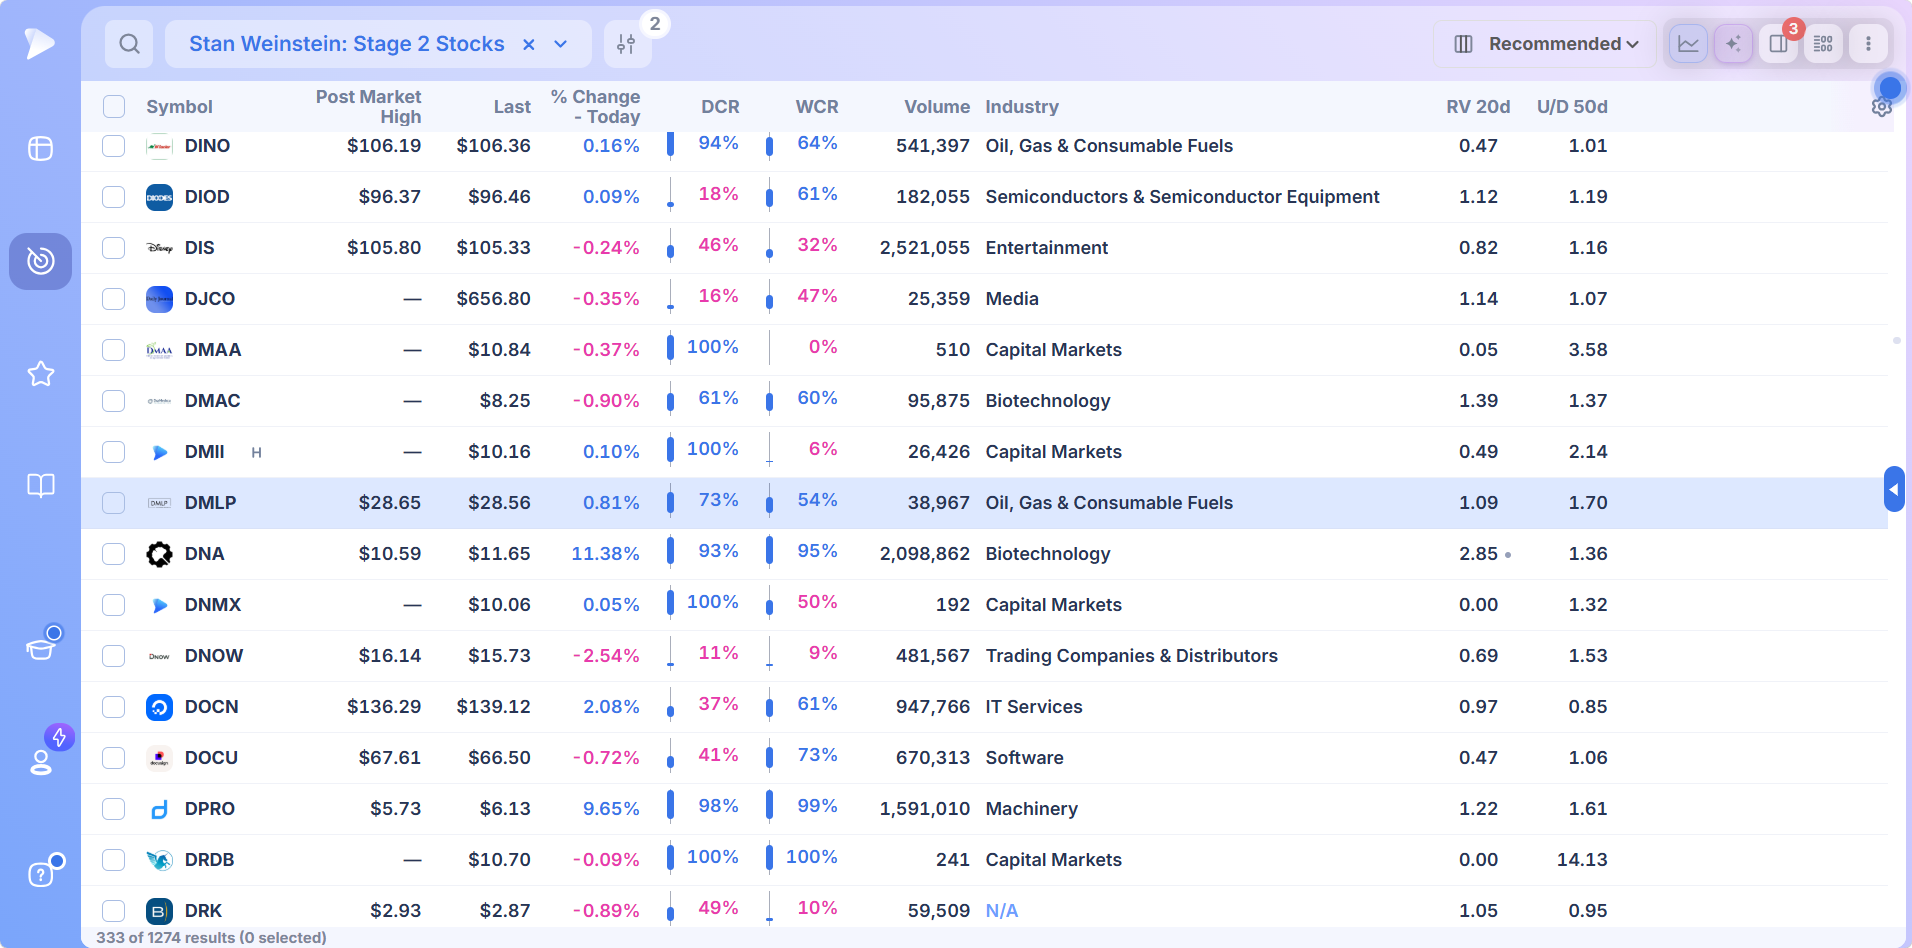
Stan Weinstein divides every stock’s life into four stages, and Stage 2 is the only one worth owning: price above rising long term moving averages after a breakout from a base, with institutions accumulating. Deepvue’s stage 2 stock screener is filed under Top Traders and returns stocks and ADRs advancing in Stage 2 structural uptrends, colors the stage on every chart, and shows it as a column. $49 a month.
Key Takeaways
Go back through the biggest winners of any year and check what stage they were in when the move happened. Almost every one was in a Stage 2 uptrend. Now check the stocks that lost 80% or more in the same period, and almost every one was in Stage 4. That single observation is the whole case for stage analysis, and it’s why Weinstein’s 1988 book is still on the desk of traders who run very different styles.
The hard part has never been the theory. It’s checking the stage of a few thousand stocks before the open. Deepvue’s screener does that with the Stan Weinstein Stage 2 Stocks preset, so the universe is already reduced to names with the wind at their back before you look at a single chart.
- ✓Stage 2 is the advancing phase: price above rising long term averages after a volume breakout from a Stage 1 base
- ✓The stages are set by the 10 week and 40 week moving averages in Deepvue, which map to the 30 week line in Weinstein’s book
- ✓Stage analysis is fractal, so the same read works for a two day trade and a two year hold
- ✓Weinstein wants leading stocks in leading groups, not just any stock in Stage 2
- ✓The exit is Stage 3: lower highs, the moving averages undercut, and the indicator turning from green to yellow
- ✓The preset, the stage indicator, the stage column and the alerts are all included at $49 a month
What Is a Stage 2 Stock?
Stan Weinstein published Secrets for Profiting in Bull and Bear Markets in 1988, and its central idea has outlived most of what was written about markets that decade. Every stock, index and commodity moves through a repeating four stage cycle driven by whether large institutions are accumulating or distributing shares. Read the cycle correctly, which is all Stan Weinstein stage analysis asks, and you own stocks while the institutions are buying and stand aside while they sell.
The read is done on a weekly chart against a long term moving average. Weinstein used the 30 week line. Deepvue’s implementation tracks the 10 week and 40 week averages, which give an earlier signal and a slower confirmation of the same structure.
| Stage | What price is doing | What it means |
|---|---|---|
| Stage 1: basing | Oscillating sideways after a decline, moving average flattening, sometimes an inverse head and shoulders inside the range | Institutions are quietly accumulating and supply is drying up |
| Stage 2: advancing | Breaks resistance on heavy volume, then trends above rising 10 and 40 week averages with higher highs | Accumulation is now visible, the trend is on, and this is the only stage to be long |
| Stage 3: topping | Momentum fades, lower highs form, price starts undercutting the averages and they flatten | Institutions are distributing into strength |
| Stage 4: declining | Price below declining 10 and 40 week averages, rallies fail at the averages | Distribution has won, and the stock is avoided or shorted |
Why Stage 2 Is the Only Stage to Own
The asymmetry is what makes the method worth following. Stage 2 uptrends in leading names have historically delivered advances of 200% to 300% and more from the breakout. Stage 4 declines in the same names have taken back 80% to 97% of the peak, and they usually start before the fundamentals turn, because the institutions doing the selling have better research than the rest of us. Price action leads the news. A stock in Stage 4 is being distributed no matter how good the story sounds, and there is always a better long somewhere else.
The Cycle Is Fractal
Stage analysis is a description of supply and demand, so it shows up on every timeframe. A position trader reads it on the weekly chart and holds for the long Stage 2 move. A swing trader uses the weekly stage as the backdrop and trades the base breakouts inside it on the daily. Even an intraday trader gets better odds buying a stock that is resuming a Stage 2 uptrend from a well built base than one fighting a Stage 4 decline. The framework doesn’t change with your holding period. Only the chart you execute on does.
Leading Stocks in Leading Groups
Weinstein repeats one qualifier throughout the book: he wants Stage 2 stocks in Stage 2 groups, in a market that is itself in Stage 2. A stock from a theme that peaked years ago can technically enter Stage 2 and still lack the institutional interest to go anywhere, because the money has moved on to whatever is in vogue now. A fresh Stage 2 in a group the market is actively accumulating has far more potential, and that is where the screen should be pointed.
Why Stage 2 Is Simple to Define and Awkward to Screen For
On paper the test is two moving averages and a slope. In practice a screen needs weekly data, both averages rising, price above both, a breakout from a base that actually happened, and enough structure to tell a fresh Stage 2 from a stock that has been in one for two years and is about to roll over. Most daily screeners approximate the first part and ignore the rest, which is how traders end up with a list of five hundred stocks above their 200 day line and call them stage analysis stocks. A stage 2 stock screener has to do better than that.
Why Deepvue Is the Best Stan Weinstein Stage 2 Screener
Deepvue treats Stan Weinstein stage analysis as a first class piece of data. It’s a screen condition, a chart indicator and a table column, all computed the same way, so the stage you filter on is the stage you see on the chart and in the list.
A Stan Weinstein Screener That’s Already Built
Inside the screener, the presets menu opens from the current screen’s name. Switch to Screener Presets and expand Top Traders. Stan Weinstein has his own folder there, and Stage 2 Stocks is the screen inside it built for this job. Selecting it fills the list, and that is the whole setup for a Stan Weinstein screener.
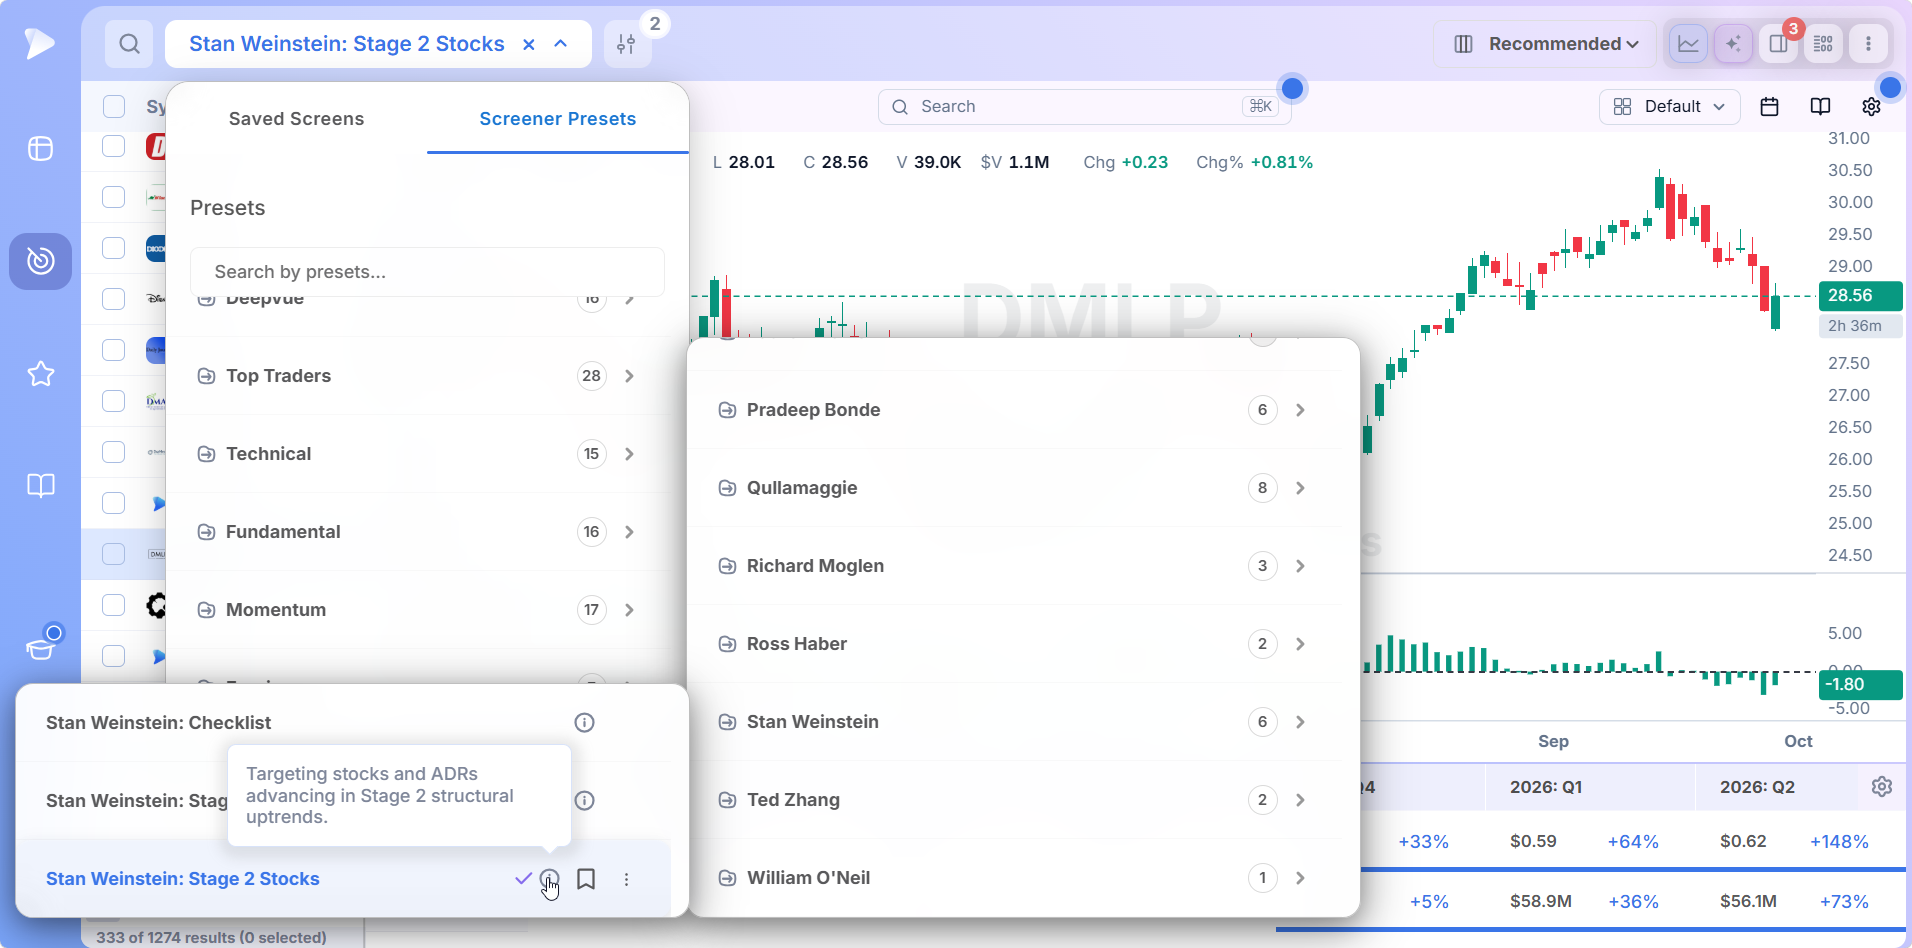
Shipped presets can’t be edited in place, which keeps the definition stable. Copy one and the copy is fully adjustable.
What the Screen Tests
The preset description is short: targeting stocks and ADRs advancing in Stage 2 structural uptrends. Behind that sentence sit the conditions that define the stage, price above rising long term averages with the structure of a completed base behind it, applied only to common stocks and ADRs so every row is an operating company rather than a fund or a warrant.
Note the word advancing. The screen returns stocks that are in Stage 2 now, not stocks about to enter it. The breakout week itself can be caught by adding a volume condition, which the build section below covers, and the very first weeks of a new Stage 2 show up in the indicator as the palest shade of green.
The Indicator Colors the Stage for You
A stage 2 stock screener tells you the stage today. The DV Stage Analysis indicator, added from the chart’s indicators and strategies menu, shades every bar by stage so you can see how it got there. Early Stage 2 is a pale green that deepens as the trend takes hold. Stage 3 shows up as streaks of white and yellow as momentum fades. Stage 4 is red and pink. When the cycle restarts, the colors walk back through Stage 1 and into green again.
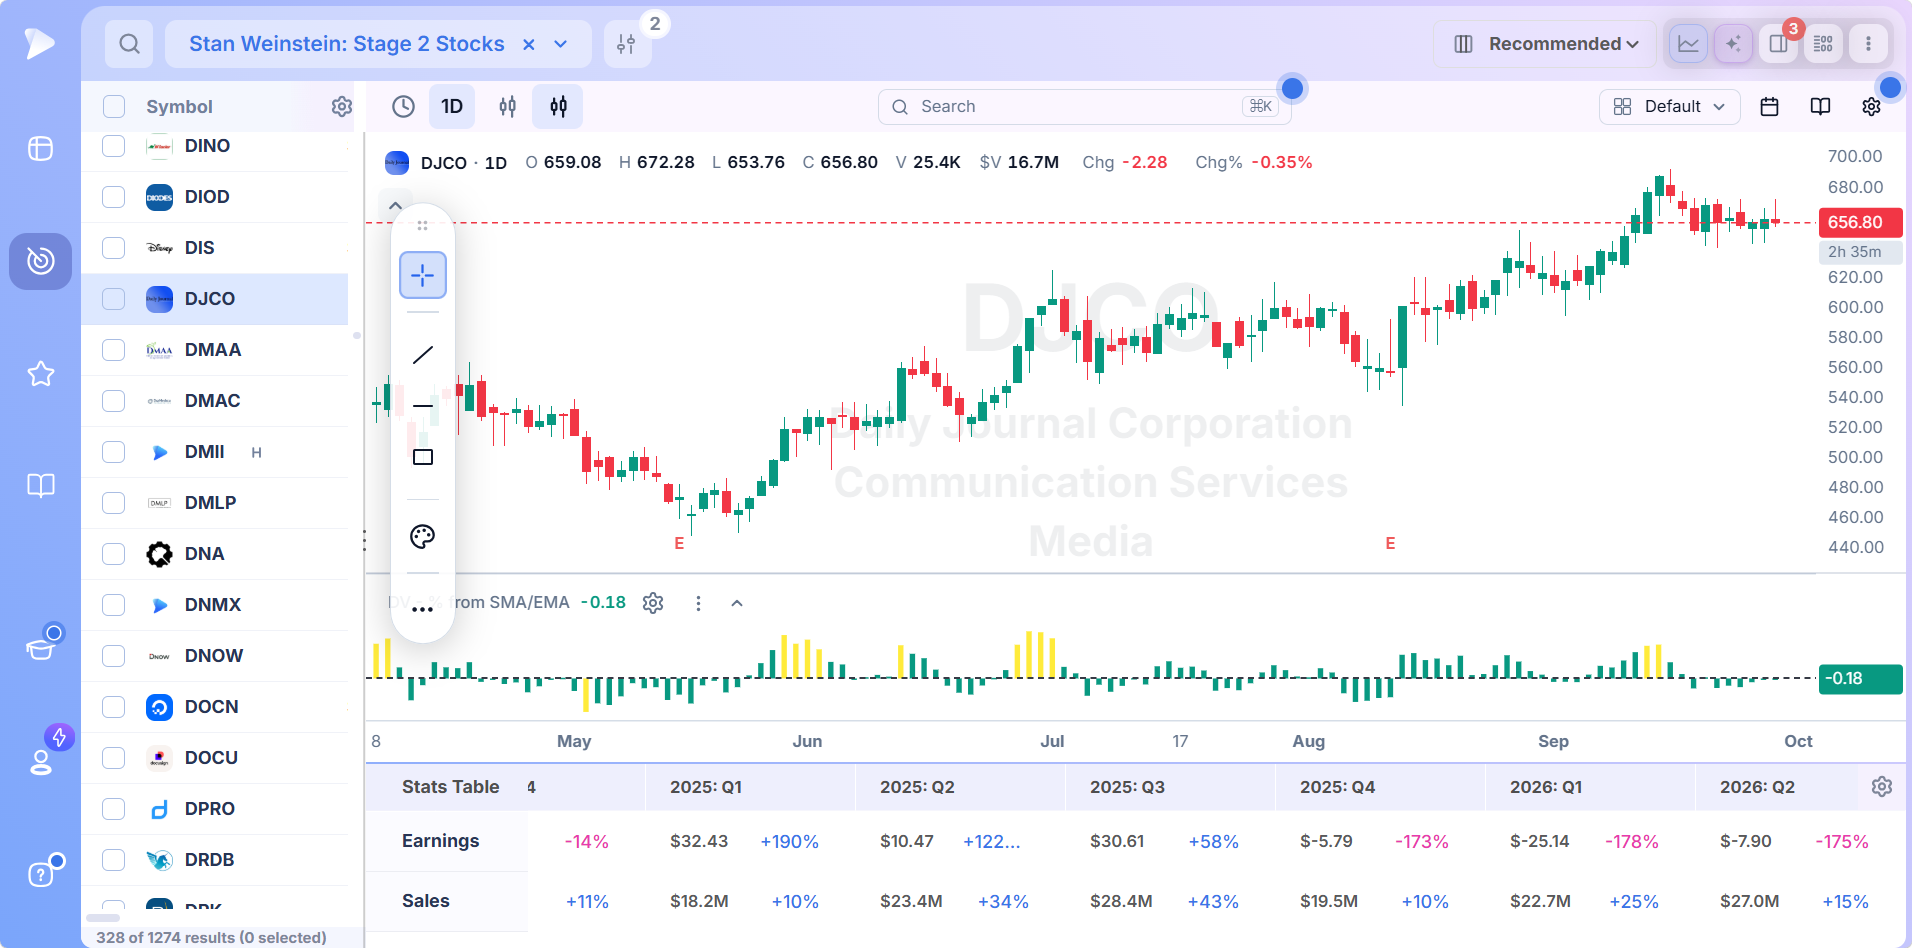
Many traders move the indicator into its own pane beneath the price rather than overlaying it, then space bar through a list. Green, keep looking for an entry on the daily. Red, next name. It turns the stage check into a reflex.
Stage as a Column
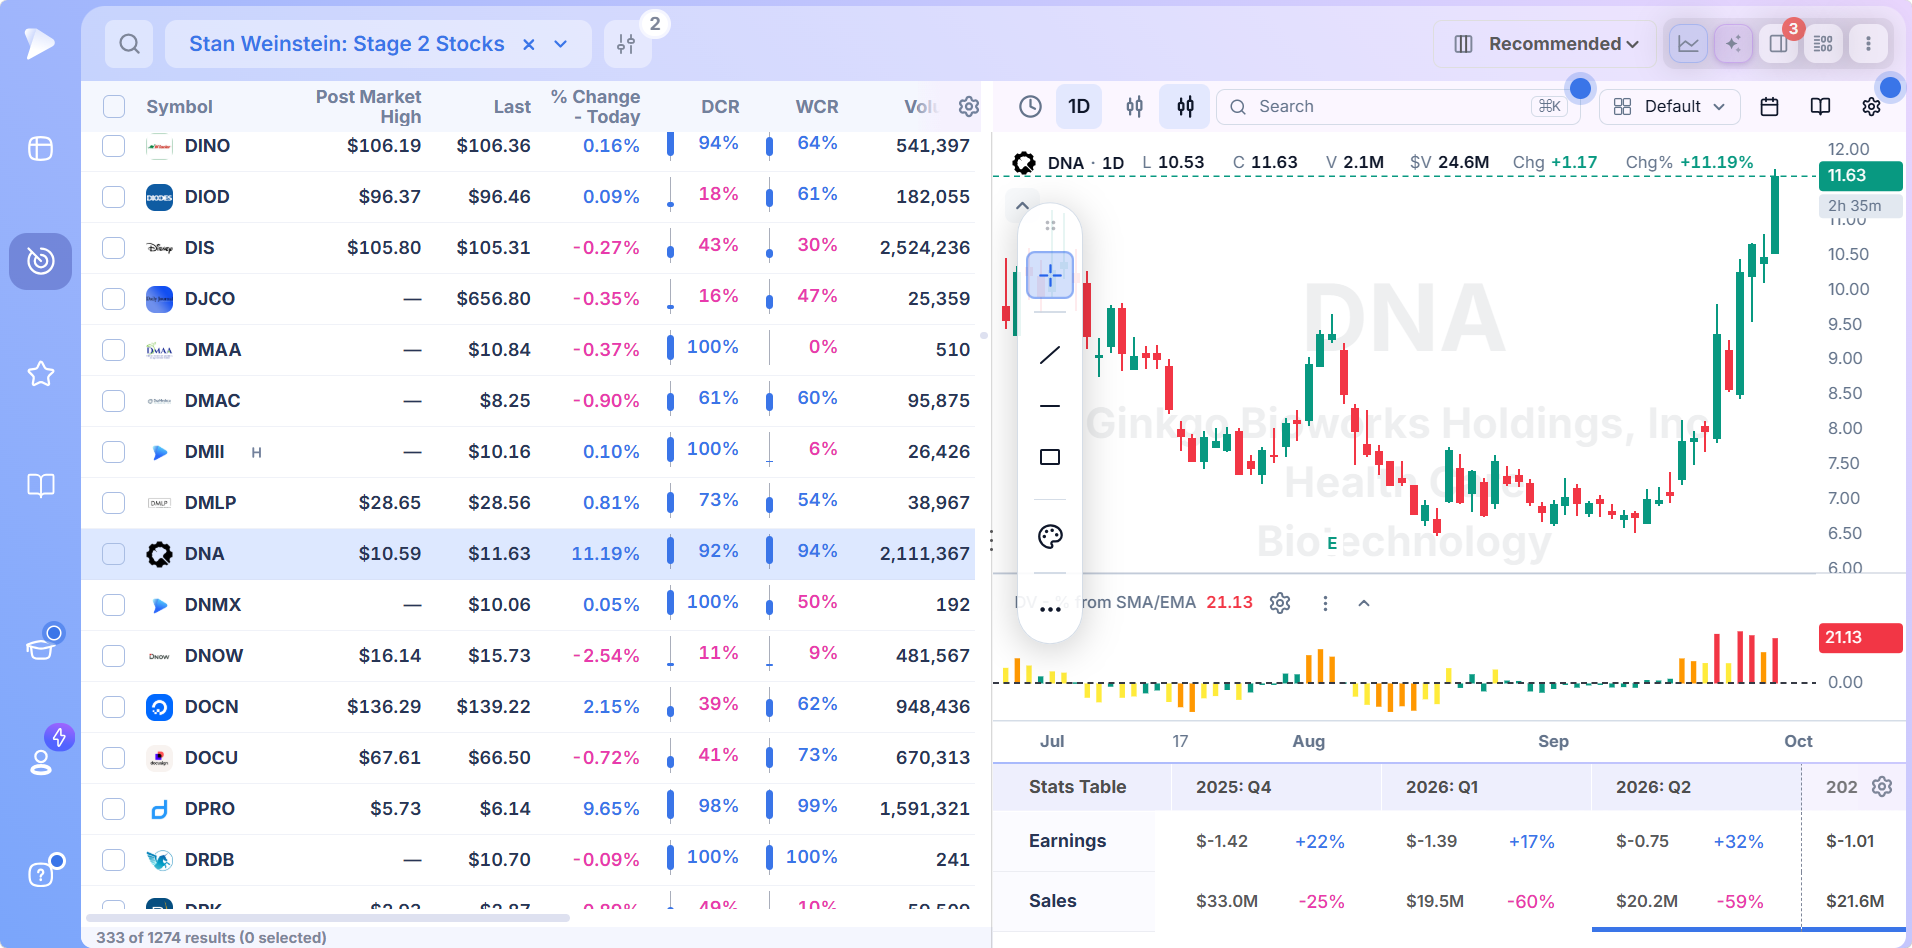
The stage is also available as a data column, so the results list can show it directly beside price. Put closing range, relative volume and the up/down ratio next to it and you have a table that answers the two questions Weinstein cares about in one row: is the stock in Stage 2, and are institutions still buying it there.
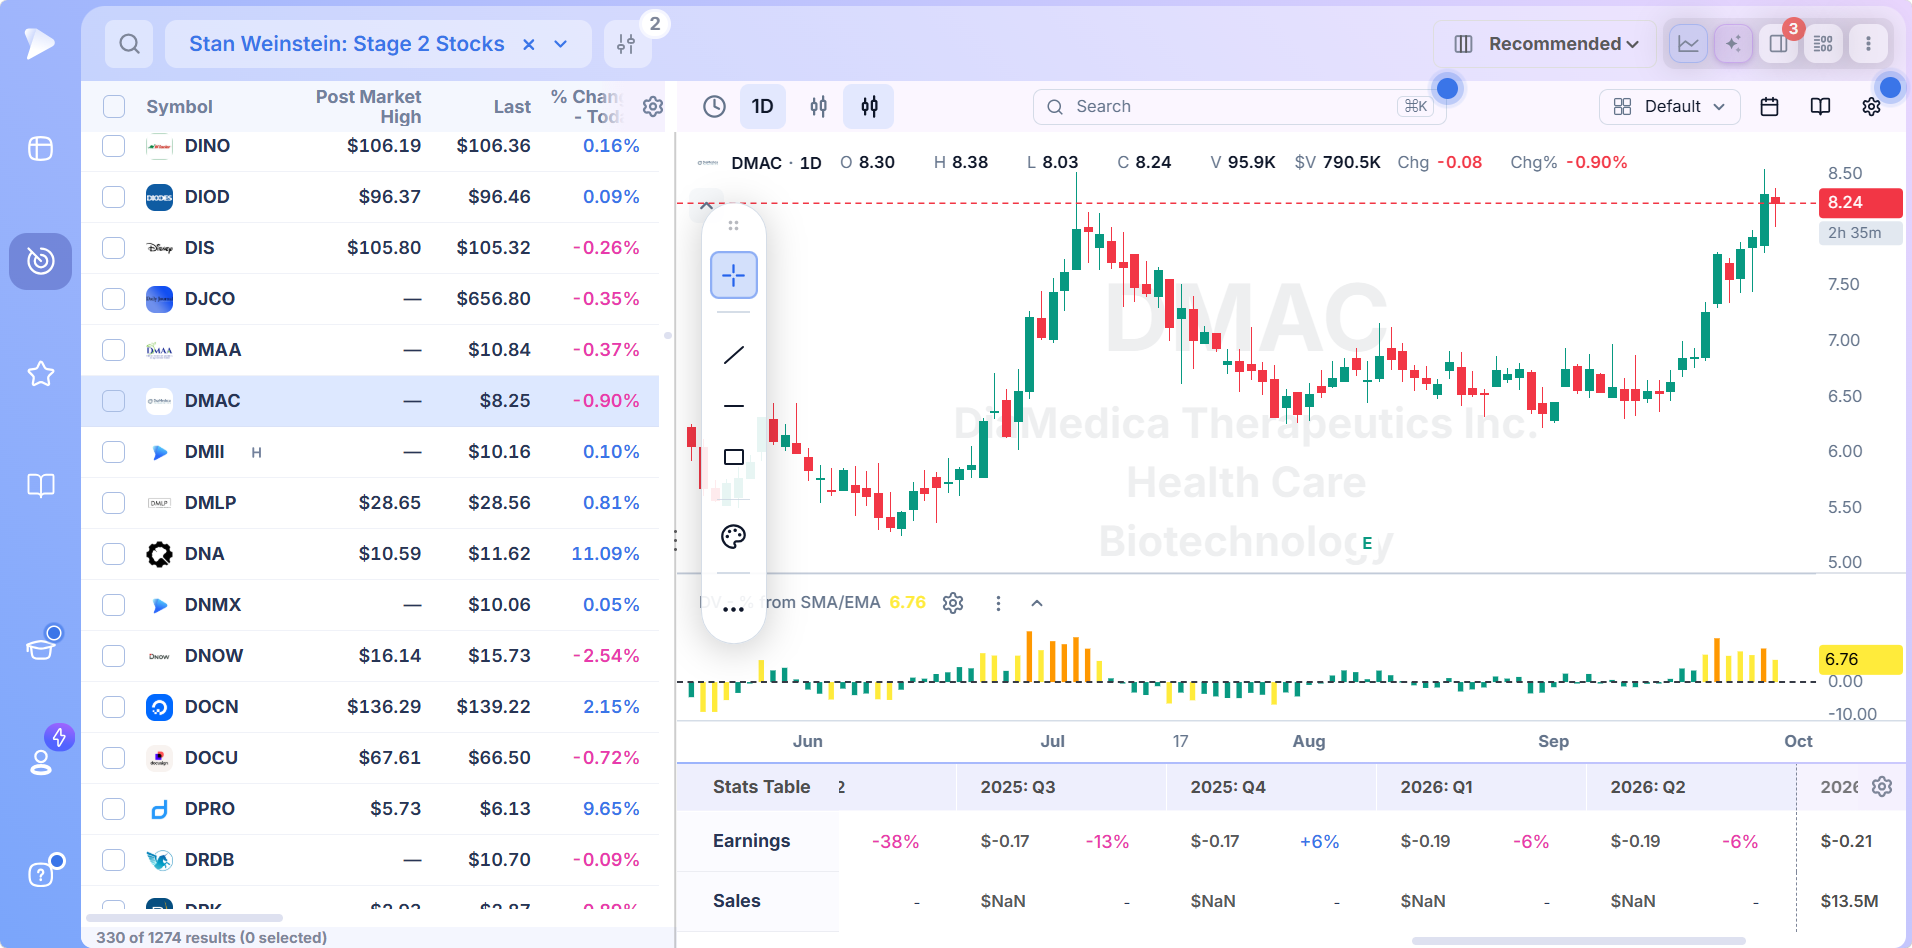
The Chart Beside the List
Every row opens a chart to the right of the list, with the earnings and sales history beneath it. That view is where the second half of Weinstein’s test happens: is this a fresh breakout from a long base or a stock that has been in Stage 2 for eighteen months, and is the group it belongs to leading or lagging.
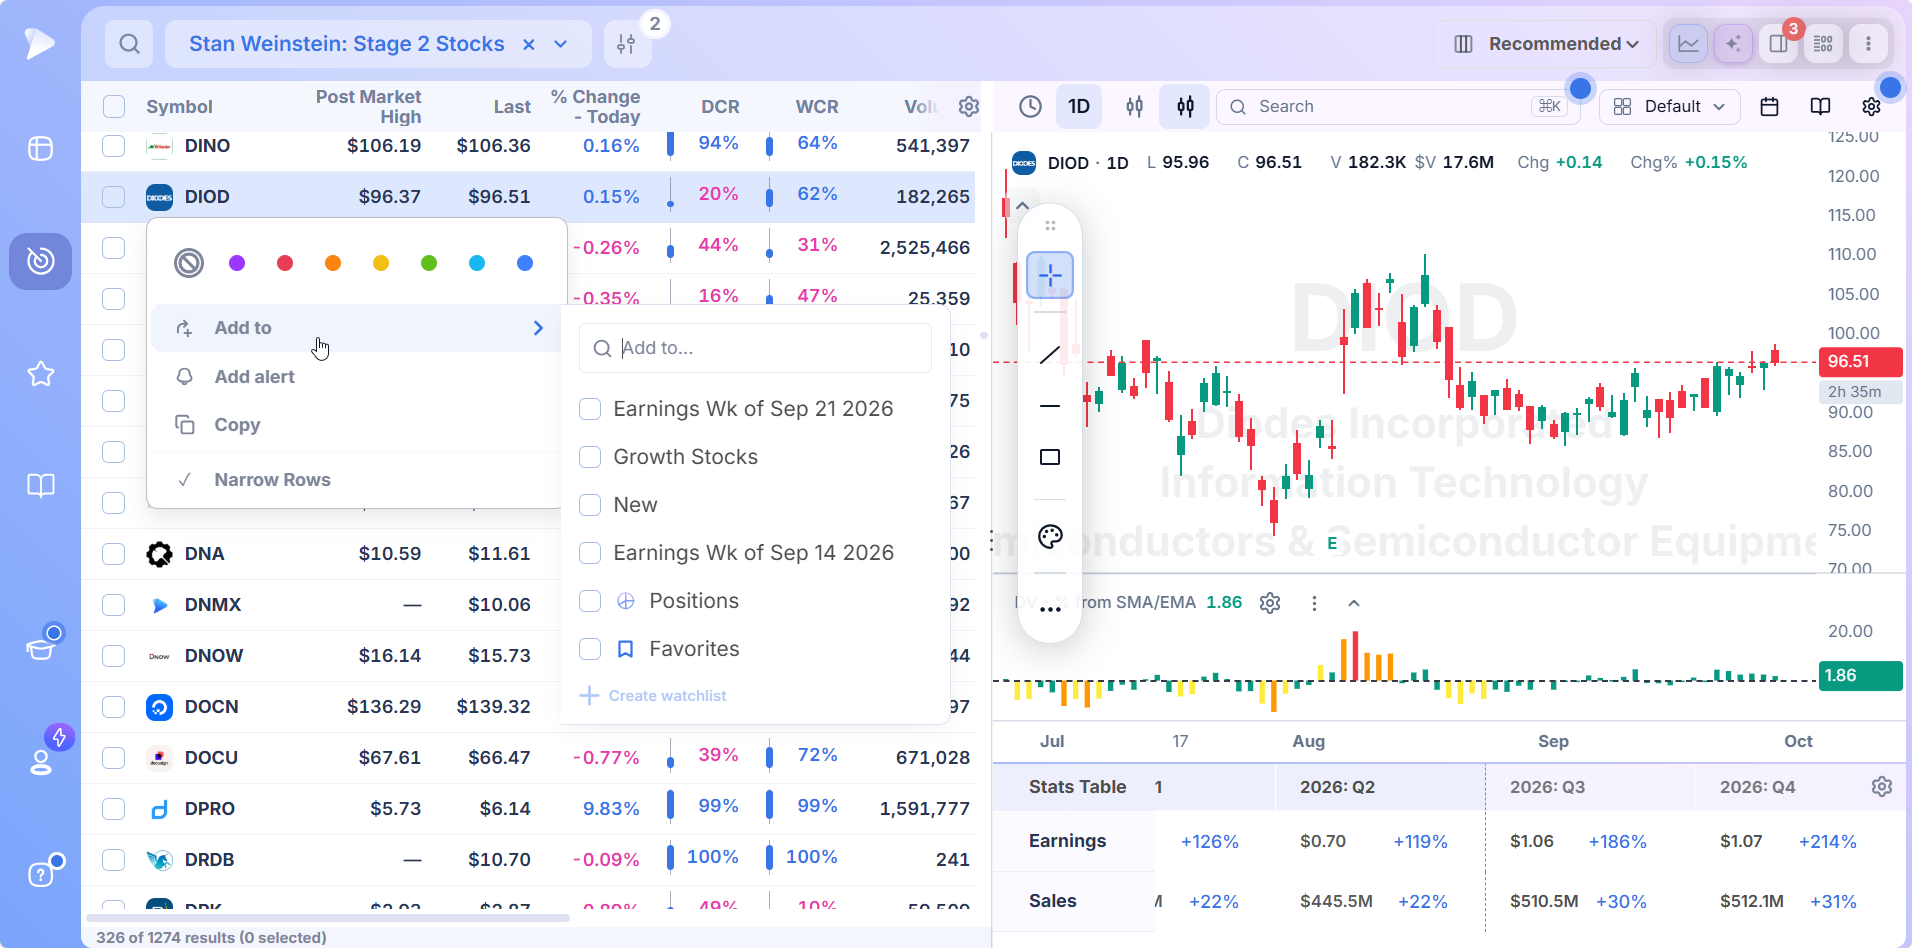
Watchlist and Alerts From the Same Row
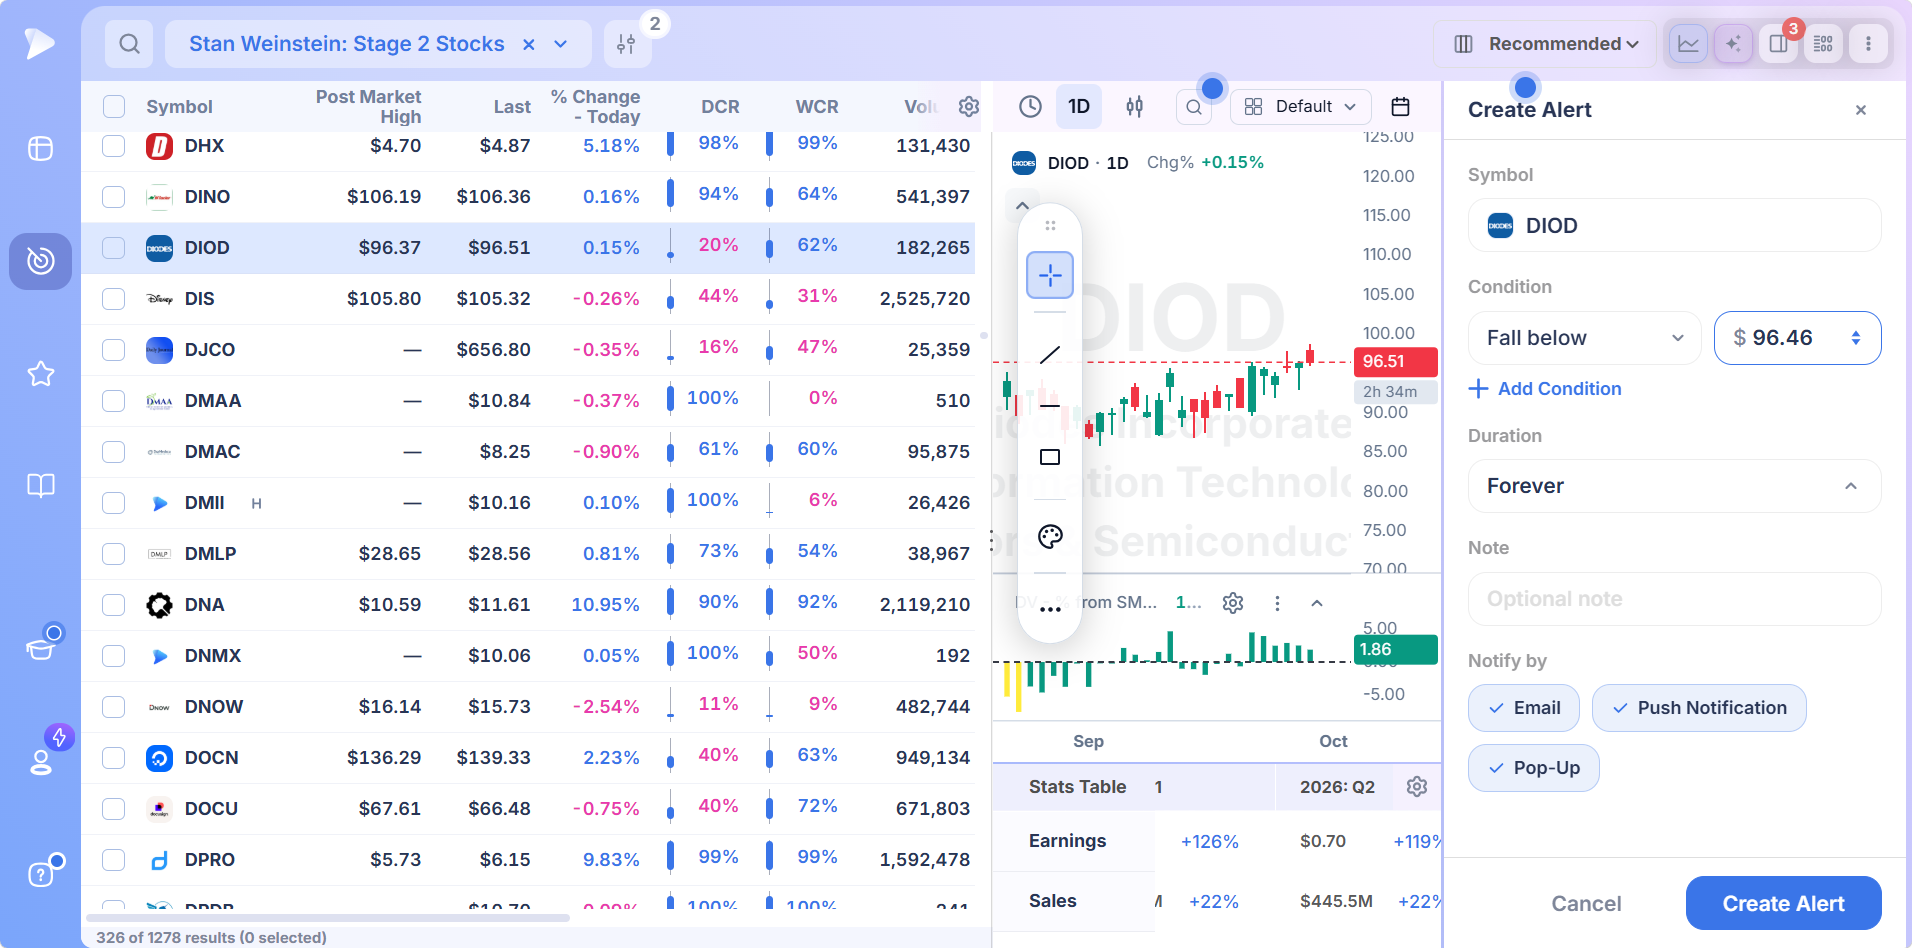
Right clicking a result sends it to a watchlist or brings up the alert builder. For Stage 2 names the useful alerts are a rise above the pivot of the current base, and a fall below the 10 week average, which is the level that tells you Stage 3 may have started.
How to Build Your Own Stage 2 Screener
Weinstein’s method has more rules than the preset applies, on purpose. Copy the preset and layer the rest on.
Copy the Stan Weinstein Stage 2 Stocks preset so its conditions can be edited.
Leave the Stage 2 condition alone. It’s the definition.
Add weekly volume above 200% of average to isolate the stage 2 breakout week, the entry Weinstein prizes most.
Add a maximum distance above the 10 week moving average, so extended names that have run far from the line drop out.
Add a relative strength or industry group rank condition to keep the leading stocks in leading groups.
Set a dollar volume floor and save the screen under your own name.
The AI Terminal accepts the whole thing as a sentence, “Stage 2 stocks breaking out this week on double average volume in a top ranked industry group”, and hands back the conditions ready to edit.
How to Trade a Stage 2 Stock
Weinstein’s buy and sell rules are simpler than most systems, which is part of why they have lasted. The stage tells you whether to be involved. The base tells you where.
The Breakout Into Stage 2
The ideal entry, the stage 2 breakout, is the week price clears the top of a Stage 1 base on volume well above average, with the 30 week line, or the 10 and 40 week lines in Deepvue, starting to turn up beneath it. That is the moment accumulation becomes public.
Missed it? Stage 2 uptrends form new bases along the way, and each breakout from one is a continuation buy point with the same logic on a smaller scale. Swing traders live on those. Position traders use them to add.
Where the Stop Goes
Below the 10 week moving average for active traders, or below the 40 week for investors willing to sit through more noise for the longer move. Weinstein himself preferred to hold as long as the stock respected the shorter line. The position size calculator converts the distance to that line into a share count, and a fall below alert makes sure you hear about it the week it happens.
Selling When Stage 3 Arrives
The exit signal is the transition, not the top. Lower highs appear, the stock closes under the 10 week line for the first time in months, the average flattens, and on the indicator the green gives way to yellow and white. Active traders sell some or all on that first undercut. Longer term holders may wait for a confirmed Stage 4 to capture the full move, accepting a bigger giveback for the chance the trend resumes. Either way the decision is made by the chart, not by the news, which almost always turns after the stage already has.
Stage 2 Screen, Stage Analysis Screener or Breakout Scan?
Deepvue has three related ways in, and they answer different questions:
- •The Stage 2 Stocks preset. Which stocks are in the advancing stage right now? A universe filter, the backdrop for everything else.
- •The stage analysis screener. Where is every stock in the four stage cycle, including Stage 1 bases forming and Stage 4 names to avoid or short?
- •Breakout scans. Which stocks are clearing a base today? The entry timing, best run against a Stage 2 filtered list.
The stage analysis screener walks through all four stages, and when to buy with stage analysis goes deeper on Weinstein’s entry rules. The base and breakout scans are gathered under stock screener by pattern.
When a Stage 2 Stock Should Be Ignored
Stage 2 is necessary and it isn’t sufficient. These pass the screen and still belong on the pass list.
- •Extended above the line. A stock 40% above its 10 week average is in Stage 2 and has no reasonable stop. Wait for a base.
- •A low volume breakout. If the move out of Stage 1 came on ordinary volume, the institutions weren’t there and the breakout is more likely to fail.
- •A lagging group. Stage 2 in a sector nobody is accumulating tends to be short and shallow. Weinstein’s rule about groups is not optional.
- •Late in the stage. The deepest green on the indicator is the trend at full strength, and it’s also the closest to Stage 3. Prefer the paler shades and fresh bases.
- •A market in Stage 4. Individual Stage 2 stocks exist in bear markets, and most of them fail. Check the index first.
Who Gets the Most From This Screen
- •Position traders and investors who want to hold the long move and need the stage as their master filter
- •Swing traders who trade daily breakouts and want the weekly backdrop to stack the odds
- •Readers of Weinstein’s book who have been checking stages by hand on a chart at a time
- •Anyone who keeps buying good stories in Stage 4 and wants a rule that stops them
- •Traders who want the exit defined by the chart before the news catches up
Pricing
$49 a month on a single plan, nothing gated.
- •The Stage 2 Stocks preset and the other 168, all editable in a copy
- •The stage as a screen condition, a chart indicator and a table column, computed once and shown everywhere
- •Weekly and daily charts plus lists, alerts and layouts that stay saved, so the fall below alert at the 10 week line is a one time setup
- •Live data during the session, with 568 fields streaming
The comparable platform, MarketSurge, is $149 a month.
New accounts include a setup call, introductory emails and weekly webinars that each take one module apart.
Own Stage 2, Avoid Stage 4, Ignore the Rest
Weinstein’s method reduces a market of thousands of opinions to one question per stock: who is in control, the buyers or the sellers? A stage 2 stock screener built on his rules answers it for the whole market at once, and the indicator keeps answering it on every chart you open afterward.
The other Top Traders presets, Weinstein’s among them, are indexed at stock screener by trader. Session based screens such as the premarket scan have their own home at stock screener by market timing, and screens organized around a trading approach are gathered at screener by strategy.
Run the Stage 2 screen on tonight’s close
↑ Back to contentsFrequently Asked Questions
What is Stage 2 in stocks?
Stage 2 in stocks is the advancing phase of Stan Weinstein’s four stage cycle: price has broken out of a base on heavy volume and is trending above rising long term moving averages while institutions accumulate. Deepvue screens for it with the Stan Weinstein Stage 2 Stocks preset.
How do you tell if a stock is in Stage 2?
You tell if a stock is in Stage 2 by checking a weekly chart: price above the 10 week and 40 week moving averages, both averages rising, and a completed breakout from a base behind it. Deepvue’s stage indicator shades those bars green, and the stage is available as a column.
What is a Stage 4 stock?
A Stage 4 stock is one in the declining phase: price below falling 10 week and 40 week moving averages, with rallies failing at the lines as institutions distribute. Weinstein’s rule is to avoid or short them regardless of the story. Deepvue’s indicator marks Stage 4 in red and pink.
What are the four stages of the stock market cycle?
The four stages of the stock market cycle in Weinstein’s framework are Stage 1 basing, Stage 2 advancing, Stage 3 topping and Stage 4 declining, defined by price against a long term moving average and its slope. Deepvue computes the stage for every stock and lets you screen, chart and sort on it.
Which moving average does Stan Weinstein use?
Stan Weinstein uses the 30 week moving average on a weekly chart to define the stages. Deepvue’s implementation uses the 10 week and 40 week averages, which bracket the same structure with an earlier signal and a slower confirmation. Weinstein preferred to stay in a stock while it held the shorter line.
What does the Stan Weinstein Stage 2 screener on Deepvue test?
The Stan Weinstein Stage 2 screener on Deepvue tests for stocks and ADRs advancing in Stage 2 structural uptrends, meaning price above rising long term averages with a completed base behind it, restricted to operating companies. Copy the preset to add volume, distance or group conditions.
How do you find Stage 2 stocks?
You find Stage 2 stocks by screening for price above rising 10 week and 40 week moving averages on the weekly chart, then confirming the breakout and the group on the chart. Deepvue’s preset does the first part across the whole market, and the chart next to each row handles the second.
When should you sell a Stage 2 stock?
You sell a Stage 2 stock when Stage 3 begins: lower highs, a first close under the 10 week average, the average flattening and the indicator turning from green to yellow. Active traders act on the first undercut. Longer term holders may wait for Stage 4 to confirm. A Deepvue fall below alert flags the undercut.
Can I see the stage as a column in the screener?
Yes, you can see the stage as a column in the Deepvue screener by adding it from the column picker, so the results list shows the stage beside price, closing range and relative volume. The same calculation drives the DV Stage Analysis chart indicator.
What is Stan Weinstein’s book?
Stan Weinstein’s book is Secrets for Profiting in Bull and Bear Markets, published in 1988, which introduced stage analysis and the rule of buying only Stage 2 stocks in Stage 2 groups. Deepvue’s Stage 2 Stocks preset and stage indicator are built around that framework.