The Green Line Breakout Screener for Stocks Breaking to All Time Highs
A green line breakout screener finds stocks clearing an all time high that has held for at least three months, on above average volume. The method comes from Dr. Eric Wish. Deepvue’s Dr. Wish: Green Line Breakout preset runs the green line logic and the volume check in one click, so each breakout shows up the day it happens. $49 a month.
Key Takeaways
Most breakouts still have sellers overhead: holders who bought higher and want their money back. A stock at an all time high has none. Every share traded above the old peak is price discovery, and the buyers pushing it there are often institutions building positions they plan to hold.
The hard part is catching the day it happens. Deepvue’s screener ships Dr. Wish’s rules as a ready preset, so stocks crossing their green line land on your list instead of in your hindsight.
- ✓A green line is an all time high the stock hasn’t closed above for at least three months
- ✓The breakout comes when price clears that line on above average volume
- ✓Draw and count the line on a monthly chart, then time entries on the daily
- ✓A close back below the green line invalidates the breakout
- ✓All time highs carry no overhead supply, which is why Dr. Wish prefers them to 52 week highs
- ✓$49 a month covers the preset, the chart tools and the alerts
What Is a Green Line Breakout?
A green line breakout (GLB) is a stock breaking to a new all time high after resting at least three months below its previous peak. Dr. Eric Wish, who has traded for more than 50 years and has taught stock market and technical analysis courses at the University of Maryland since 2006, popularized it on his Wishing Wealth blog. His class is where a member of the Deepvue team first learned to trade.
| Rule | What it means |
|---|---|
| A new all time high | Higher than any price in the stock’s history, not just the past year |
| At least three months of rest | Three monthly bars that fail to close above that high |
| The green line | Drawn at the high of the peak month once the rest is complete |
| A breakout on volume | Price clears the line on volume well above average |
| It holds | A close back below the line cancels the setup |
Dr. Wish adds two preferences. He likes the stock to have doubled from its lowest price over the prior year, though he doesn’t require it, especially for IPOs. And he only buys stocks trading above their last green line.
Why Stocks at All Time Highs Behave Differently
What is price discovery? It’s the market setting a price with no trading history above to anchor it. Below an old high, every rally runs into trapped holders selling at breakeven. Above it there are none, which is why traders call a clean break into new territory a blue sky breakout. Jesse Livermore made the same point about new highs decades before Dr. Wish.
The long rest matters too. Three months or more of sideways action gives institutions time to accumulate, and in Dr. Wish’s experience, green line breakout stocks often go on to make a series of new highs.
How to Draw the Green Line
The line is drawn on a monthly chart, where the three month rest is easy to count:
Find the latest monthly bar that set a new all time high.
Mark the high of that bar. If a later month climbs higher, that bar becomes the peak instead.
Count forward. Once three monthly bars fail to close above the peak, draw the green line at its high.
Switch to the daily chart to watch the approach and time the breakout.
A green line that lines up with the stock’s early post IPO high carries extra weight, since the level has turned buyers away more than once.
Why Green Line Breakout Stocks Are Hard to Screen For
Most screeners stop at the 52 week high. A stock can make one while still trading far below a peak from years ago, with plenty of sellers waiting there. The daily list of stocks hitting all time highs is shorter, but it still mixes fresh breakouts with stocks that have been running for months.
A true green line needs history and a count: every monthly high since listing, the latest all time high, three monthly closes beneath it, then today’s price and volume against that line. Few filter builders can express all of that, which is why Dr. Wish has long drawn his lines by hand from a scan of all time high stocks.
Why Deepvue Is the Best Green Line Breakout Screener
Deepvue cuts the daily list of stocks hitting all time highs down to genuine green line breakouts, then leaves room for the judgment that turns one into a trade.
Dr. Wish’s Preset, One Click Away
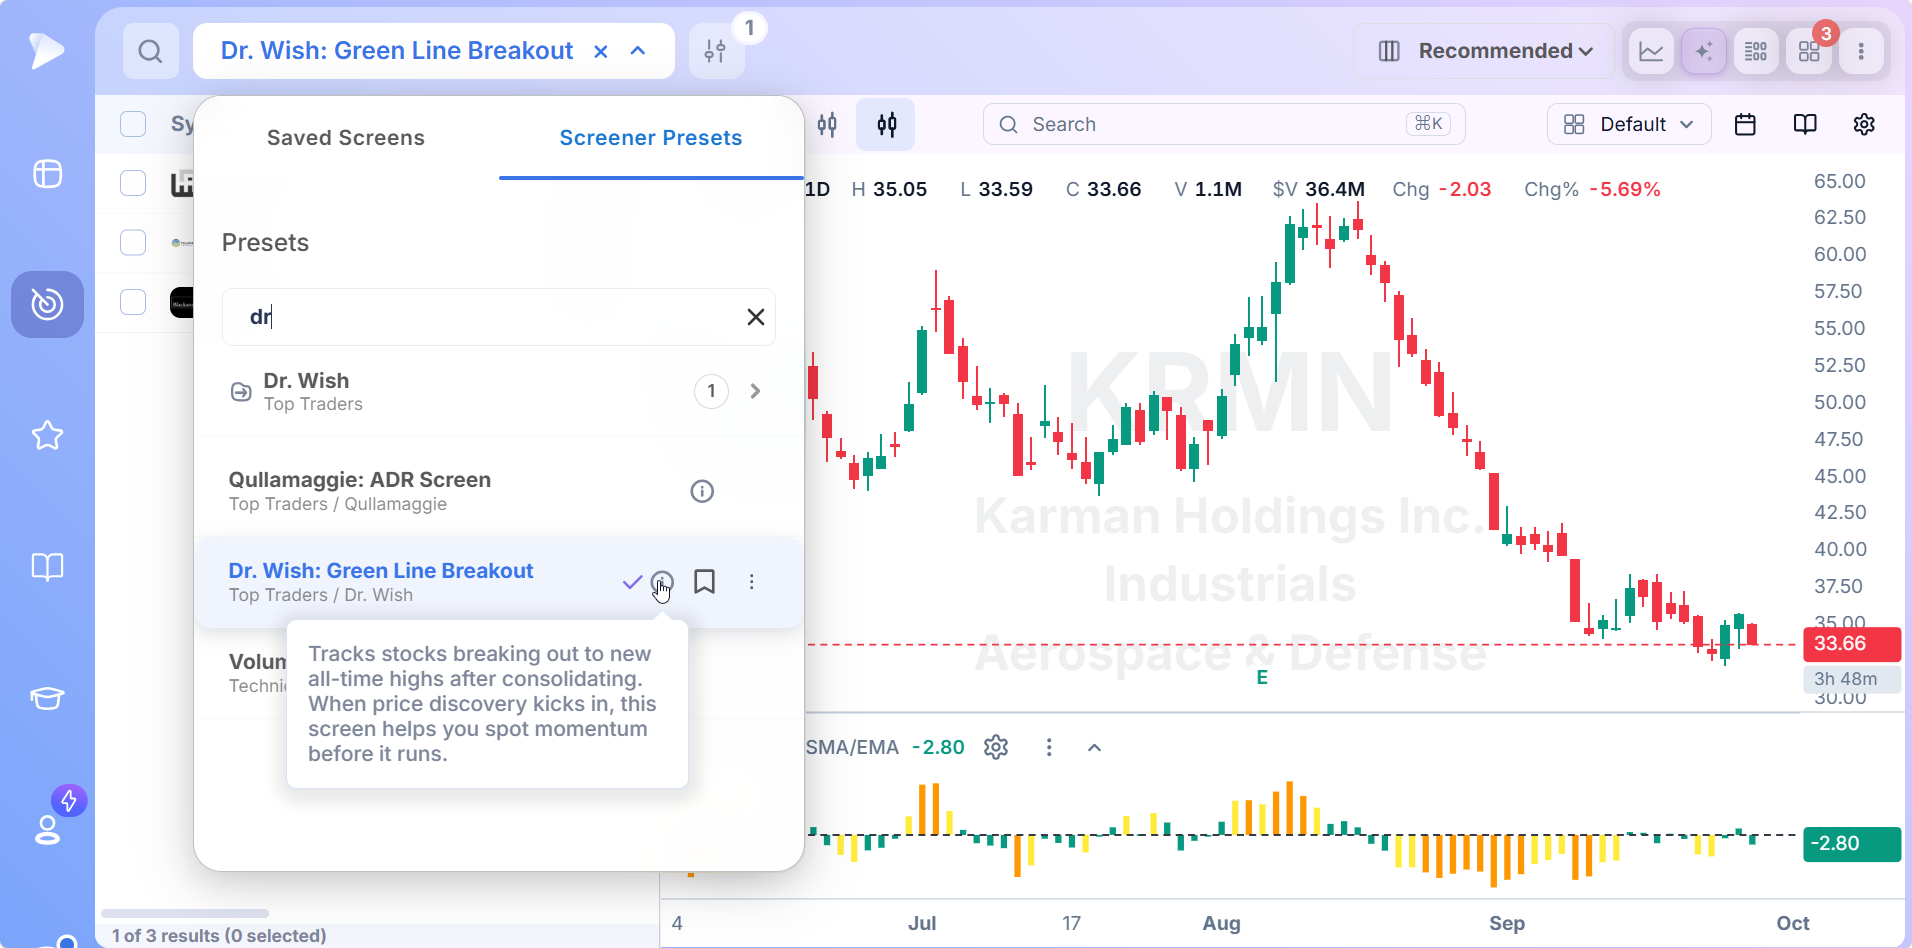
Dr. Wish: Green Line Breakout is filed under Top Traders in the screener presets, alongside scans from traders like Mark Minervini, Stan Weinstein, Oliver Kell and Mike Webster. The green line logic is built in, the universe is common stocks and ADRs, and a volume run rate above 100% of the 50 day average keeps only breakouts trading heavier than normal.
Volume Decides Which Breakouts Count
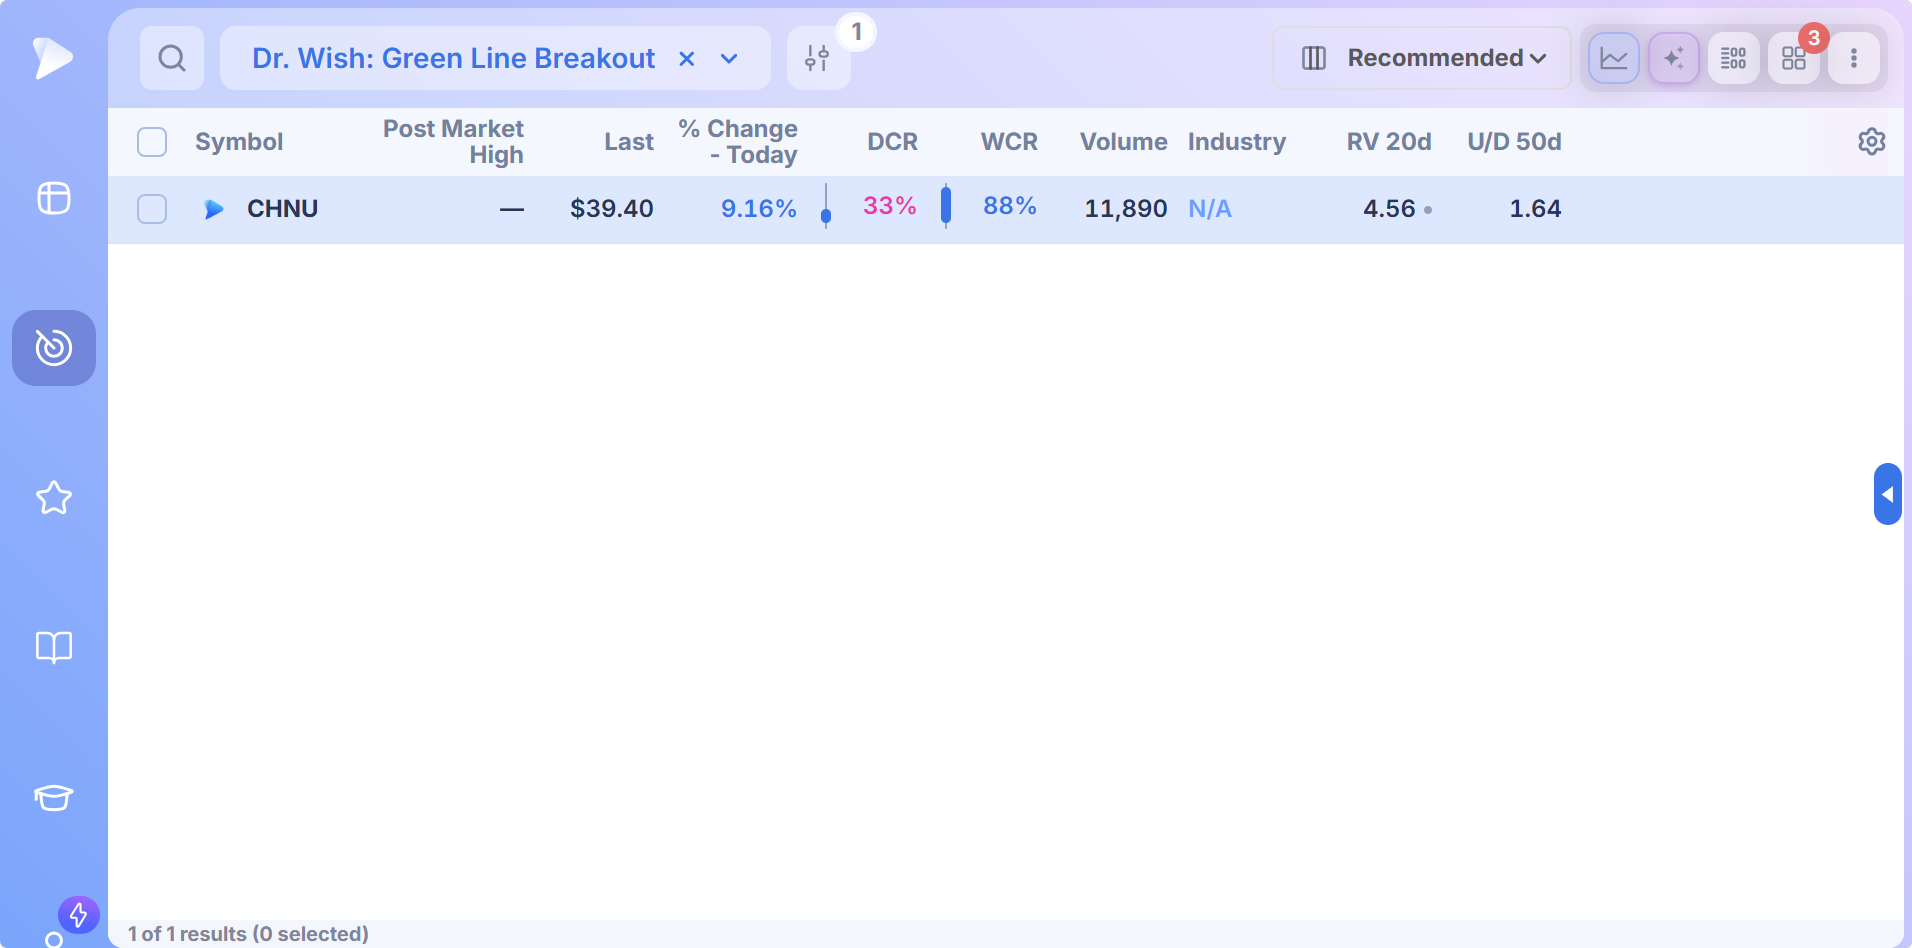
Price poking through the line on light trade isn’t a green line breakout. Low volume attempts tend to fail, and the real breakout often comes later, once volume arrives, sometimes on an earnings gap. The run rate condition keeps quiet pokes off the list, so the all time high breakout stocks you see have real demand behind them, and 20 day relative volume shows how emphatic each move is.
Build Your Own Green Line Breakout Strategy
The original preset stays locked. Duplicate it and layer your rules on top of Dr. Wish’s:
- •Relative strength to keep only market leaders
- •Earnings and sales growth to confirm a CANSLIM® quality business
- •One year price performance to reflect his preference for stocks that have doubled
- •Price and dollar volume floors so every name is liquid enough to trade
That’s how a borrowed scan becomes your own green line breakout strategy.
Draw the Line, Then Let the Alert Wait
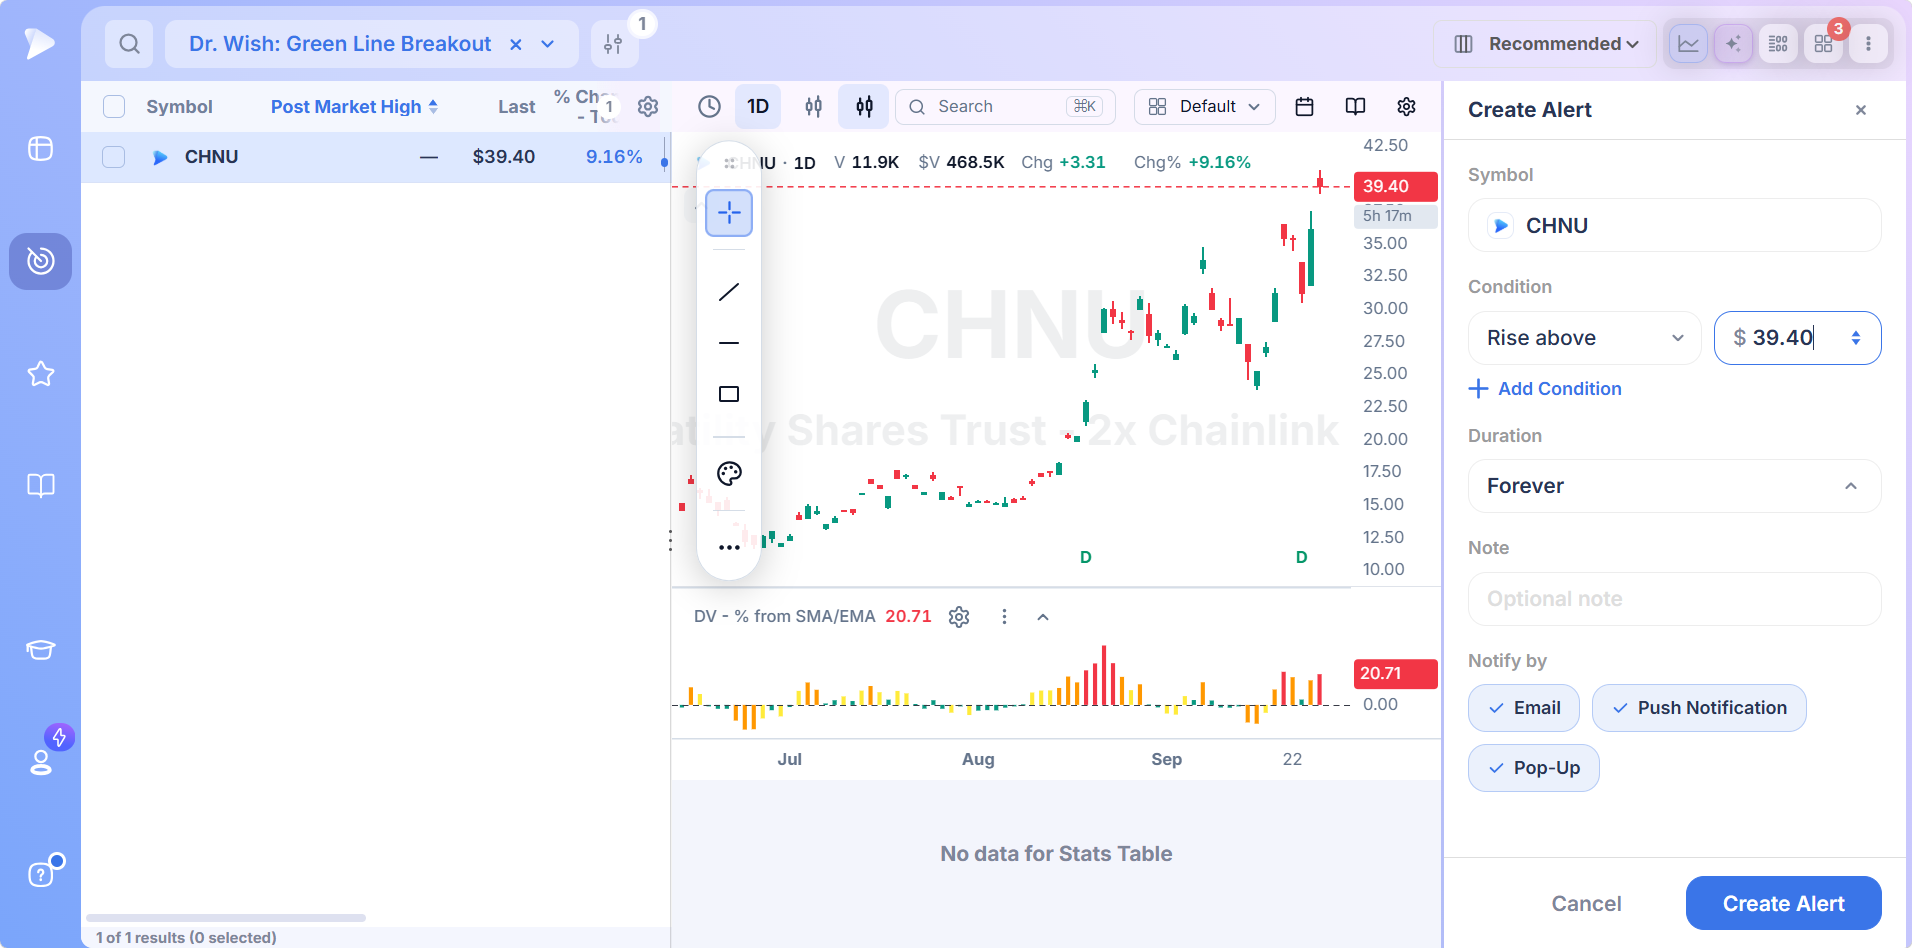
Every result opens its chart beside the list. Switch to monthly, draw the green line, and right click it to set an alert, so a stock that may take months to arrive doesn’t need watching.
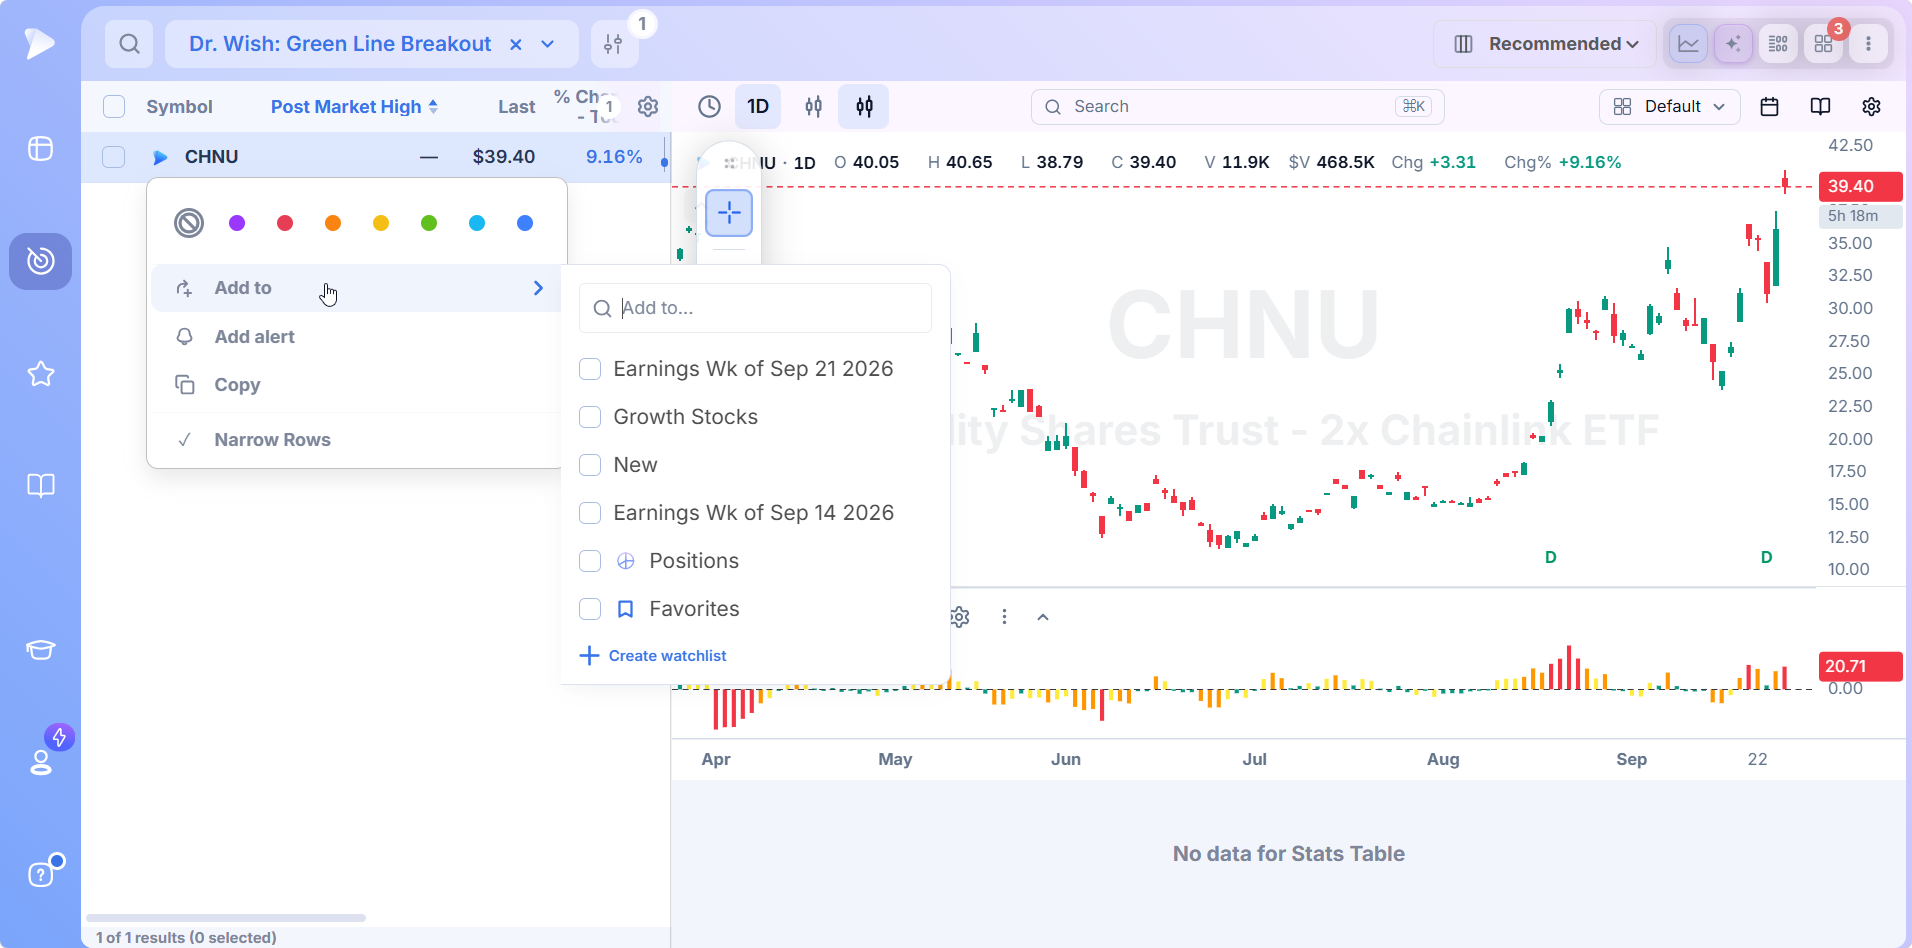
File the strongest candidates in a watchlist, including stocks near all time highs that haven’t cleared their line yet. Price alerts take stackable conditions, a duration and a note, and reach you by email, push or pop up.
Columns That Read a Breakout Day
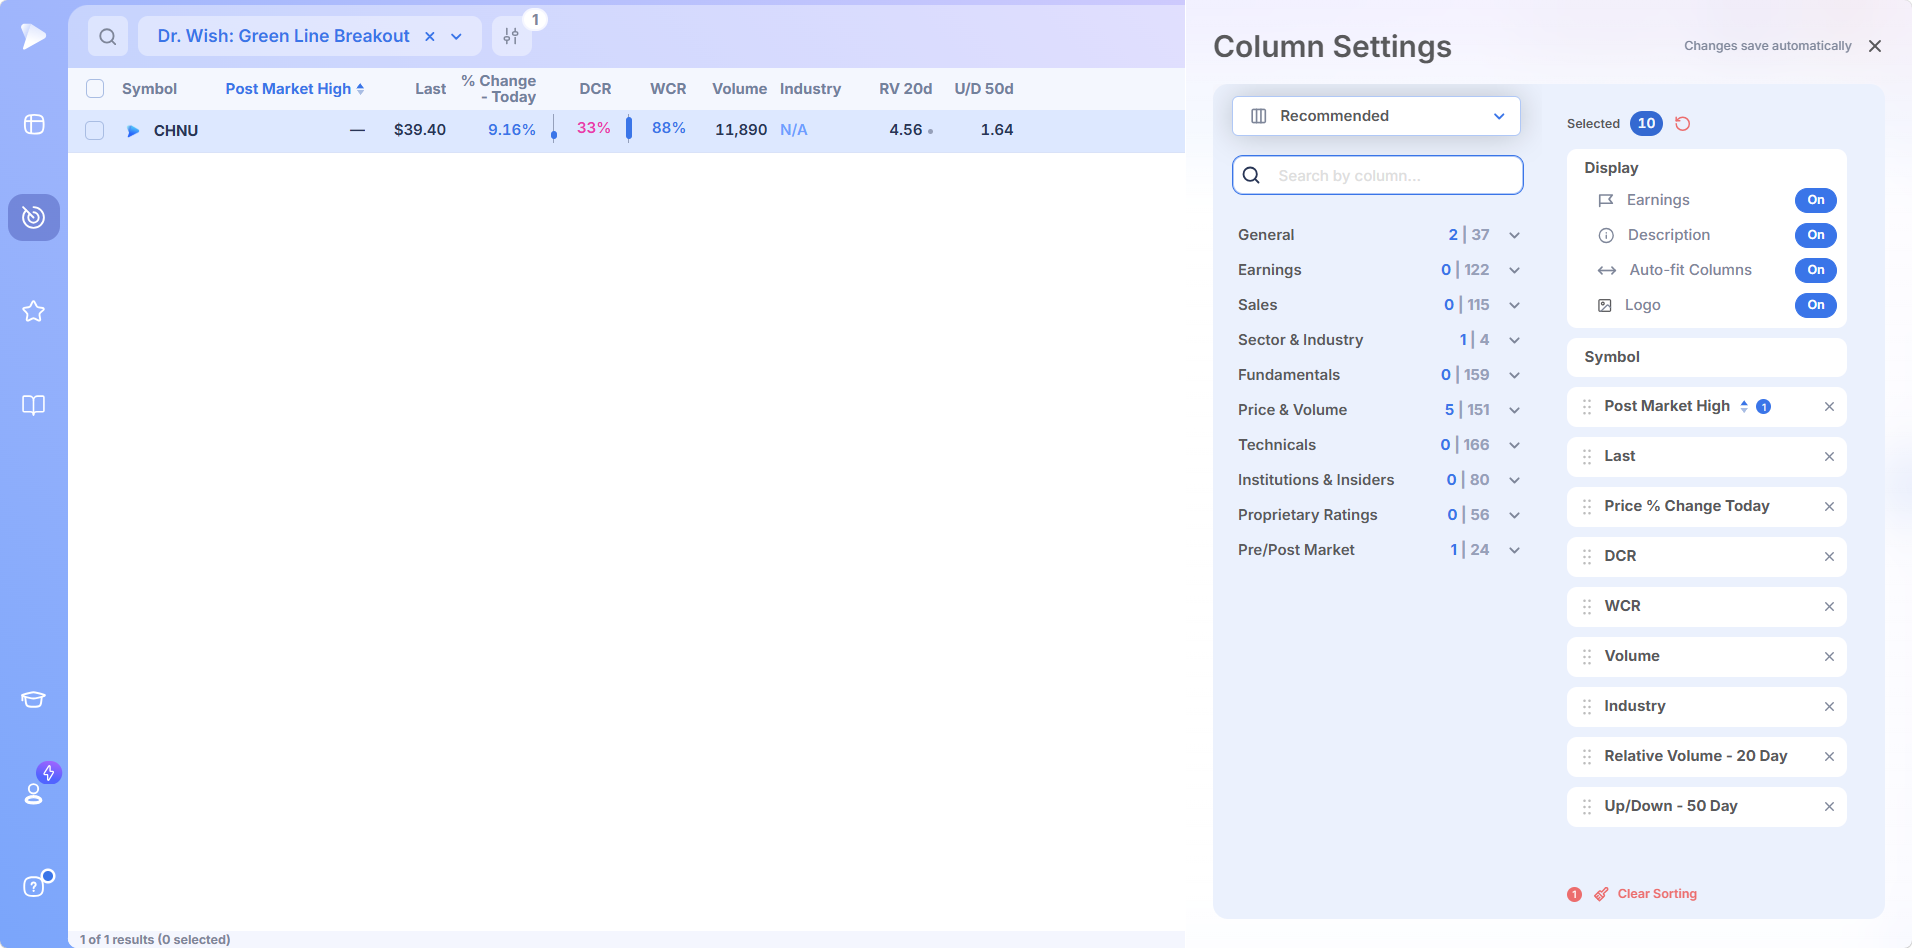
Pick from 1,152 data points to build the table. For green line work, the useful columns are relative volume, the up/down ratio, where the day closed in its range and how extended price is from its 50 day line, so breakout quality and extension read at a glance.
Set Up Your Green Line Breakout Scan in Six Steps
Green line trading rewards a routine. Build it once:
Load Dr. Wish: Green Line Breakout from Top Traders and save a copy.
Keep the green line logic and the volume run rate as they are.
Add relative strength so only leaders qualify.
Add earnings and sales growth for the CANSLIM® side.
Set minimums on price and dollar volume so fills are clean.
Review results after the close, file the best in a watchlist and alert each green line.
Prefer plain English? The AI Terminal writes the conditions from a typed request.
How to Trade a Green Line Breakout
The screen finds the breakout. How you enter decides how much of the move you keep.
Buying the Breakout Day
The classic entry is the day price clears the green line on above average volume. Early in the session, relative volume shows whether the day is pacing to qualify.
Early Entries Below the Line
Stocks near all time highs often build a tight area or mini base just under the line, which offers a lower risk entry before the breakout. It’s optional. Green line breakouts can start moves lasting months, so getting in a little early isn’t always worth the higher odds of a shakeout.
Waiting for the Next Setup
Many traders let the breakout prove itself, then buy the first tradable setup above the line: a consolidation, a 3 weeks tight pattern or a pullback to the 21 day EMA. Each leaves a nearby low to measure risk from, and the position size calculator sizes the trade off it.
The Close Below the Line Rule
A close back below the green line invalidates the breakout. Exit, put the stock back on your watchlist and let it rebuild. Hoping rarely helps: some failed breakouts range and retry, and others roll straight into a downtrend.
All Time Highs vs 52 Week Highs
The all time high meaning is simple: the highest price a stock has traded since it listed. A 52 week high only looks back a year, and the difference changes how a breakout behaves.
| All time high (green line) | 52 week high | |
|---|---|---|
| Lookback | Entire trading history | One year |
| Overhead supply | None, since nobody bought higher | Possible from older peaks |
| Base requirement | At least three months below the peak | None |
| Where it fits | Blue sky breakouts in leaders | Early recoveries and turnarounds |
Both have their uses, and Deepvue carries a separate 52 Week Highs preset. For all time high breakout stocks after a proper rest, the green line is the stricter test.
Who Should Run the Green Line Scan
- •CANSLIM® traders who want new highs from sound bases
- •Swing and position traders aiming for moves that last weeks to months
- •Followers of Dr. Wish’s method who still draw every green line by hand
- •Traders who would rather wait on an alert than watch a stock for months
- •Growth traders comparing all time high stocks across leading groups
Pricing
Everything below comes on a single $49 monthly plan.
- •Every Top Traders preset, Dr. Wish’s scan included, editable once saved as a copy
- •The full field library, so volume, strength and growth filter together
- •Monthly and daily charts with drawing tools, for plotting green lines where they belong
- •Alerts, watchlists and live session data, so a breakout reaches you the day it happens
MarketSurge, the closest comparison, charges $149 a month.
New members get a one on one onboarding call, welcome emails and a live webinar every week on a single feature.
Let the Line Do the Watching
Green line trading asks for patience, then decisiveness: months of waiting, then one day that matters. The green line breakout screener handles the waiting, so you’re ready when that day comes.
Related chart formations are collected in stock screener by pattern. For indicator driven scans, see screener by indicator, and for strategy-based screens, see screener by strategy.
Catch the next green line breakout
↑ Back to contentsFrequently Asked Questions
What is a green line breakout?
A green line breakout is a stock breaking to a new all time high, on above average volume, after resting at least three months below its previous peak. Dr. Eric Wish popularized the setup. Deepvue’s Dr. Wish: Green Line Breakout preset screens for it automatically.
Who created the green line breakout?
The green line breakout was created by Dr. Eric Wish, who has traded for more than 50 years, teaches stock market courses at the University of Maryland and writes the Wishing Wealth blog. Deepvue carries his scan as a Top Traders preset.
How do you draw a green line on a stock chart?
You draw a green line on a monthly stock chart at the high of the latest all time high bar, once three monthly bars have failed to close above it. In Deepvue you can draw the line on the chart and right click it to set an alert.
What timeframe is the green line breakout drawn on?
The green line breakout is drawn on the monthly timeframe, where each bar is one month and the three month rest is easy to count. Traders then use the daily chart for entries, and Deepvue switches between monthly and daily in one click.
Why do traders buy stocks at all time highs?
Traders buy stocks at all time highs because there’s no overhead supply: nobody who bought higher is waiting to sell at breakeven. Growth methods like CANSLIM® and the GLB favor them. Deepvue’s green line breakout screener surfaces these breakouts every day.
What does all time high mean in stocks?
The all time high meaning in stocks is the highest price a stock has ever traded since it listed. It differs from a 52 week high, which only looks back one year. Deepvue’s green line breakout screener works from the true all time high.
What is price discovery in stocks?
Price discovery in stocks is buyers and sellers setting a price with no prior trading above to anchor it, which happens when a stock breaks to an all time high. Green line breakouts put stocks into price discovery, and Deepvue’s preset flags them the day it starts.
Why do green line breakouts fail?
Green line breakouts fail most often on light volume, in a correcting market, or when the stock closes back below the line, which invalidates the setup. Deepvue’s volume run rate condition keeps many of the weak, low volume attempts off your list.
What is the difference between a green line breakout and a 52 week high?
The difference between a green line breakout and a 52 week high comes down to lookback. A green line breakout clears the stock’s all time high after a three month rest, while a 52 week high only beats the past year. Deepvue has presets for both.
Is the green line breakout screener included in Deepvue?
Yes, the green line breakout screener comes with the one Deepvue plan at $49 a month, which also covers every Top Traders preset, charting, watchlists, alerts and the full field library. Nothing is tiered.
CAN SLIM® is a registered trademark of O’Neil Capital Management, Inc. (U.S. Reg. No. 3,081,940). Deepvue is not affiliated with, sponsored by, endorsed by, or licensed by O’Neil Capital Management, Inc., Investor’s Business Daily, MarketSurge, or their affiliates. Any reference to CAN SLIM® is for descriptive purposes only. Deepvue’s scores, ratings, and screeners are independently calculated by Deepvue and are not the proprietary ratings of MarketSurge or IBD.