The Relative Strength Stock Screener That Catches Leaders Early
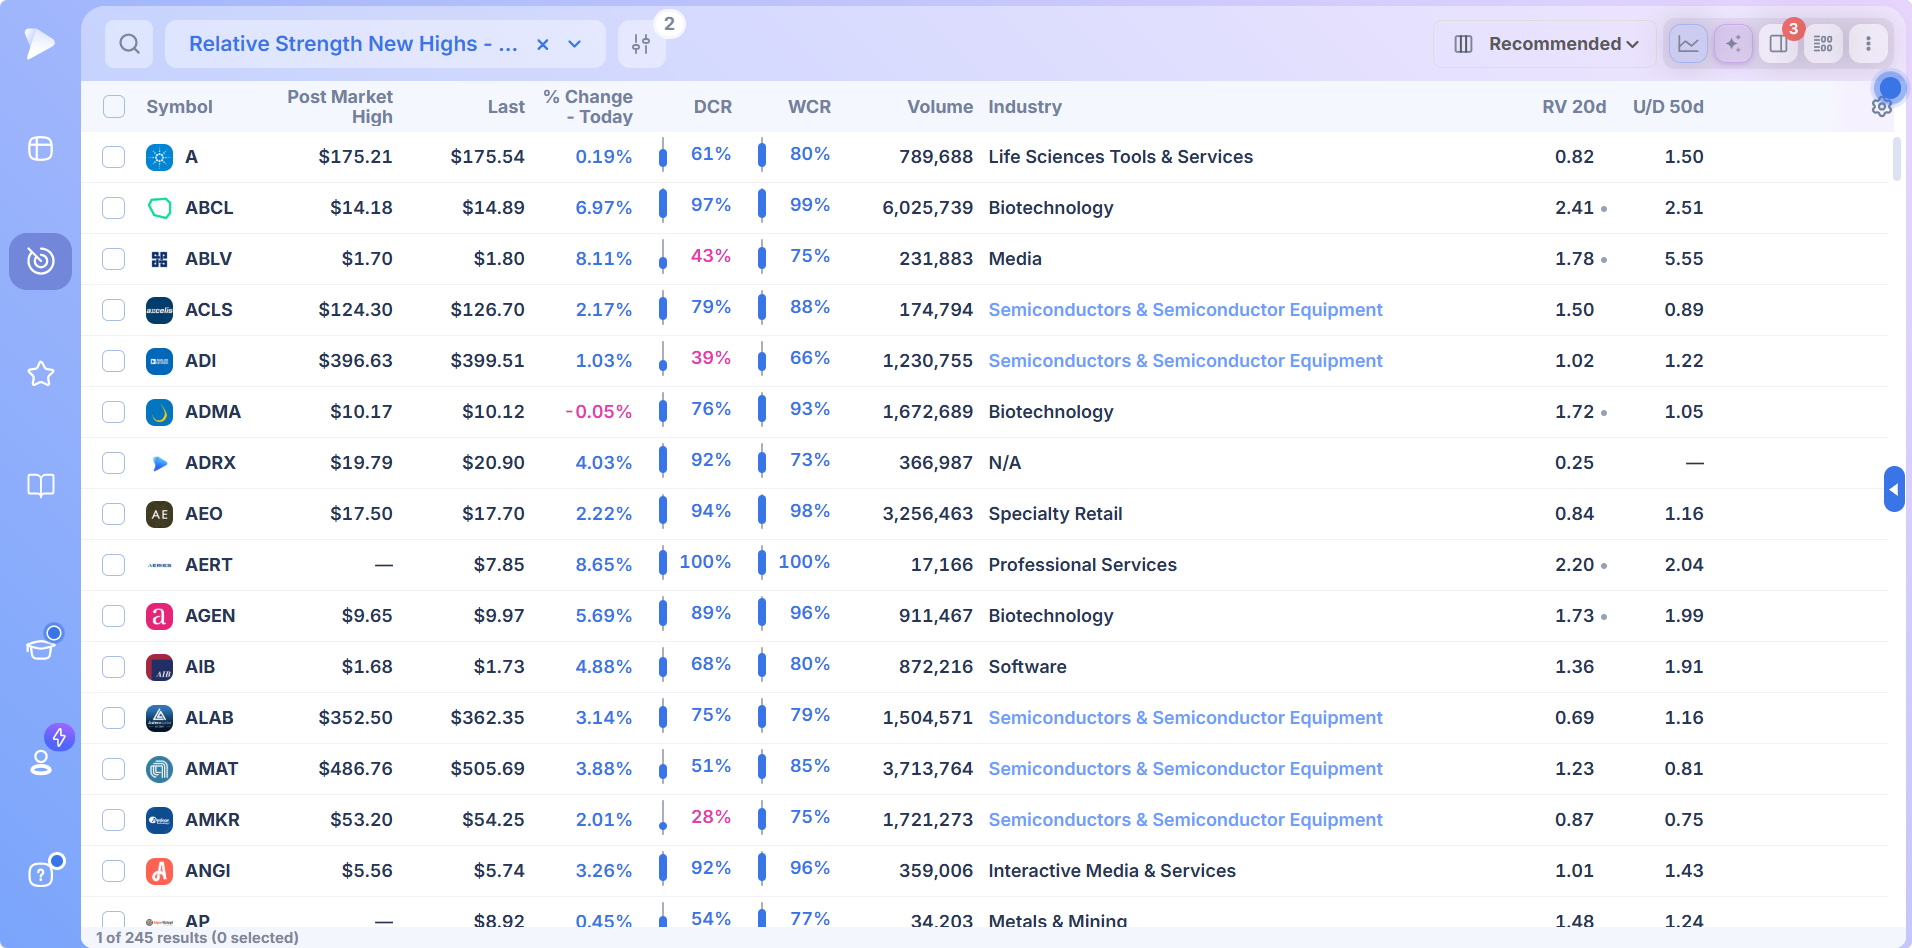
Relative strength compares a stock’s performance to the market rather than to its own past. Its most useful signal is the RS line making a new high before price does, which shows the stock outperforming more than at any point in the lookback window. Deepvue ships that as three presets, Relative Strength New Highs over 1, 3 and 6 months, alongside the RS Rating that ranks every stock against the market. $49 a month.
Key Takeaways
Every trader has watched a stock hold its highs while the index bleeds, then run the moment the market turns. That behavior has a name and a measurement. Relative strength is the stock’s performance divided by the market’s, and when the line that tracks it breaks to a new high, the stock is leading whether or not its price chart shows it yet.
Most screeners can rank stocks by a trailing return. Very few can find the ones whose RS line just made a new high, because that needs the ratio computed for every stock, every day. Deepvue’s screener does exactly that, and packages the result as presets you can open before the bell.
- ✓Relative strength is performance against the market, which is a different thing from RSI
- ✓An RS line new high before a price new high is the classic early signal of a future leader
- ✓Deepvue ships three RS line new high presets, over 1, 3 and 6 months, plus the RS Rating as a 1 to 99 rank
- ✓Strength in a falling market is the clearest read, because nothing else is holding the stock up
- ✓The screen finds the leaders and the chart tells you whether there is an entry
- ✓Presets, ratings, RS line, Mansfield RS, charts and alerts are all on the $49 a month plan
What Is Relative Strength in Stocks?
Relative strength stocks are the ones beating the index, and the measure itself is a comparison. Take a stock’s price and divide it by an index, usually the S&P 500, and plot the result over time. That ratio is the relative strength formula in its simplest form. When the line rises the stock is beating the market; when it falls the stock is lagging, even if both are going up. It is a measure of leadership, not of direction, which is why market leaders are found with it.
The idea is old and well documented. Robert Levy’s 1967 study found that stocks with the best relative performance over the prior six months tended to keep outperforming. William O’Neil built his relative strength rating on the same observation, and every momentum study since has confirmed some version of it. Winners tend to keep winning, for a while, and relative strength is how you find them before it is obvious.
Relative Strength vs RSI
The two are confused constantly and have nothing to do with each other beyond the initials. Relative strength compares a stock to the market. The relative strength index compares a stock to its own recent gains and losses, and is used to call it overbought or oversold. A stock can have an RSI of 80 and be lagging the market badly, or an RSI of 40 and be the strongest name on the board. Everything that follows is about the first one.
How Relative Strength Is Measured
| Measure | What it is | Where you see it in Deepvue |
|---|---|---|
| RS line | The stock’s price divided by the index, plotted as a line. Rising means outperforming | A chart overlay, and the basis of the RS New Highs presets |
| RS line new high | The RS line at its highest point of the lookback window, whether or not price is | The Relative Strength New Highs presets over 1, 3 and 6 months |
| RS Rating | Deepvue’s 1 to 99 rank of price performance against every other stock, weighted to recent months | A filterable column and a rating on every chart |
| Mansfield RS | Stan Weinstein’s version: the RS ratio against its own moving average, so zero is the dividing line | A chart indicator, positive above the line and negative below |
Why an RS Line New High Matters Most
A price new high tells you the stock went up. An RS line new high tells you it went up more than the market did, which is a claim about the buyers. Someone is choosing this stock over the index, deliberately, and that choice is the earliest visible trace of institutional accumulation.
The version traders prize is the RS line making a new high while price is still inside a base. The stock has not broken out, so it is not yet on the breakout lists, but the market has already voted. When the breakout comes, the names whose RS line led the way are the ones most likely to follow through.
Strength in a Weak Market Is the Loudest Signal
In a rising market almost everything has positive relative strength against something. The read that means the most comes on down days and in corrections: a stock holding its highs while the index falls has no tailwind to explain it, only demand. Those are the names that lead the next advance, and they are found by running a relative strength screener on the days most traders have stopped looking.
Why Relative Strength Is Hard to Screen For Properly
The lazy version is a trailing return filter: show me stocks up more than 20% in three months. That is absolute performance, and in a strong market it returns half the exchange. The real version needs the ratio to the index computed daily for every stock, then a test of whether that ratio is at a new high over a chosen window, then a separate relative strength ranking so the strongest can be sorted to the top.
Most tools have the first piece and not the other two. A relative strength scanner that only sorts by return is measuring the market’s strength as much as the stock’s.
Why Deepvue Is the Best Relative Strength Stock Screener
Deepvue computes the RS line for every stock, tests it for new highs over three windows, ranks it as the RS Rating, and draws both the RS line and Mansfield RS on the chart. Every piece of the concept exists as a filter, a column or an overlay.
Three RS Line New High Presets, Already Built
Open Screener Presets and search for Relative Strength. Three screens come back: Relative Strength New Highs over 1 month, 3 months and 6 months. Each returns stocks and ADRs whose RS line has just hit a new high over that window, meaning they are outperforming the market more than at any point in the period.
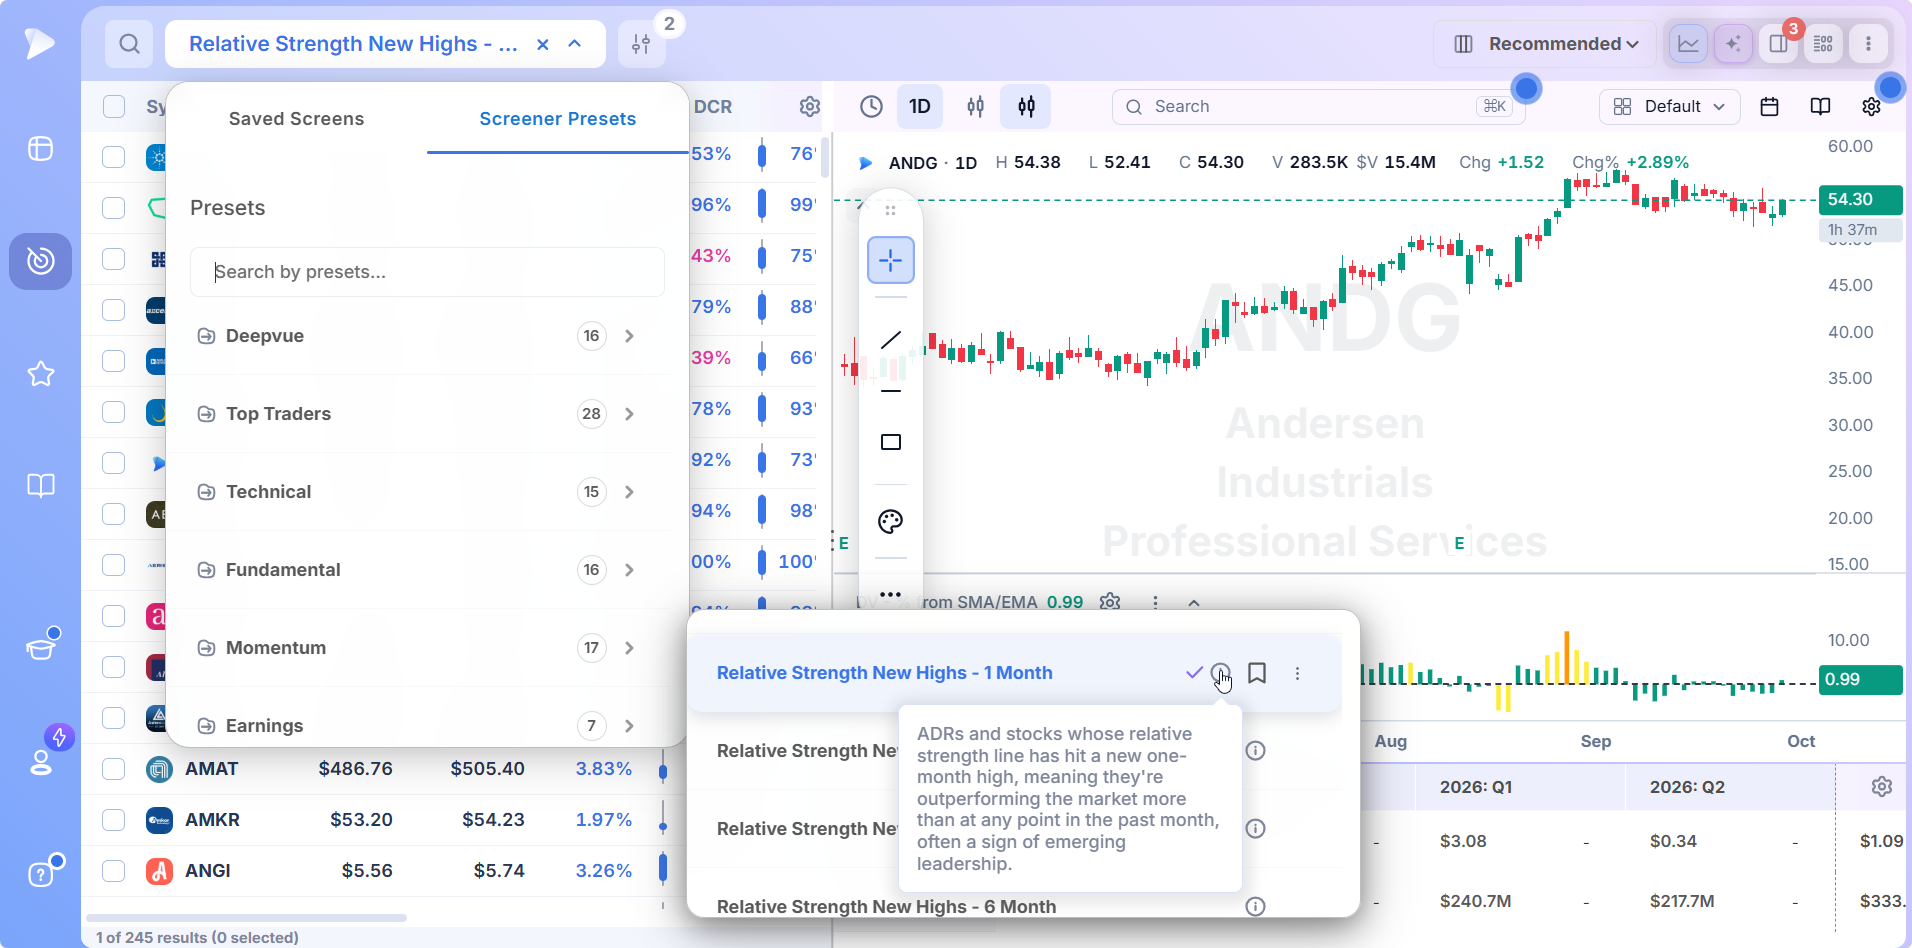
The windows answer different questions. One month catches emerging leadership, the names that started outperforming recently and may be early in a move. Six months catches established leaders whose outperformance has held through at least one market pullback. Three months is the swing trader’s middle ground. Run all three and the overlap is the shortlist.
The RS Rating Ranks the Whole List
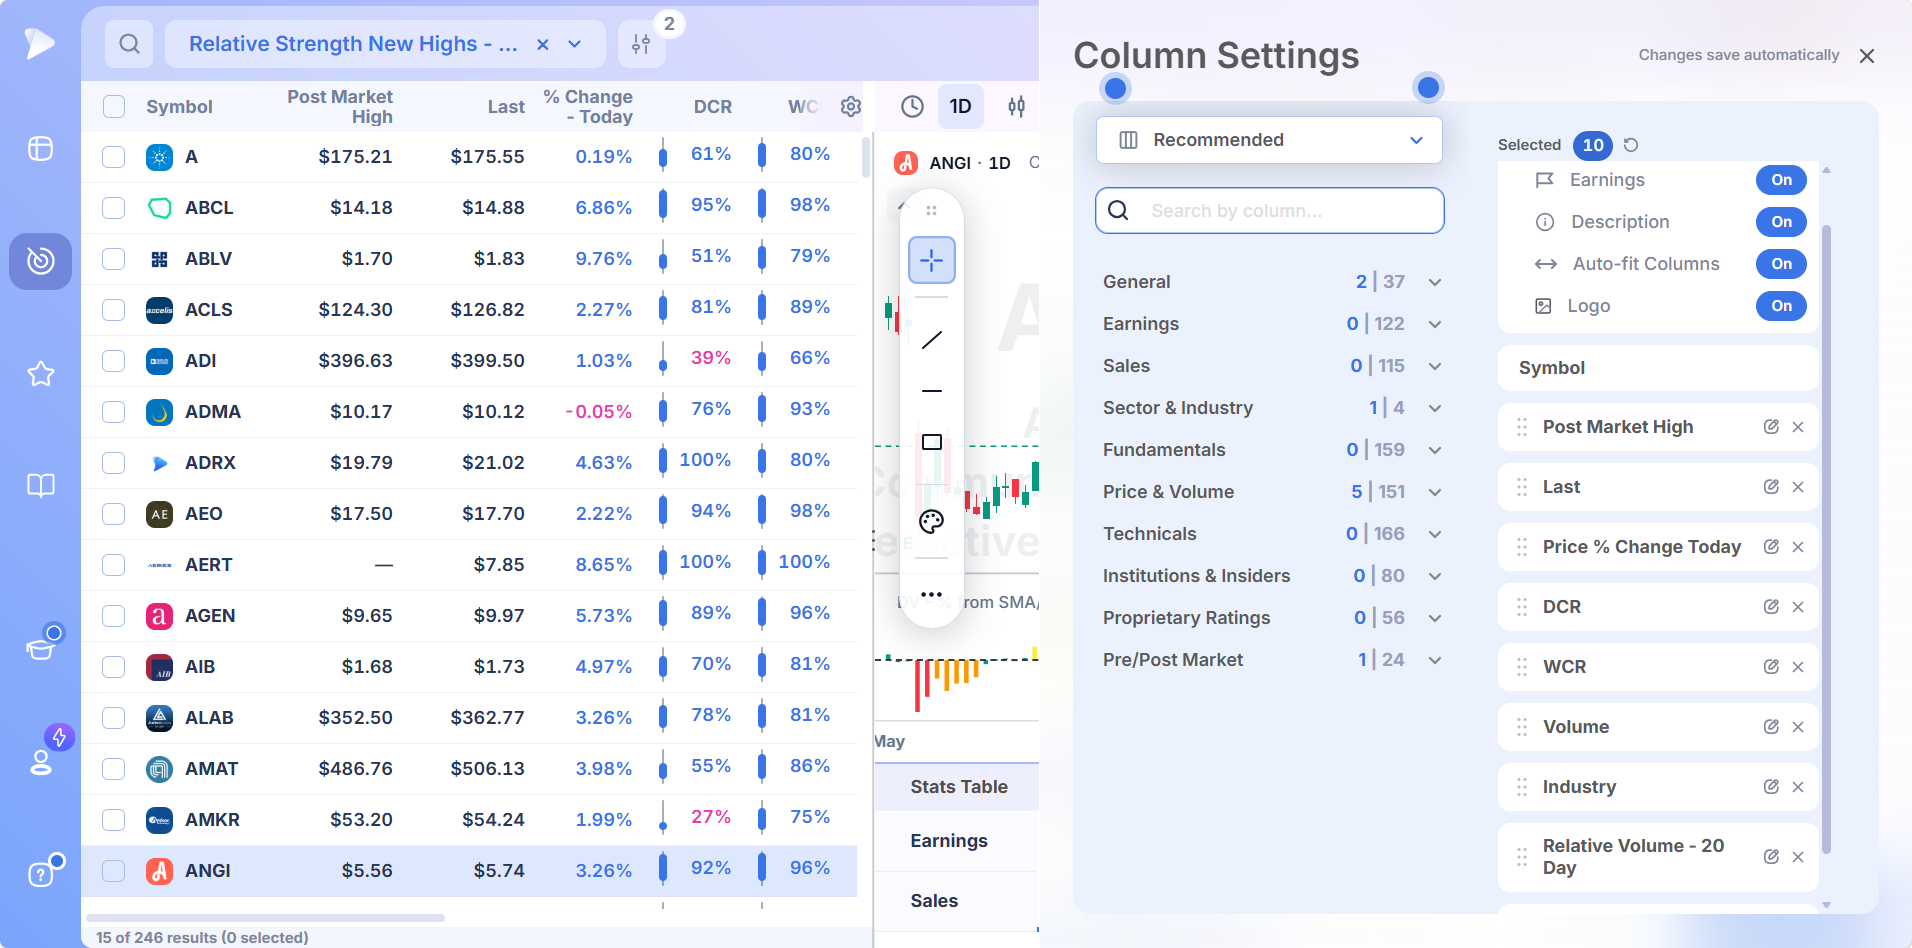
An RS line new high is a yes or no. The RS Rating turns strength into a number from 1 to 99, so the results can be sorted and a floor can be set. A stock with an RS line new high and an RS Rating above 90 is outperforming almost everything and has just accelerated. Add the rating as a column, or as a condition in a copy of the preset.
Read the Results With Closing Range and Volume
Relative strength says the stock is leading. The other columns say whether the leadership is being bought. Daily and weekly closing range show whether the stock finishes near its highs, relative volume shows whether today’s interest is unusual, and the 50 session up/down figure shows whether recent volume has favored buyers. Strength plus accumulation is the combination; strength on fading volume is a leader losing its sponsors.
The RS Line and Mansfield RS on the Chart
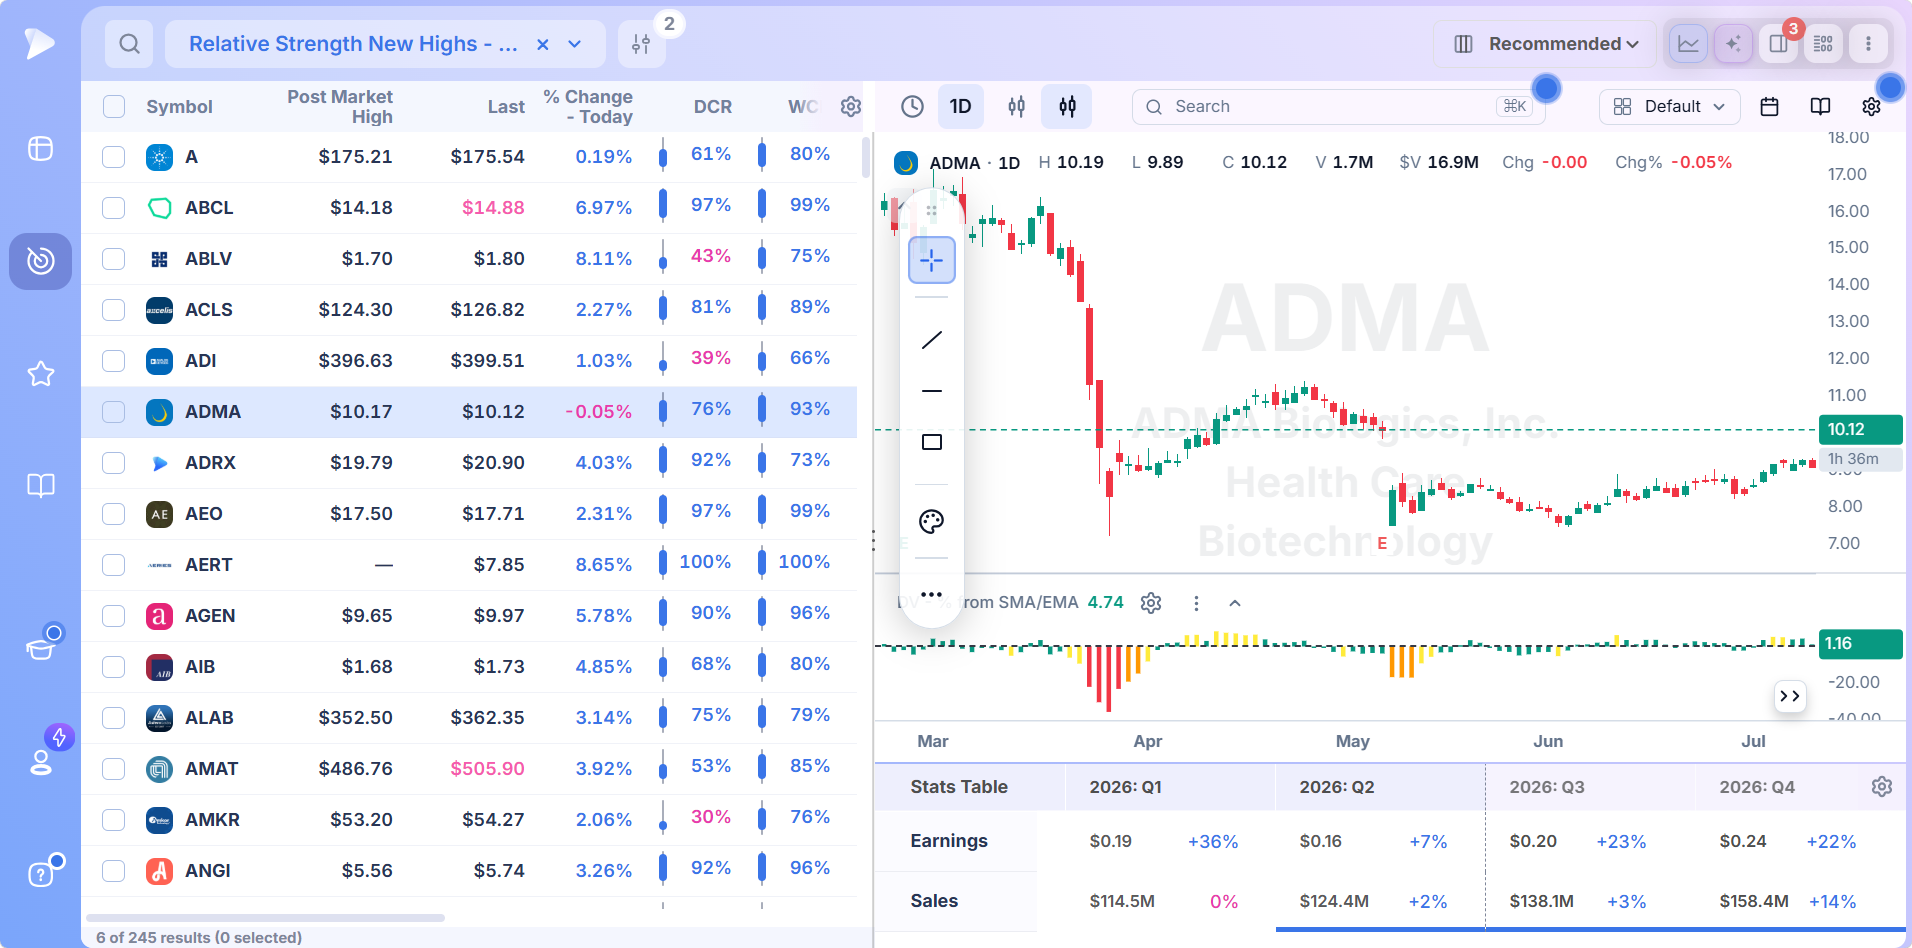
Click any result and the chart appears alongside the list. Add the RS line as an overlay and the new high the screen found is visible against price, which is the check that matters: is the RS line leading price into a base, or confirming a breakout that already happened? The Mansfield RS indicator shows the same relationship as a histogram around zero, which some traders find easier to read at a glance.
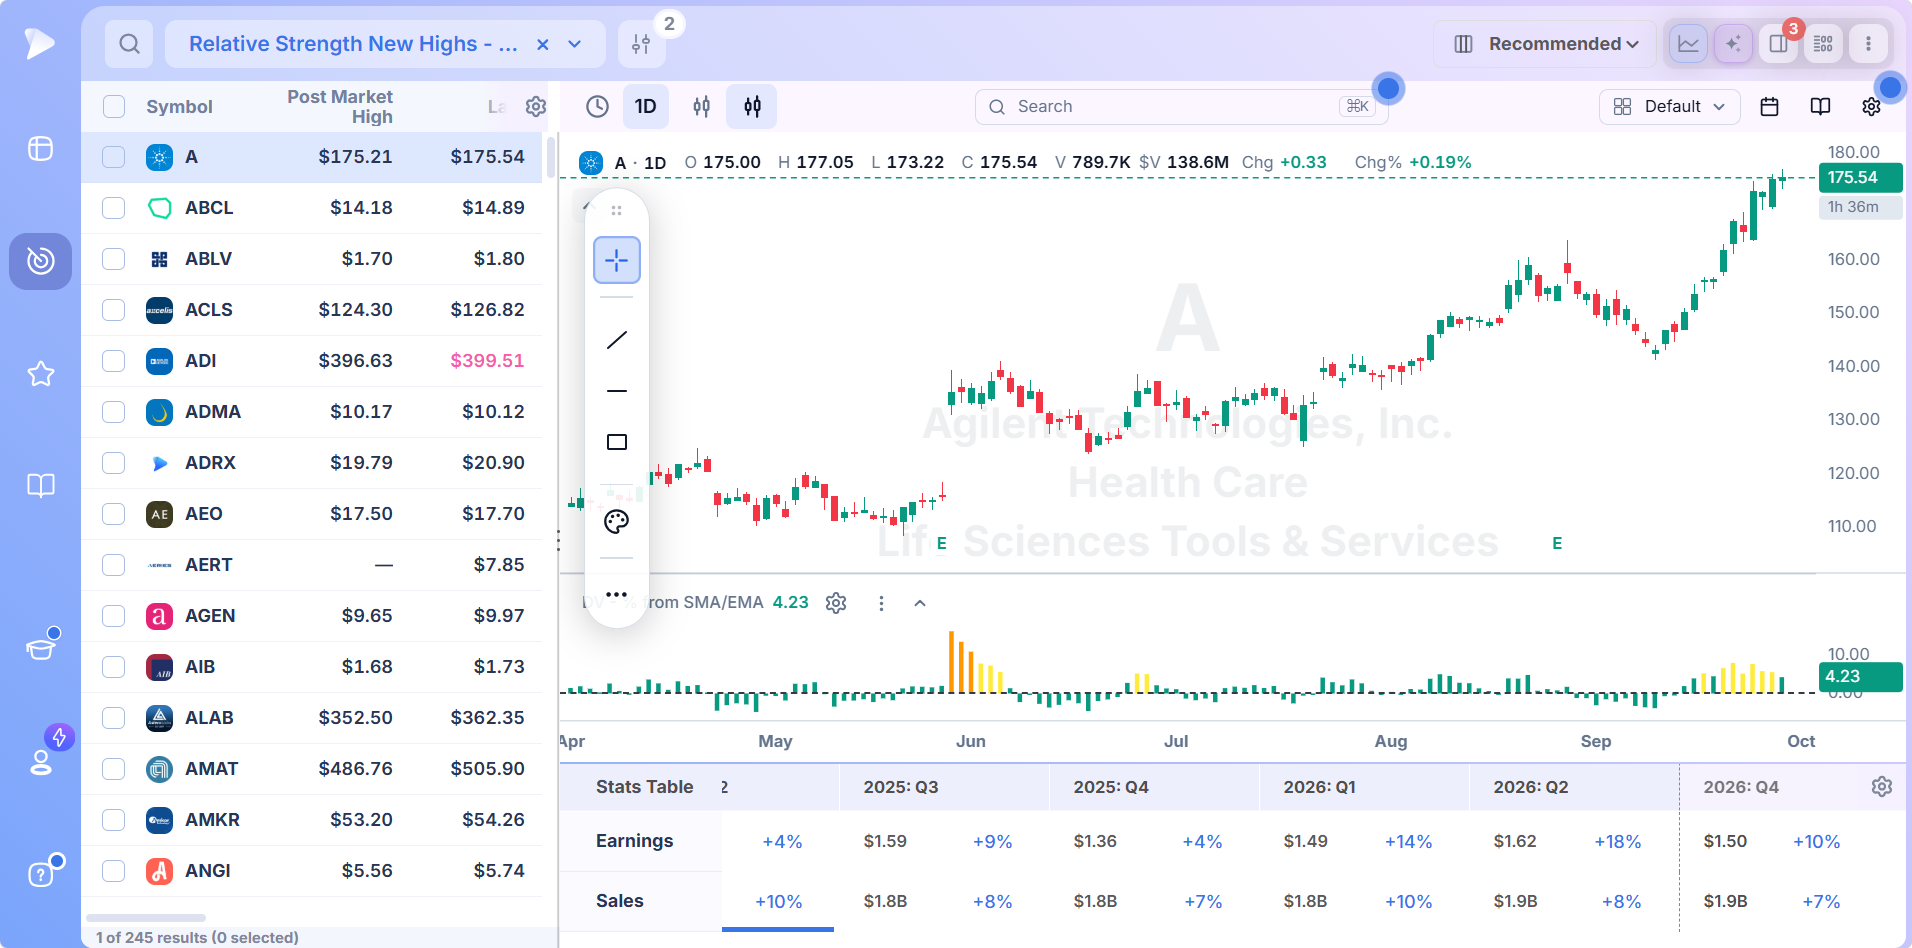
Below the candles, the stats table covers the fundamentals in one glance. Leadership backed by accelerating earnings is the combination O’Neil built his method on.
List the Leaders, Alert the Entry
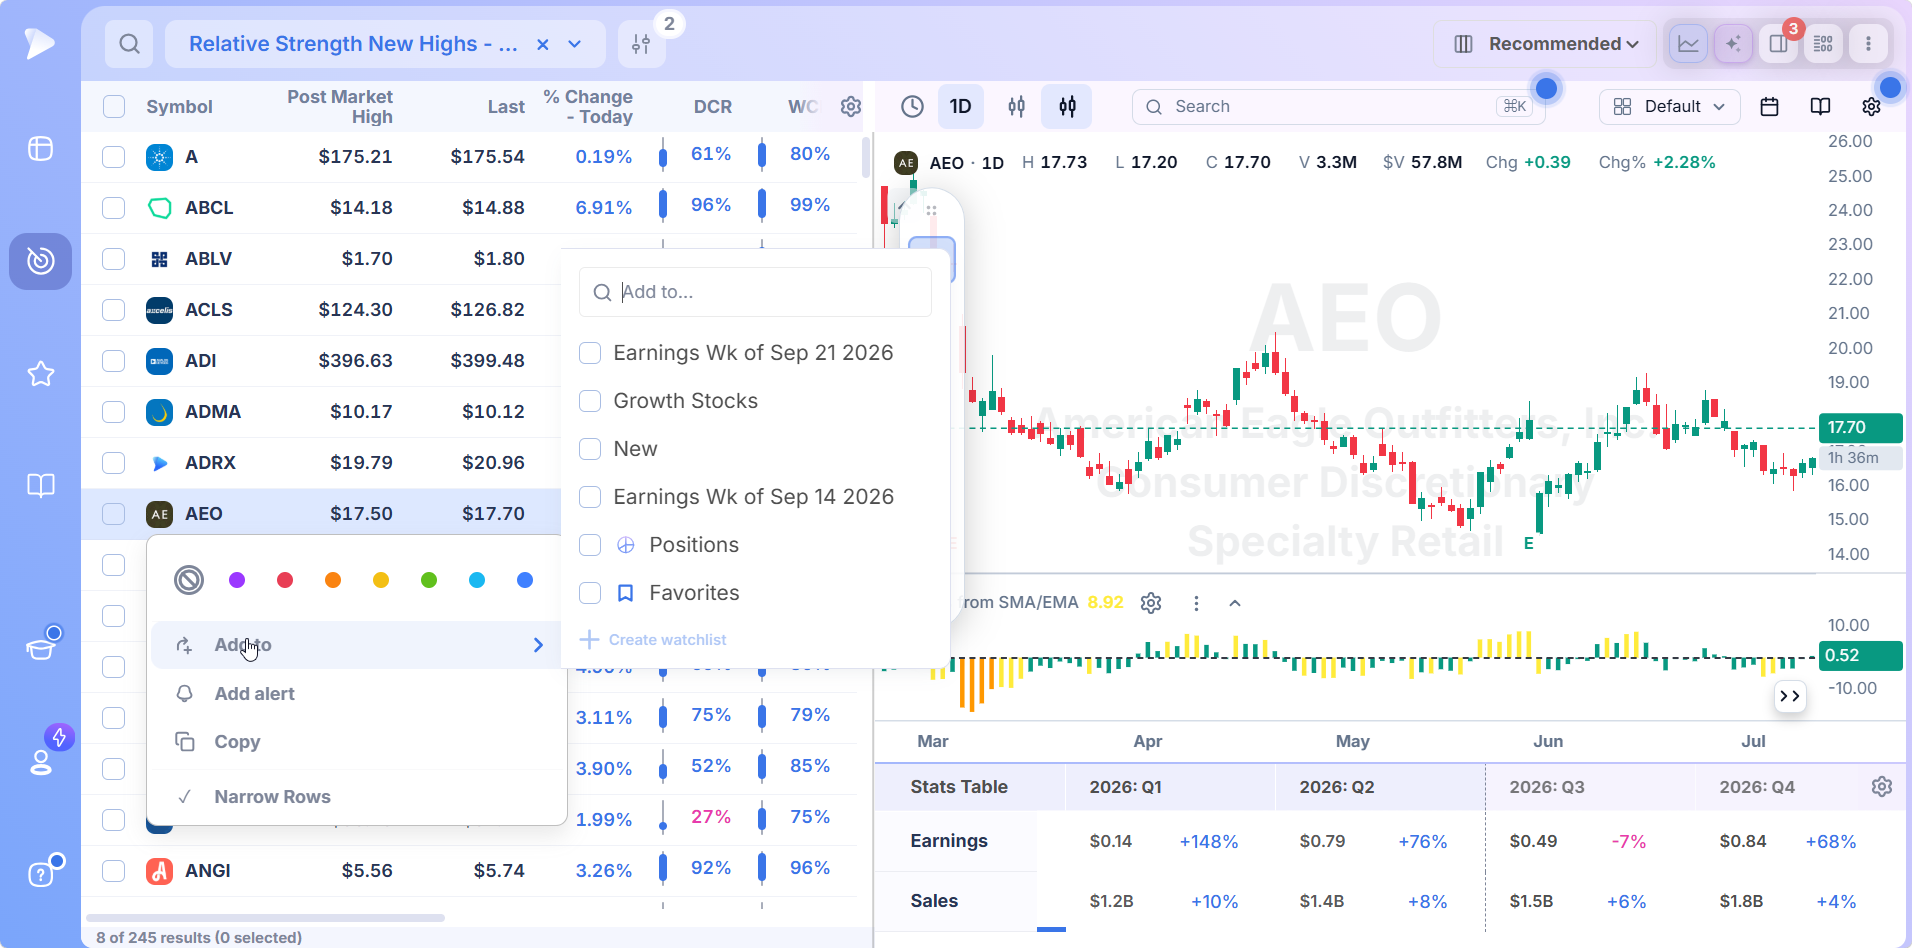
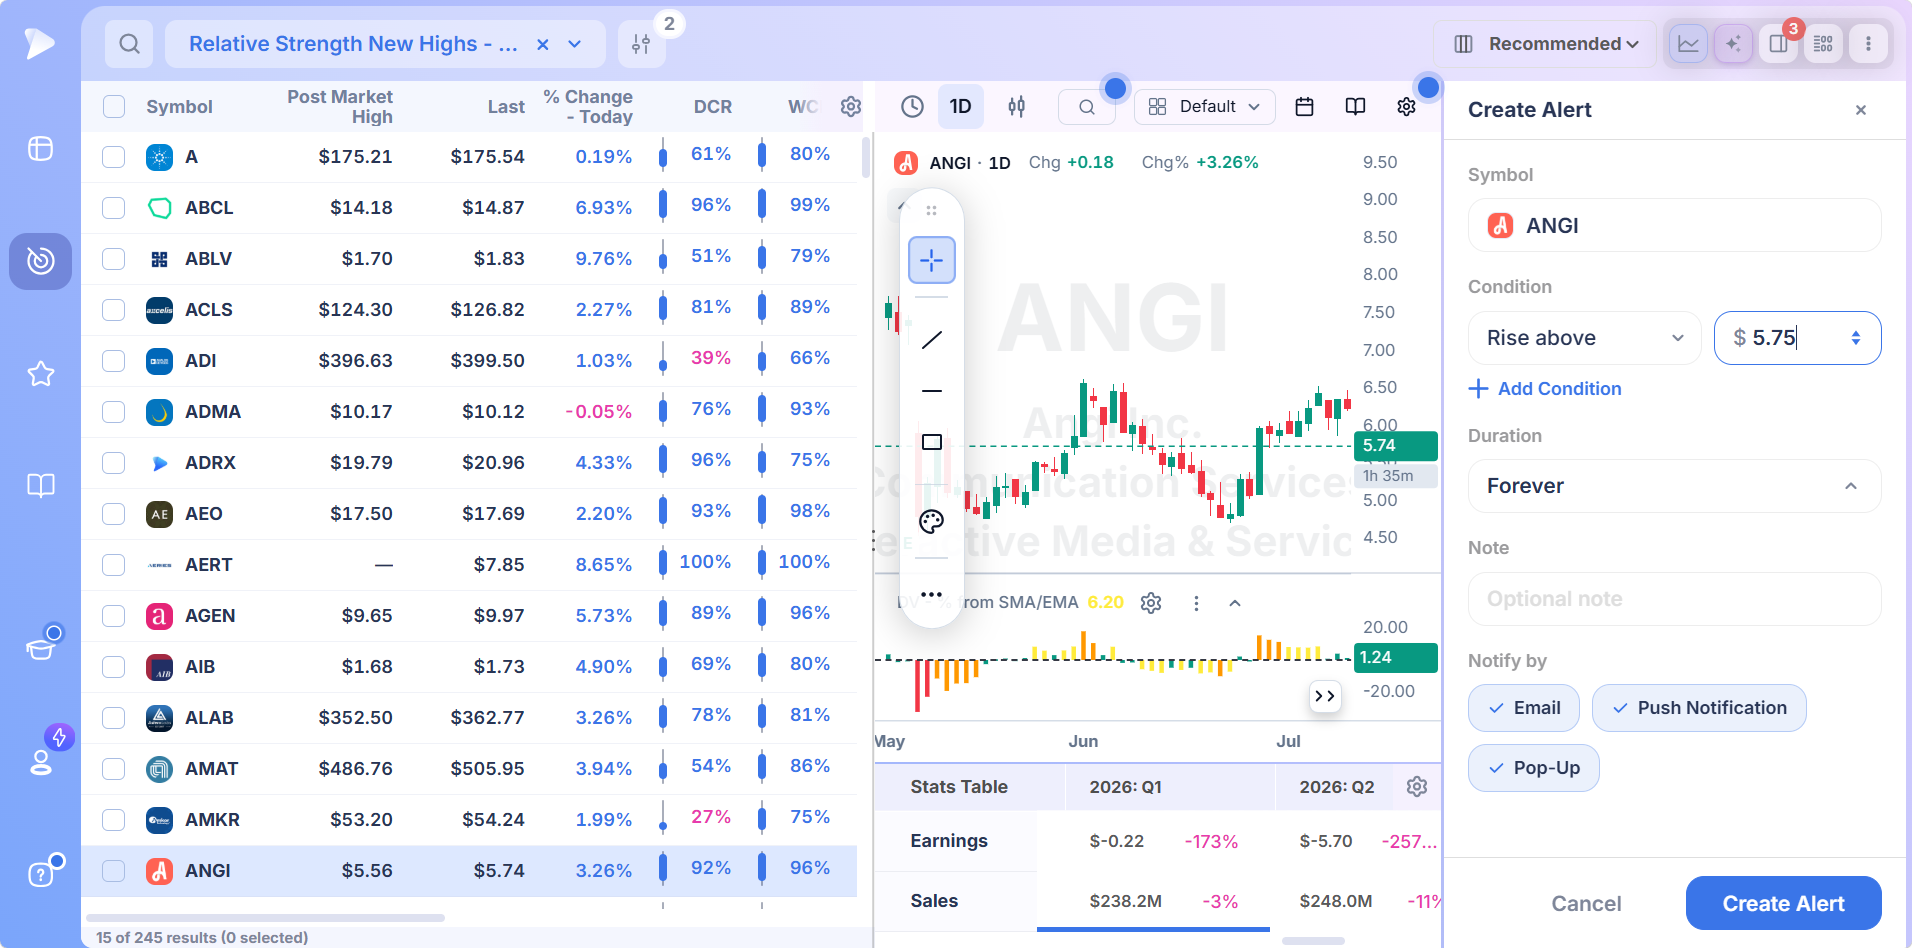
Relative strength finds names to own; it rarely says when. Send results to a watchlist and set an alert at the top of the base it is building, so a leader that has been quietly outperforming inside a range tells you the moment it breaks out.
How to Build Your Own Relative Strength Screener
The presets are the foundation. A copy lets you add the conditions that turn a list of leaders into a list of trades.
Duplicate one of the Relative Strength New Highs presets, usually the 3 month version, to unlock its conditions.
Add RS Rating above 80 or 90 so only the top decile of performers remains.
Require price within about 15% of its 52 week high, so the leaders kept are still near their highs.
Add a base condition: price within a few percent of its 20 day high but not above it, which isolates leaders still consolidating.
Add a dollar volume floor so every name is tradeable in size.
Add the industry group rank if you want leaders in leading groups, which is where the biggest moves cluster.
Or type it into the AI Terminal: “stocks whose RS line made a 3 month high with RS Rating above 85, within 10% of the 52 week high, trading over $20 million a day” returns the condition set ready to tune.
How to Trade Relative Strength
Relative strength is a selection tool first and a timing tool second. The traders who use it best treat it as a filter that decides which charts they are allowed to look at.
Buy Leaders Out of Bases, Not at Random
A stock on the RS New Highs list that is already 30% above its 50 day average is a leader with no reasonable stop. The trade is the leader that is still building a base while its RS line climbs, entered as price clears the pivot on volume. The relative strength got it on the list; the base and the breakout decide the entry.
Where the Stop Goes
A few percent under the entry, beneath the breakout day’s low or the pivot itself. The position size calculator converts that distance into shares. A relative strength trade that immediately loses its strength, meaning the RS line rolls over on the entry, is the clearest exit signal there is.
Relative Strength as a Sell Signal
The RS line usually turns down before price does. A stock making a price new high while its RS line fails to make one is being outpaced by the market for the first time in its run, which is distribution showing up in the ratio before it shows up in the candles. Watching the RS line on holdings is as useful as watching it on candidates.
RS Line New High, RS Rating or Strength on a Down Day?
Three relative strength screens that answer three different questions:
- •RS line new high. Is the stock outperforming more than at any point in the window? The presets on this screen.
- •RS Rating. Where does it rank against every other stock? The number that sorts the list.
- •Strength on a down day. Is it holding up while the market falls today? Oliver Kell’s screen and Ben Bennett’s Down Day RS in the Top Traders presets.
Deepvue’s guide to five ways to screen for relative strength walks through each approach, and how to use the relative strength line covers reading the overlay on the chart. The trader specific versions are kept in the stock screener by trader.
When Relative Strength Should Be Ignored
A relative strength stock screener returns leaders. Not every leader is a buy.
- •Extended from every average. Strength that has already run leaves no place for the stop.
- •Strong because the sector collapsed. A stock flat while its industry fell 30% has a new RS high and no buyers. Check the absolute chart too.
- •Strength on fading volume. An RS line rising while relative volume and the up/down ratio fall is a leader running out of sponsors.
- •A one day spike. One big gap can print an RS new high over one month. The 3 and 6 month versions filter those out.
- •Deep in a bear market. Relative strength names hold up best in a correction, and they still fall. Size down until the index turns.
Who Gets the Most From This Screen
- •Growth traders in the O’Neil tradition who start every scan with relative strength
- •Swing traders who want leaders identified before the breakout rather than after it
- •Anyone who has bought a laggard in a strong market and watched it go nowhere
- •Traders who use down days to find what is being accumulated
- •Holders who want the RS line watched on their positions as an early exit signal
Pricing
$49 a month on a single plan, nothing gated.
- •The three Relative Strength New Highs presets and every other screen, editable in a copy
- •The RS Rating and 55 more proprietary scores, as columns, filters and chart ratings
- •RS line and Mansfield RS overlays, watchlists, alerts and layouts, from the screen result to the stop
- •Streaming quotes through the session, so strength on a down day shows while the day is still happening
The comparable platform, MarketSurge, is $149 a month.
New accounts include a setup call, introductory emails and weekly webinars that each take one module apart.
Find the Stocks the Market Has Already Chosen
The market ranks every stock every day, and relative strength is the ranking. A relative strength stock screener reads it for you, and the RS line new high presets pull out the names whose rank just improved, which is where the next leaders come from.
Signal driven screens like this one have their home in stock screener by indicator. Chart formations are catalogued in stock screener by pattern, and screens defined by a trading method in screener by strategy.
Run the RS New Highs screen tonight
↑ Back to contentsFrequently Asked Questions
What is relative strength in stocks?
Relative strength in stocks is a stock’s price performance compared to the market, usually as the ratio of the stock to an index plotted as a line. A rising line means the stock is outperforming. Deepvue computes it for every stock and screens for RS line new highs over 1, 3 and 6 months.
Is relative strength the same as RSI?
No, relative strength is not the same as RSI. Relative strength compares a stock to the market. RSI, the relative strength index, compares a stock to its own recent gains and losses to flag overbought or oversold. Deepvue’s relative strength screener and RS Rating measure the first, not the second.
What is an RS line new high?
An RS line new high is the point where a stock’s ratio to the index reaches its highest level of a lookback window, meaning the stock is outperforming the market more than at any time in that period. Deepvue ships presets for RS line new highs over 1 month, 3 months and 6 months.
What is a good RS Rating for a stock?
A good RS Rating for a stock is 80 or higher, which puts it in the top fifth of the market, and the biggest winners usually carry ratings above 90 when they start their runs. In Deepvue the RS Rating is a 1 to 99 column you can filter and sort on.
How is relative strength calculated?
Relative strength is calculated by dividing the stock’s price by the index level and tracking the result over time; the RS Rating then ranks that performance against every other stock, with recent months weighted more heavily. Deepvue runs both calculations daily so they are ready as filters.
What does Deepvue’s relative strength screener test?
Deepvue’s relative strength screener tests for stocks and ADRs whose RS line has just made a new high over the chosen window, 1, 3 or 6 months, meaning they are outperforming the market more than at any point in that period. Duplicate a preset to add RS Rating, base or volume conditions.
Which relative strength window should I use?
The relative strength window to use depends on your holding period: 1 month for emerging leaders and short swings, 3 months for typical swing trades, 6 months for established leaders and position trades. Running all three Deepvue presets and trading the overlap is a common approach.
Does relative strength work in a falling market?
Yes, relative strength works in a falling market, and it is often most useful there, because a stock holding its highs while the index drops has nothing but demand behind it. Deepvue’s presets keep running on down days, and the Top Traders category adds screens built for exactly that read.
Can relative strength be used to sell?
Yes, relative strength can be used to sell. An RS line that fails to confirm a price new high, or rolls over while price holds, is distribution showing up in the ratio before the chart. Watching the RS line overlay on holdings in Deepvue gives that warning early.
What is Mansfield relative strength?
Mansfield relative strength is Stan Weinstein’s version of the measure: the stock to index ratio compared to its own moving average, plotted around a zero line so positive readings mean outperformance. Deepvue includes it as a chart indicator beside the standard RS line.
How can I find stocks with high relative strength?
You can find stocks with high relative strength by screening for an RS line new high or an RS Rating above 80, then checking the chart for a base rather than an extended run. Deepvue’s Relative Strength New Highs presets do the first part in one click, and the chart beside the results does the second.