The Breakout Stock Screener Built on Pradeep Bonde’s Momentum Burst Scans
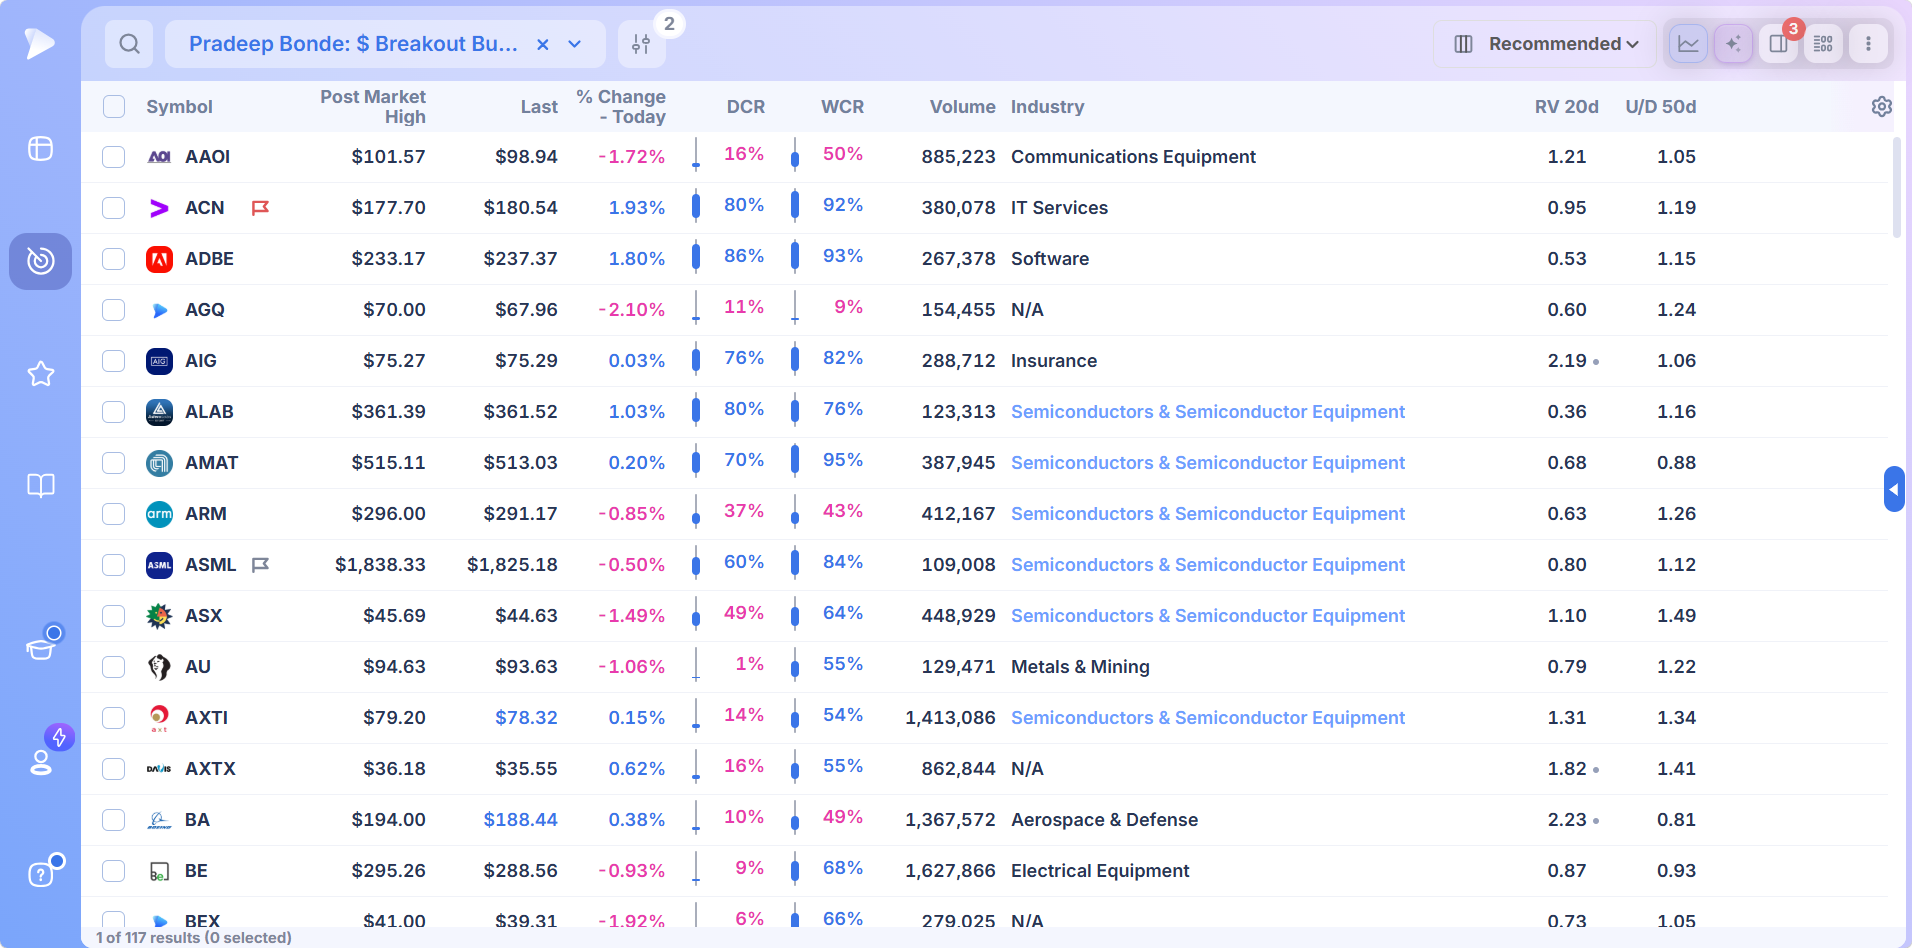
Deepvue’s breakout stock screener centers on the daily scans Pradeep Bonde, known as Stockbee, uses to catch momentum breakouts on the day they start. The 4% Breakout Bullish preset finds liquid stocks up 4% or more on higher volume than the previous session; the $ Breakout Bullish preset finds stocks above $3 trading more than $0.90 above their open on at least 100,000 shares. Bearish versions of both find the breakdowns. All six of Bonde’s screens load from Top Traders. $49 a month.
Key Takeaways
Most stocks spend most of their time doing very little. Then, on one session, one of them wakes up: the range expands, volume jumps above yesterday’s, and price closes well above where it started. Pradeep Bonde built a trading career around that day. His observation is that stocks tend to move in short, sharp bursts, and that the first day of the burst is visible to anyone running the right scan the evening it happens.
Deepvue’s screener carries those scans in Bonde’s own Top Traders folder. The bullish pair finds the breakouts, the bearish pair finds the breakdowns, and together they tell you both which stocks to look at and how healthy the market underneath them is.
- ✓A momentum breakout is a single day of range expansion on rising volume, and it often starts a burst that lasts a few days
- ✓The 4% scan measures the move from yesterday’s close; the $ scan measures it from today’s open, which filters out gaps that fade
- ✓Both bearish scans do double duty: short candidates and a daily breadth reading of how many stocks are breaking down
- ✓The best breakouts come out of quiet, narrow ranges, not after a stock has already run several days in a row
- ✓Momentum bursts are short, so the exit plan matters as much as the entry
- ✓One $49 a month plan includes Bonde’s six screens along with live data, charting, watchlists and alerts
What Is a Breakout in Stocks?
A breakout is a move that takes a stock out of the range it has been trading in, usually on volume heavy enough to show that new buyers have arrived. The word covers two quite different events, and the screens you need depend on which one you trade.
- •Base breakouts. Price clears a well defined level after weeks or months of consolidation: a prior high, a pivot, an all time high. The breakout is about where the stock is.
- •Momentum breakouts. A stock that has been quiet suddenly expands its range and volume in one session, wherever that happens on the chart. The breakout is about what the stock did today.
Bonde’s scans are built for the second kind. They do not care whether the stock is at a 52 week high; they care that it moved decisively today on more participation than yesterday, because that is how a momentum burst begins.
Pradeep Bonde’s Four Breakout Scans
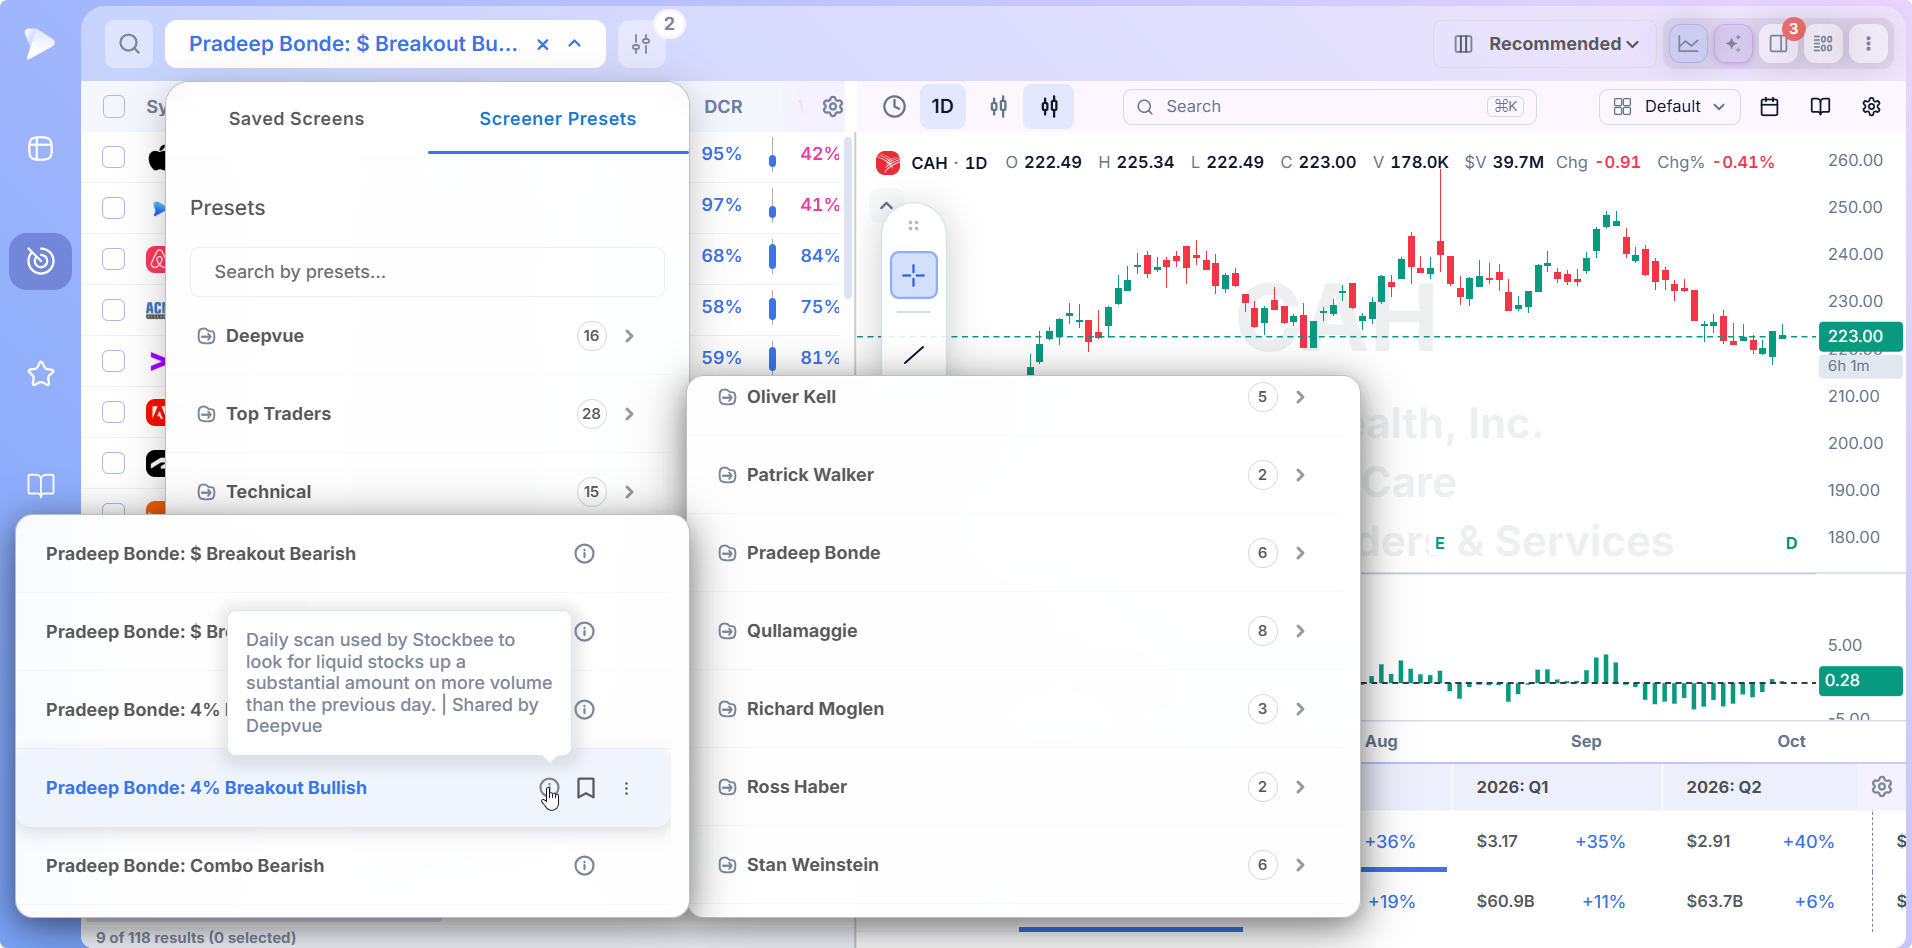
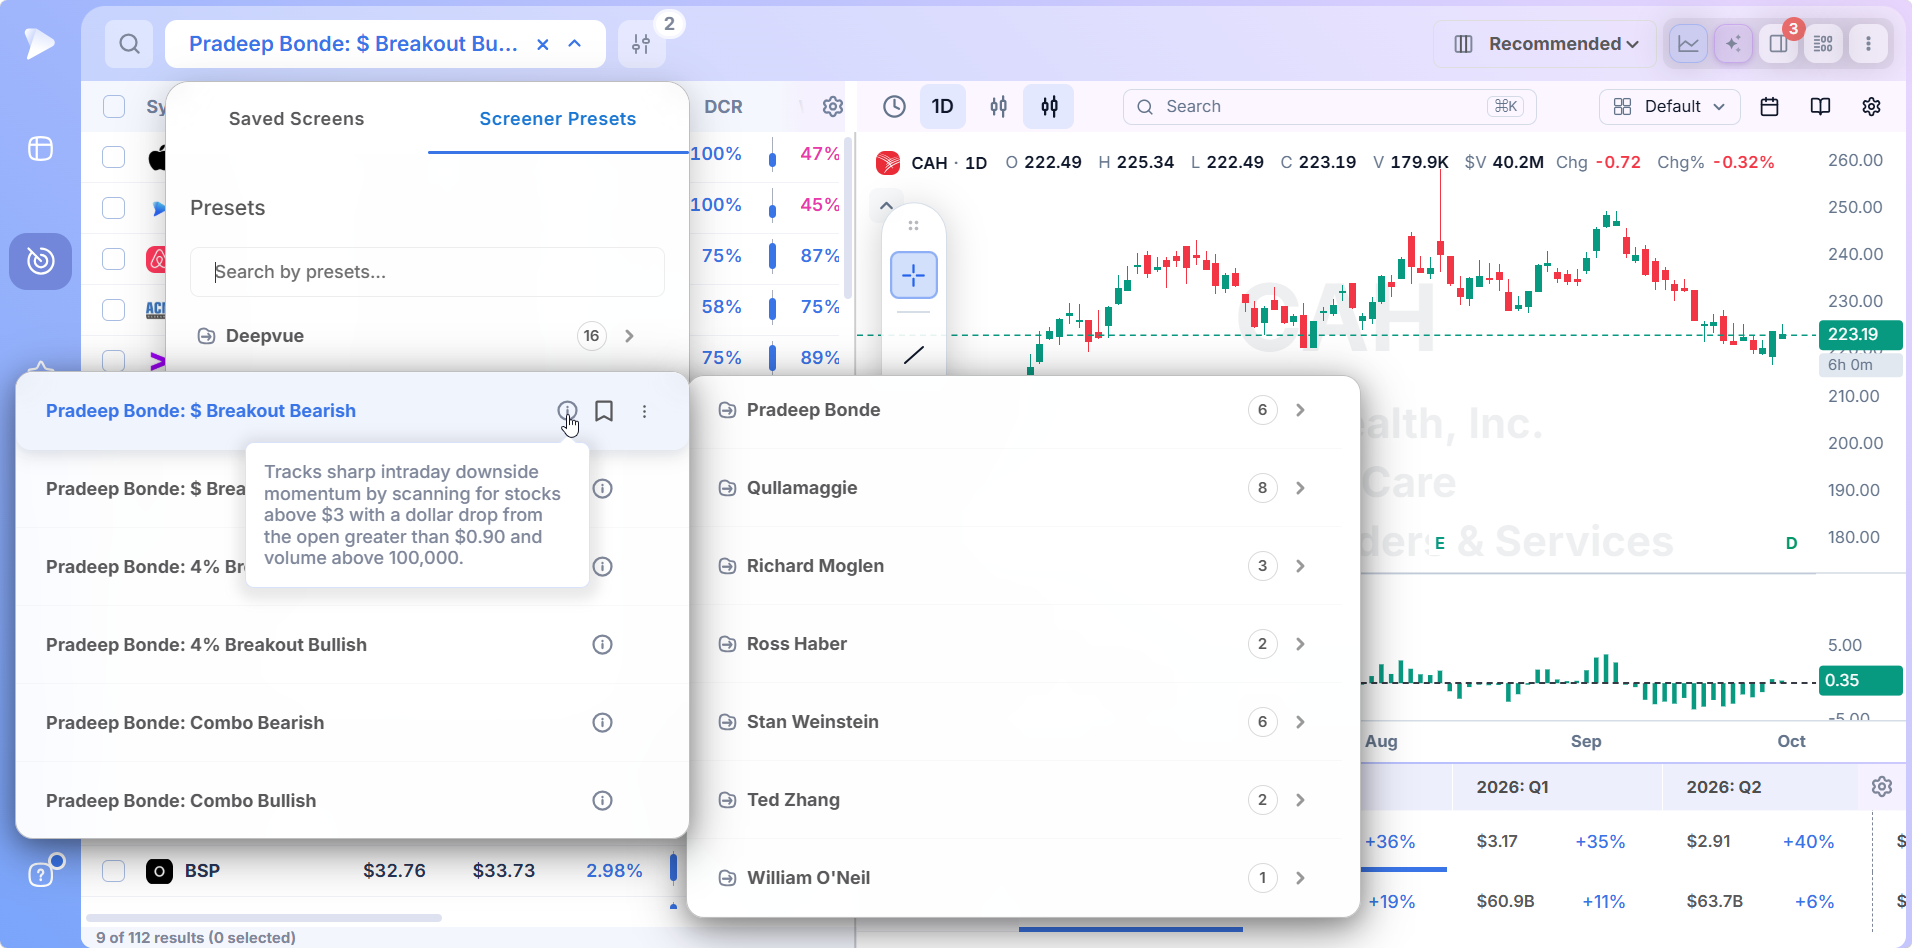
The definitions below are the ones shown in the app when you hover each preset.
| Preset | What it scans for | What it tells you |
|---|---|---|
| 4% Breakout Bullish | Liquid stocks up a substantial amount, 4% per the name, on more volume than the previous day | A likely first day of an upside momentum burst |
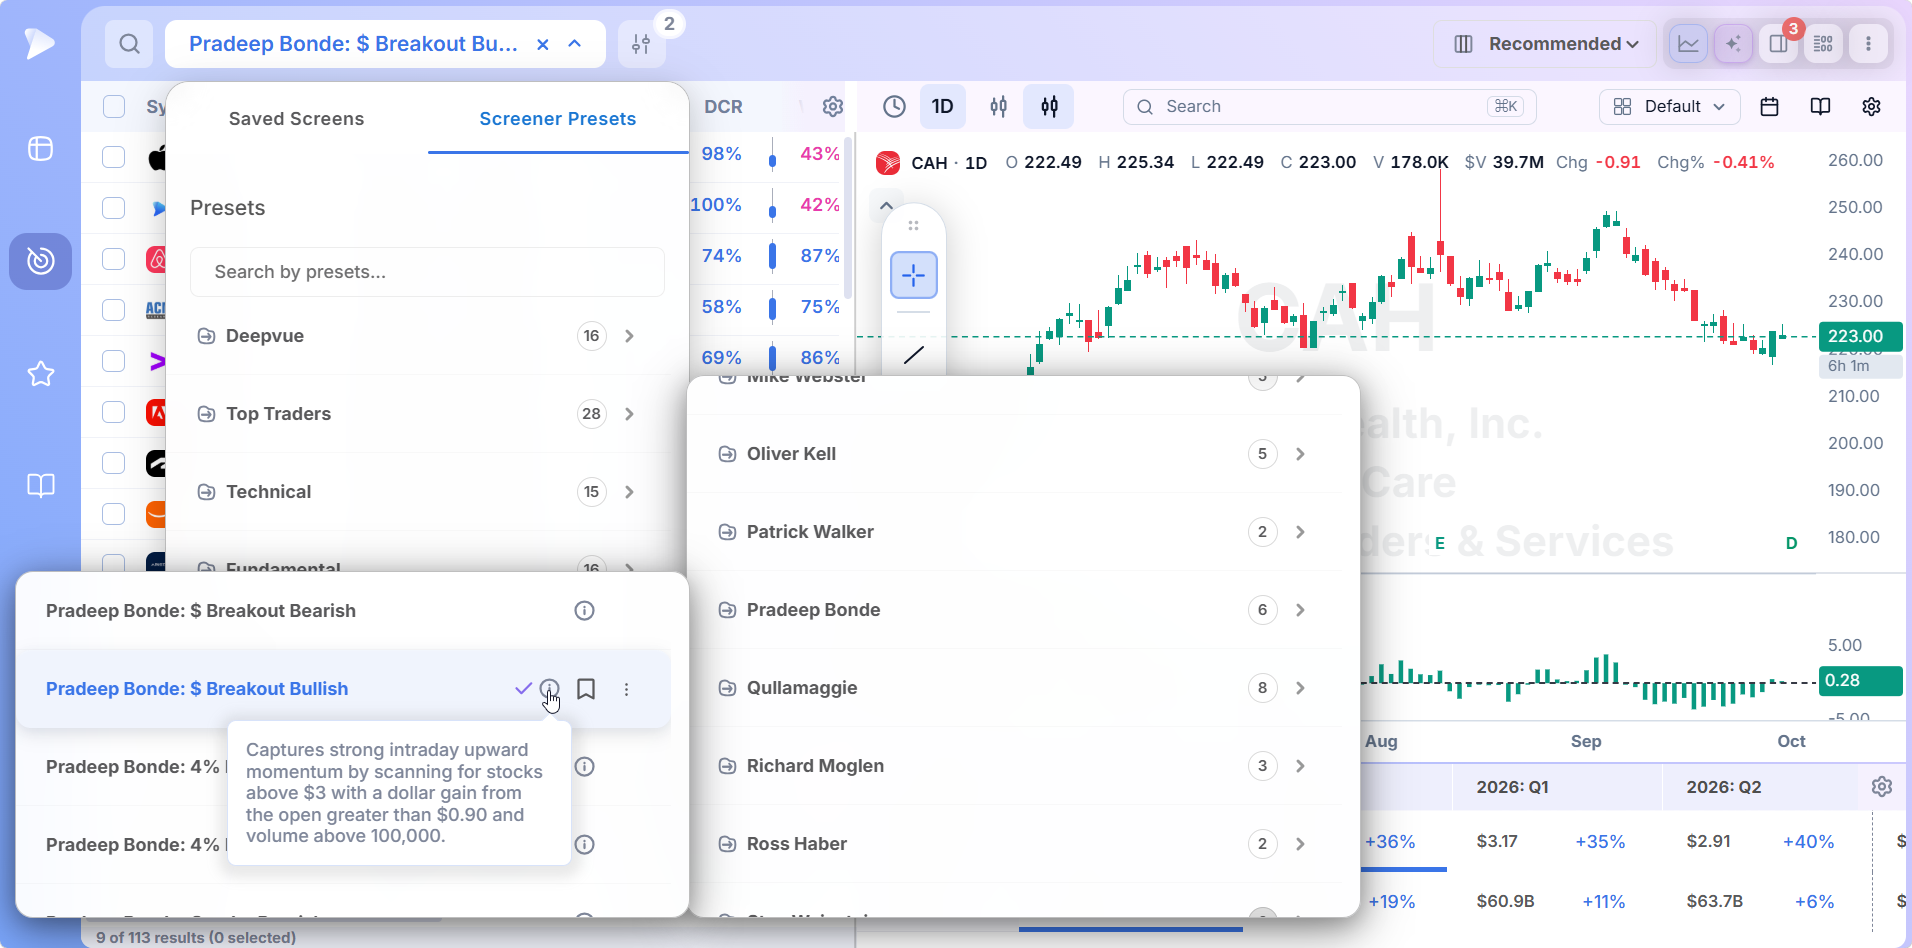
| $ Breakout Bullish | Stocks above $3 with a gain from the open greater than $0.90 and volume above 100,000 | Strong intraday buying, measured from the open rather than the prior close |
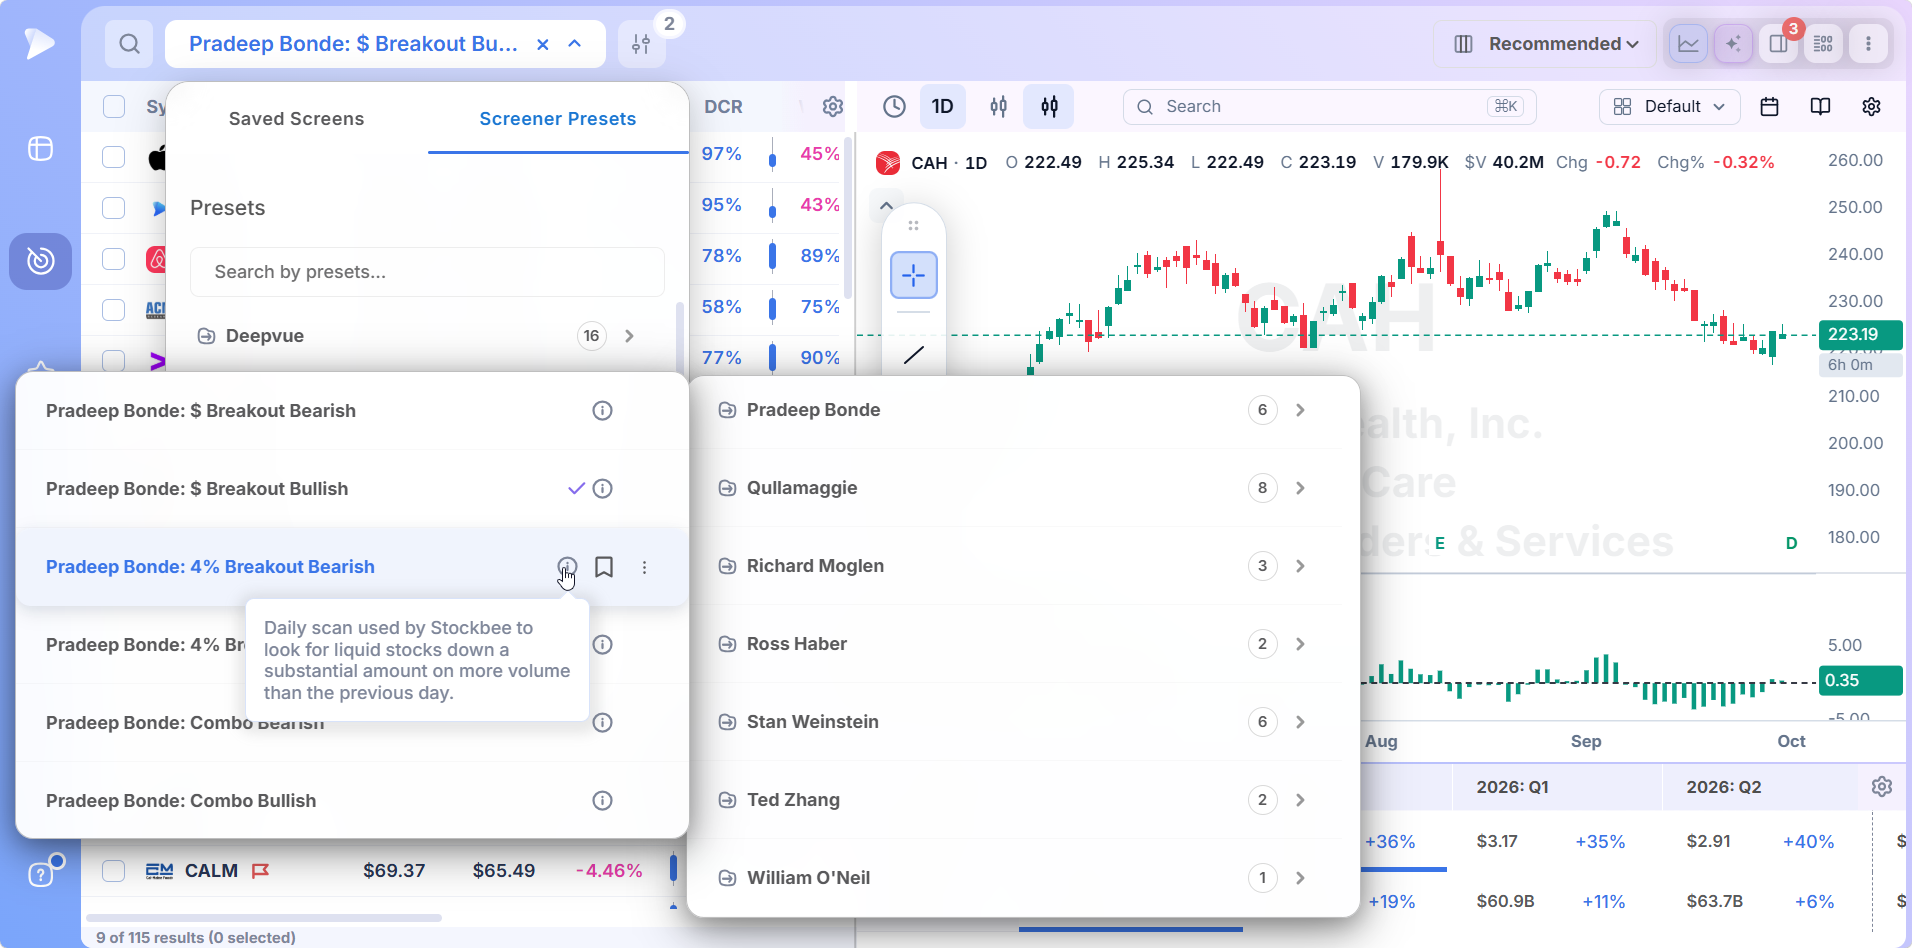
| 4% Breakout Bearish | Liquid stocks down a substantial amount on more volume than the previous day | Breakdowns, short candidates and a daily breadth count |
| $ Breakout Bearish | Stocks above $3 with a drop from the open greater than $0.90 and volume above 100,000 | Sharp intraday selling in names that opened firm |
Bonde’s folder also holds two combination screens, Combo Bearish among them, which group conditions from the individual scans.
The 4% Breakout: Today Against Yesterday
The preset description calls it the daily scan Stockbee uses to look for liquid stocks up a substantial amount on more volume than the previous day. The comparison to yesterday is the subtle part.
Most volume filters compare today with a long average, which rewards stocks that are always busy. Bonde’s test asks a narrower question: is today busier than yesterday while price jumps? That catches the transition from quiet to active, the exact moment a burst begins.
Using a percentage keeps the scan fair across price levels. A 4% day is ordinary for a small, volatile company and remarkable for a mega cap, which is why the list leans toward faster moving names and why the dollar scan exists alongside it.
The $ Breakout: Strength Measured From the Open
From the description: captures strong intraday upward momentum by scanning for stocks above $3 with a dollar gain from the open greater than $0.90 and volume above 100,000. Two design choices matter.
Measuring from the open means a stock that gapped up and then faded cannot qualify, only one that kept climbing after the bell. And a fixed dollar threshold favors higher priced stocks, where a 4% day is rare but a steady intraday advance of a dollar or more still signals real buying.
The Bearish Scans: Breakdowns and Breadth
The bearish presets mirror the bullish ones: stocks down a substantial amount on more volume than the day before, and stocks falling more than $0.90 from the open on at least 100,000 shares. They are useful in three ways.
- •They surface short candidates for traders who work both sides.
- •They flag holdings breaking down with conviction, often before the damage shows on a weekly chart.
- •And they supply half of a breadth reading, since the number of stocks breaking down each day, set against the number breaking out, says a great deal about the market.
Who Is Pradeep Bonde?
Pradeep Bonde is a trader and educator who runs Stockbee, one of the longest running communities for momentum swing traders. He is known for the momentum burst, his name for the short, sharp moves that follow a breakout day, and as the originator of the episodic pivot, the catalyst gap later popularized by Kristjan Kullamägi, whose version is explained in the Qullamaggie episodic pivot screener.
His market monitor, a daily breadth table, famously tracks how many stocks broke out 4% up and 4% down each session.
Why Momentum Breakouts Are Easy to Miss
A momentum burst is short by nature. If the move lasts three to five sessions, then learning about it on day two means half of it is gone, and learning about it on day four means you are buying from the people who bought on day one.
The breakout has to be found the day it happens, which means a scan run every evening or during the session, not a stock that shows up on a news site after its best days.
The other difficulty is volume. A stock can rise 4% on a quiet day because a few buyers pushed a thin book, and that move rarely lasts. Bonde’s condition that volume exceed the previous day’s is what separates a burst with participation behind it from noise, and it is the condition most generic top gainer lists leave out.
Why Deepvue Is the Best Breakout Stock Screener
Deepvue gives a breakout trader Bonde’s definitions exactly as he uses them, the columns that separate strong breakouts from weak ones, and a chart beside every result, with streaming data so the dollar scans fill during the session.
Bonde’s Folder in Top Traders
Inside Screener Presets, Top Traders lists each trader as a folder with a count beside it. Pradeep Bonde’s holds six screens: the four breakout scans and the two combinations. Every one has an info icon with its definition, so you know what the list means before it loads.
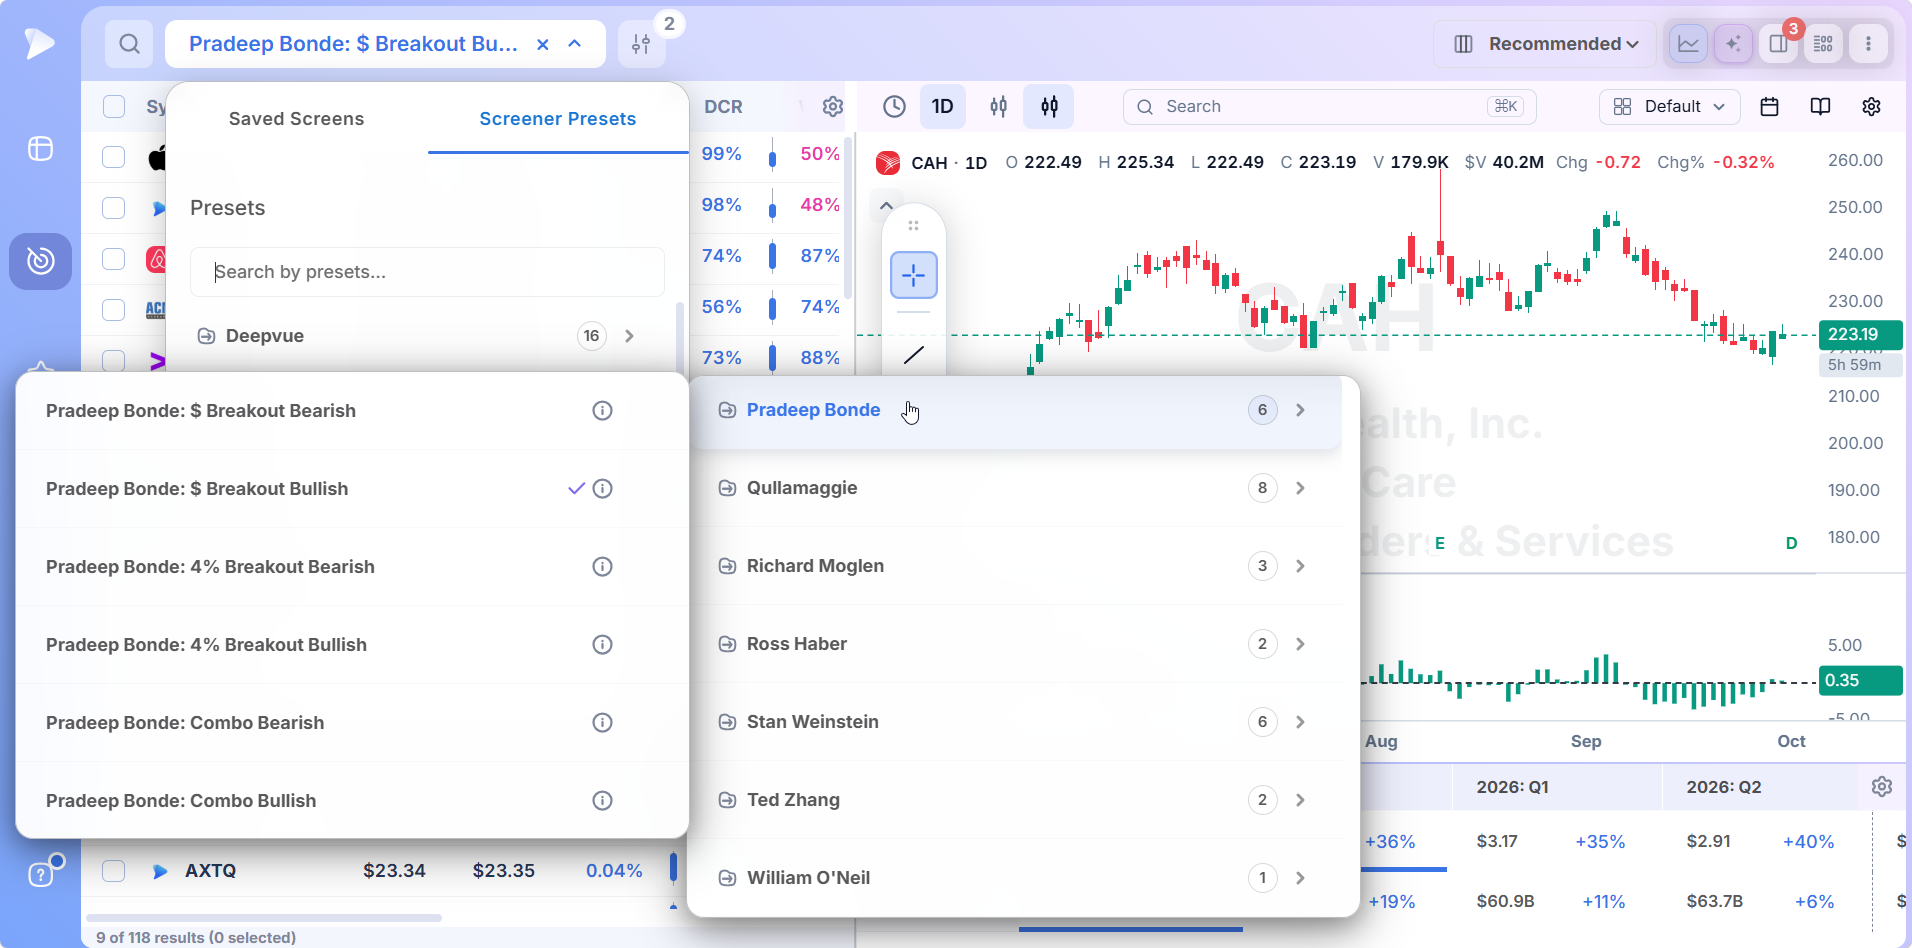
The shipped presets cannot be edited, which keeps Bonde’s thresholds intact. A saved copy is fully editable.
Rank the Day’s Breakouts
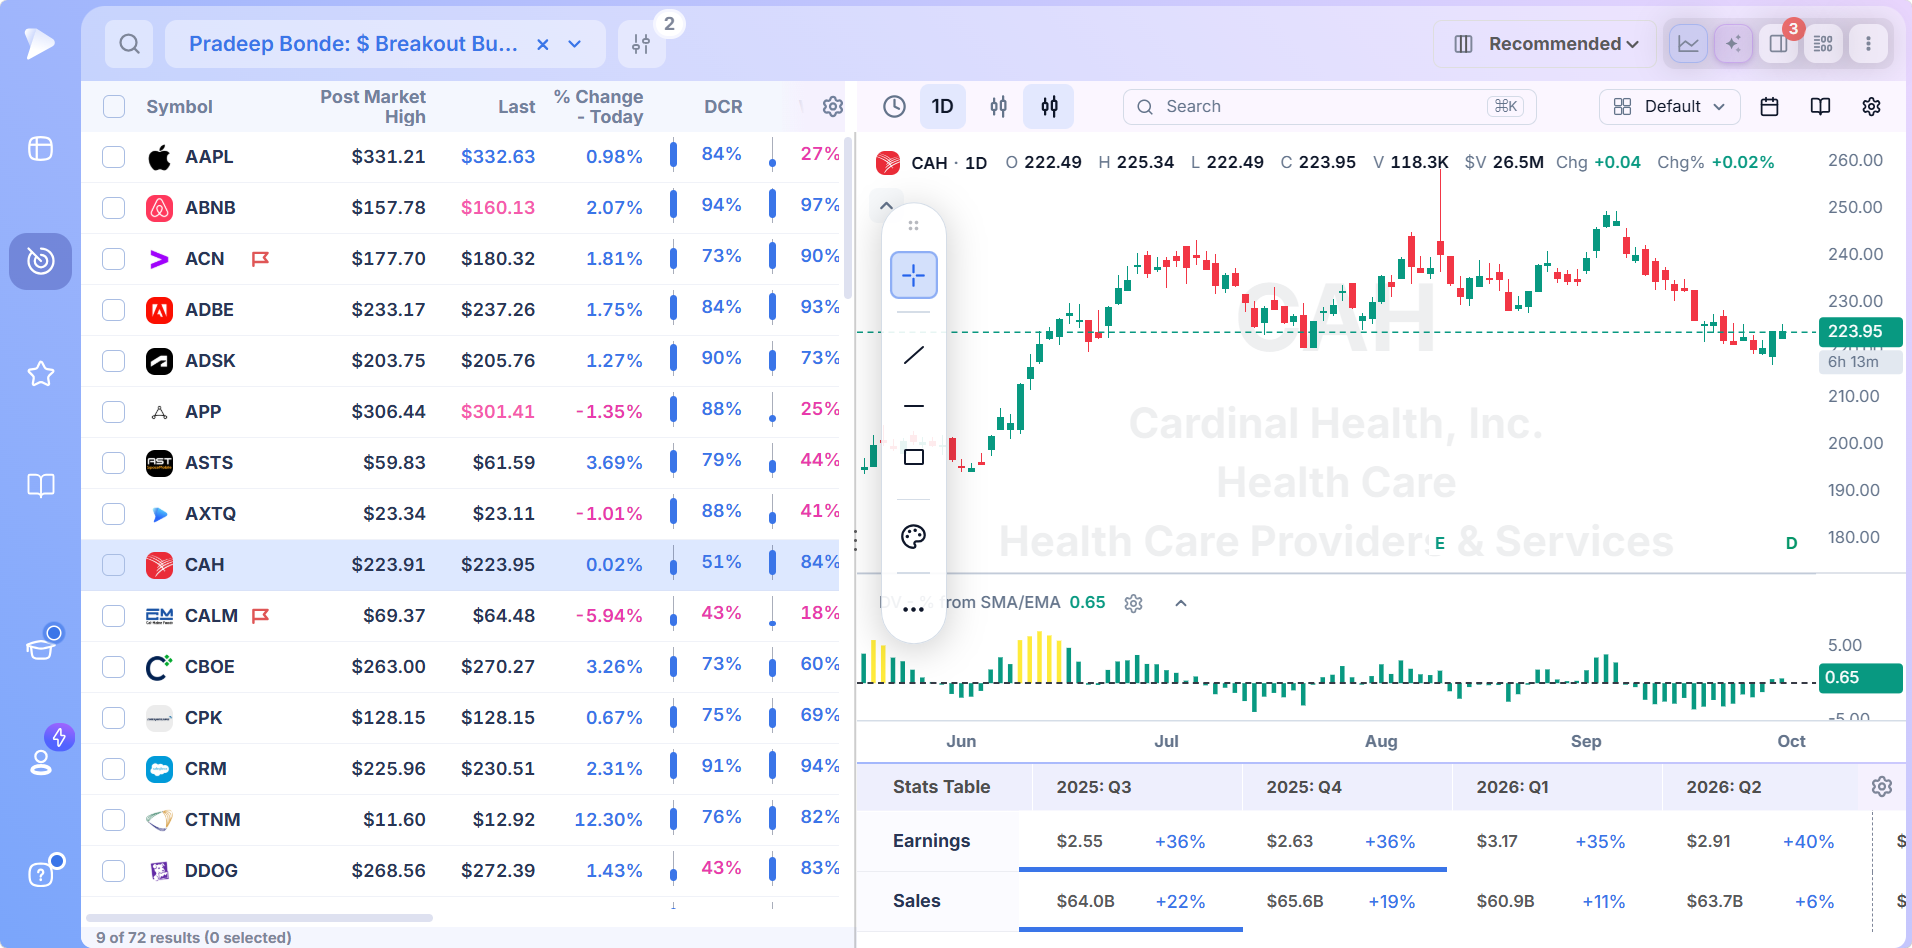
A breakout scan on an active day returns plenty of names, and the columns decide which deserve a chart. The daily closing range comes first: a breakout that closed in the top fifth of its range held its gains into the bell, while one that closed mid range met sellers.
Twenty day relative volume shows how unusual the day’s trade was for that stock. The industry column matters more than it looks, because when several breakouts come from the same group on the same day, money is rotating into it.
Sort by daily closing range, then scan the industry column for clusters. That two step pass usually narrows a long list to a handful.
Check What Came Before the Breakout
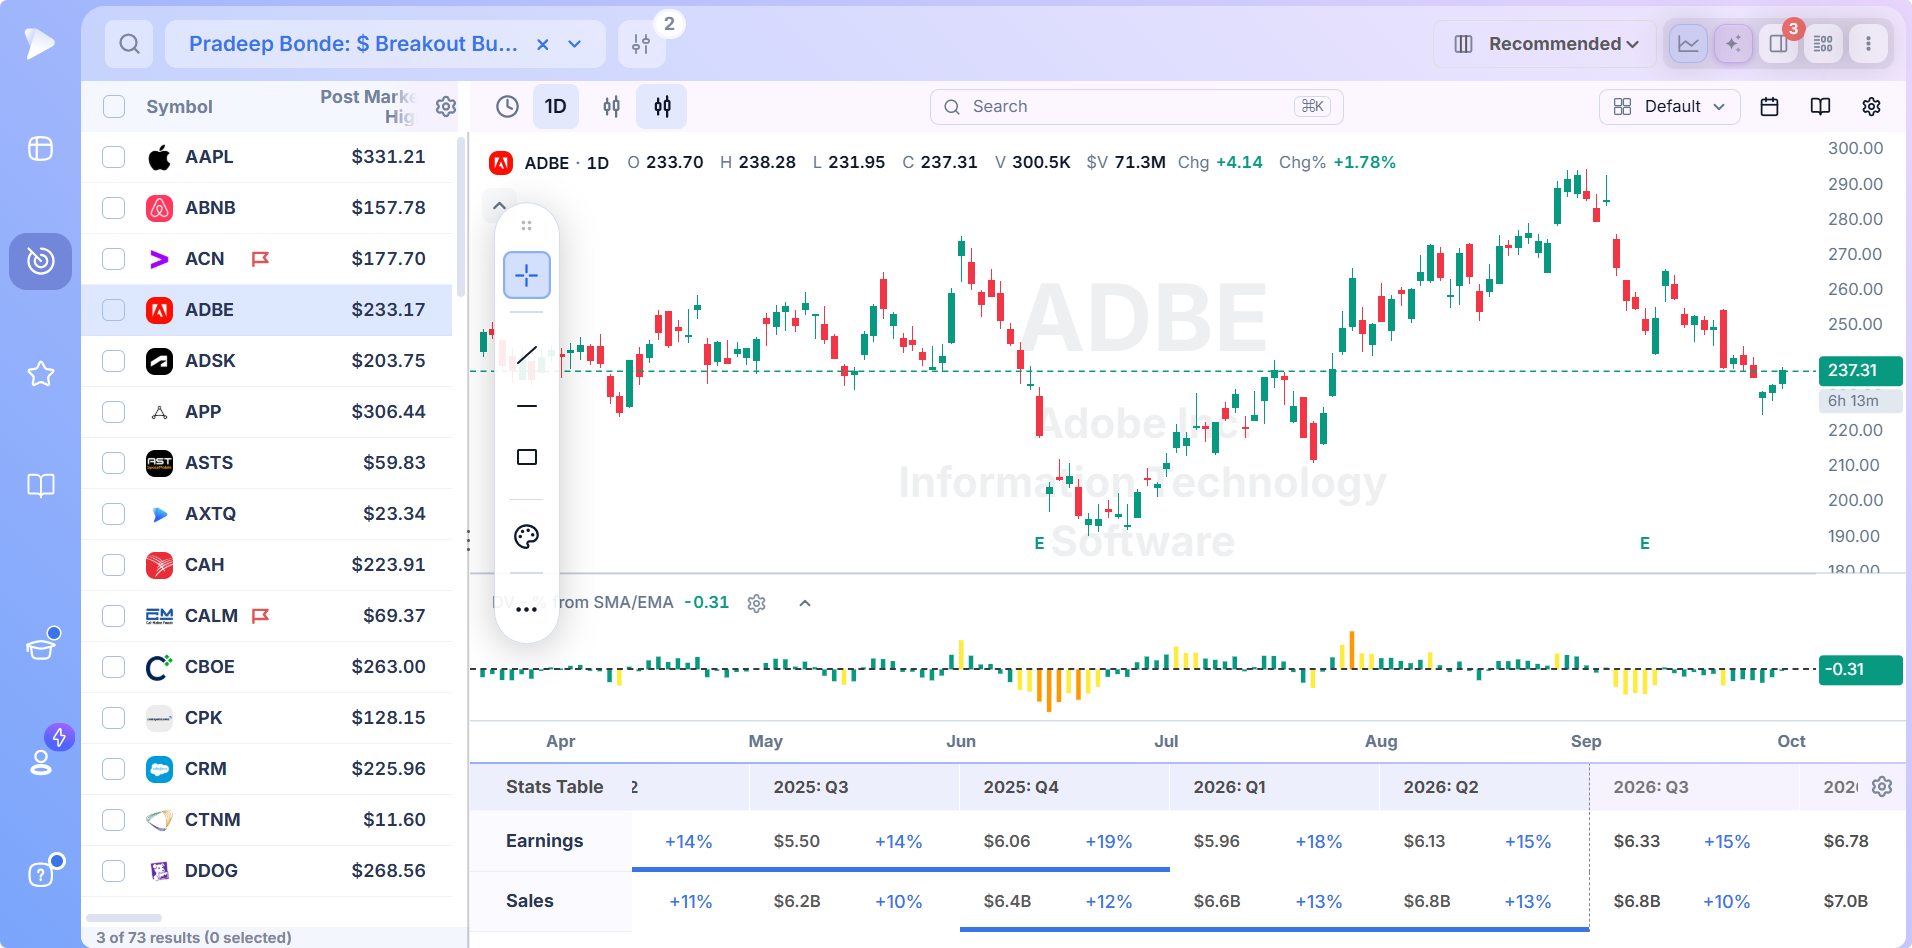
Selecting a result loads its chart next to the list. For a momentum breakout, the bars before the breakout day matter as much as the breakout itself. Bonde favors stocks coming out of a quiet stretch: narrow ranges, low volume, an orderly pullback or a flat consolidation. A 4% day after three prior up days is a stock getting extended, not a stock starting a burst. The quarterly stats beneath the candles add the business side, useful when the breakout arrives right after a report.
Alert the Continuation, Size the Risk
Breakouts found after the close are usually traded the next day. Put the best names on a watchlist and create an alert just above the breakout day’s high so you are notified if the burst continues. When it triggers, the position size calculator sizes the position to a stop under the breakout day’s low.
How to Build Your Own Breakout Screen
Bonde’s scans are intentionally minimal, which leaves room to add the filters that suit your style.
Save a copy of the 4% Breakout Bullish preset to unlock its conditions.
Raise the liquidity floor so every result trades enough dollar volume for your position size.
Set a daily closing range minimum near 75%, leaving only breakouts that held into the bell.
Cap the gain over the prior week, such as under 5% before today, so the list holds day one of a burst rather than day four.
Require an uptrend underneath, such as price over a rising 50 day line, if you only want breakouts that go with the trend.
Run the bearish version beside it, and keep a daily tally of both counts as your own breadth gauge.
Or write it as a sentence in the AI Terminal: “stocks up at least 4% today on higher volume than yesterday, closing in the top 30% of the range, above the 50 day, up less than 5% over the prior week” produces the conditions, ready to adjust.
How to Trade Breakouts From These Scans
A breakout trading strategy built on momentum bursts differs from one built on base breakouts in one important way: the holding period is short, so every part of the plan is faster.
Enter Early in the Burst
The best entry is the breakout day itself or the day after, if the stock opens firm and trades above the breakout day’s high. Experienced momentum traders also buy in anticipation, taking a position in a stock on a narrow range day just before it expands. Entering on the third or fourth day of a burst turns a good setup into a late one.
Keep the Stop Tight
The low of the breakout day is the natural stop. If the stock gives back the entire range of the day that was supposed to start the move, the burst has failed. Tight stops are what make the approach work: many breakouts fail, but when the losses are small, the few that run carry the results.
Take Profits Into Strength
Momentum bursts tend to last a handful of sessions, so the default is to sell into the move rather than hold through the pullback that usually follows. A common approach is to lighten up after two or three strong days and trail what remains tightly. The stock can always be bought again when it sets up for the next burst.
Momentum Breakouts vs Base Breakouts
Both are breakouts. They reward different timeframes and need different screens.
| Momentum breakout | Base breakout | |
|---|---|---|
| What triggers it | One day of range and volume expansion | Price clearing a prior high after a long consolidation |
| Typical holding period | A few days | Weeks to months |
| Where the stop goes | Low of the breakout day | Below the base or the breakout level |
| Deepvue screens | Bonde’s 4% and $ breakout scans | Green line breakouts, VCP, 52 week highs |
For all time high breakouts after a long rest, the green line breakout screener covers Dr. Wish’s rules on the monthly chart. For a broader walk through base and gap breakouts, see 5 screens to find breakout stocks. Traders who hold momentum bursts longer often pair these scans with the swing trading stock screener.
When a Breakout Should Be Ignored
A false breakout is a stock that clears the scan and then gives the move straight back. The warning signs are usually visible on the day:
- •It is the fourth day up, not the first. Extended stocks breaking out again are closer to the end of a burst than the start.
- •It closed weak. A 4% gain that closed near the middle or bottom of its range means sellers were waiting.
- •The volume was thin in absolute terms. More volume than yesterday means little if yesterday was nearly silent and the stock barely trades.
- •It ran into overhead supply. A breakout straight into a recent high or a heavy area of prior trading tends to stall.
- •Breadth is negative. When the bearish scans are consistently returning more names than the bullish ones, breakouts fail at a much higher rate.
Who Gets the Most From This Screen
- •Momentum swing traders who hold for days and want the first day of each burst
- •Stockbee followers who want Bonde’s scans running without rebuilding them
- •Traders who trade both directions and need breakdowns as well as breakouts
- •Anyone who tracks market breadth and wants the daily up and down counts on screen
- •Base breakout traders looking for a faster second strategy alongside their main one
Pricing
$49 a month buys the whole platform on one plan.
- •All six of Pradeep Bonde’s screens and the rest of Top Traders, editable from a saved copy
- •Closing range, relative volume and industry columns, for ranking a busy day’s breakouts in seconds
- •Split view charts with quarterly stats, to judge the bars before the breakout
- •Streaming data across 568 fields, so the dollar scans fill while the move is under way
MarketSurge, the main alternative for breakout traders, is $149 a month.
New accounts include a setup call, introductory emails and weekly webinars that each take one module apart.
Find the First Day, Not the Fourth
The profit in a momentum burst is front loaded, which makes timing the whole game. Bonde’s scans find the day a stock wakes up, the columns tell you which of those days had real conviction behind them, and the bearish versions keep you honest about the market you are trading in. Run them every evening and the breakouts come to you instead of the other way around.
For other strategy based screens, start at stock screener by strategy. Bonde’s folder and those of 27 other traders are collected at stock screener by trader. Formation based screens are indexed at stock screener by pattern, measure based screens at stock screener by indicator and premarket and intraday scans at stock screener by market timing.
↑ Back to contentsFrequently Asked Questions
What is a breakout stock screener?
A breakout stock screener finds stocks moving out of their recent range on strong volume, either by clearing a price level or by expanding sharply in a single session. Deepvue’s version is built on Pradeep Bonde’s 4% and dollar breakout scans, in bullish and bearish forms.
Which stock screener is best for identifying breakouts?
The stock screener best suited to identifying breakouts compares today’s price move and volume with yesterday’s, shows the closing range so weak breakouts can be dropped, and puts a chart next to every result. Deepvue does that with Bonde’s breakout presets for $49 a month.
How do you scan for breakout stocks?
You scan for breakout stocks by requiring a meaningful move, such as 4% or more, on volume above the previous day’s, with a minimum price and liquidity, then reviewing the results for strong closes and a quiet setup beforehand. Deepvue’s 4% Breakout Bullish preset runs that scan in one click.
What is the best indicator for breakout stocks?
The best indicator for breakout stocks is volume, because a breakout on rising volume shows new buyers arriving while a breakout on light volume often fails. Closing range is a close second, since a breakout that holds into the close is far more likely to continue.
What is a 4% breakout?
A 4% breakout is Pradeep Bonde’s daily scan for liquid stocks up 4% or more on higher volume than the previous session. It is designed to catch the first day of a momentum burst, and Deepvue ships it as a preset alongside a bearish version for stocks down 4% on rising volume.
What does the $ Breakout Bullish screen look for?
The $ Breakout Bullish screen looks for stocks above $3 that are trading more than $0.90 above their opening price on volume above 100,000 shares. Measuring from the open means gap ups that fade during the session do not qualify.
What is a momentum burst?
A momentum burst is Pradeep Bonde’s term for a short, sharp move in a stock that typically plays out over three to five sessions after a breakout day. Traders buy early in the burst, keep the stop at the breakout day’s low and take profits into strength.
Who is Pradeep Bonde?
Pradeep Bonde is the trader and educator behind Stockbee, known for the momentum burst and as the originator of the episodic pivot. Six of his screens ship in Deepvue’s Top Traders presets, including the 4% and dollar breakout scans.
What is the Stockbee market monitor?
The Stockbee market monitor is Pradeep Bonde’s daily breadth table, which among other readings counts how many stocks broke out 4% up and 4% down each session. Deepvue’s bullish and bearish 4% breakout presets produce the same two lists, so you can track the balance yourself.
Is breakout trading profitable?
Breakout trading can be profitable when losses on failed breakouts are kept small and position sizes are consistent, because a minority of breakouts produce most of the gains. It performs best when market breadth is positive and struggles when more stocks are breaking down than breaking out.
What is a false breakout?
A false breakout is a move out of a range that quickly reverses back into it, trapping buyers who entered on the break. Weak closes, thin volume, extended stocks and poor market breadth are the most common warning signs.
What is the difference between a breakout and a breakdown?
The difference between a breakout and a breakdown is direction: a breakout is a decisive move up out of a range on rising volume, and a breakdown is the same move to the downside. Deepvue’s bearish breakout presets are breakdown scans.