The VCP Stock Screener Built for Volatility Contraction Traders
A VCP screener has one job, and volatility contraction is a pattern you have to catch before it resolves. By the time a chart is obviously tight and obviously ready, the pivot is already behind you. That timing problem is what a VCP screener exists to solve: surface names while they are still building, not after they have gone.
Deepvue is a research platform for growth stock and momentum traders who read price and volume together. The screener exposes 1,152 active data points as filterable conditions, 568 of them streaming live during market hours, alongside 150+ presets and an AI terminal you can talk to in plain English. Pair it with charts, watchlists, and the AI terminal and the whole scan to setup loop happens without leaving the page.
Why Deepvue Is the Best VCP Stock Screener
Most platforms make you choose, which is why the search for the best VCP pattern stock screener usually ends in a compromise. Either you get a simple screener with shallow data, or you get a deep screener that takes an afternoon to configure. Deepvue is built to give traders both the shortcut and the control.
A Volatility Contraction Preset, Ready to Run
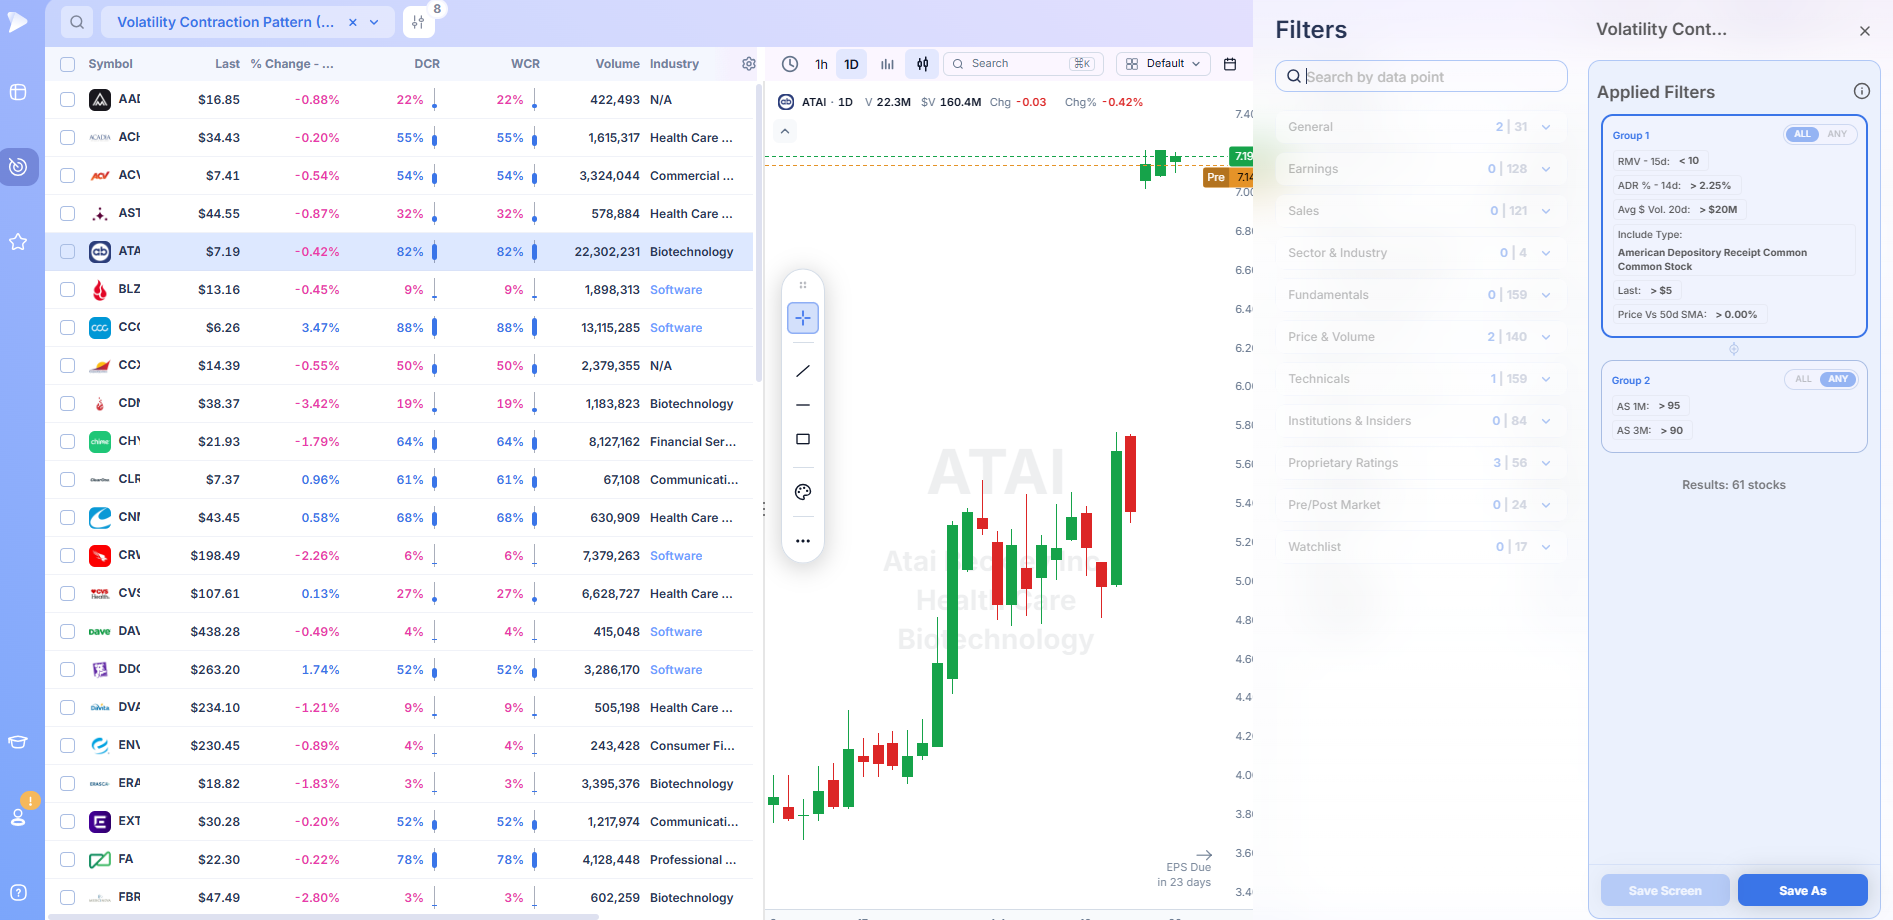
Deepvue’s answer to the best VCP stock screener question starts here: the platform ships a preset named Volatility Contraction in the Technical category, described on the platform as tight basing with low ATR, primed for expansion. It runs in one click with no configuration. For traders who want a starting point rather than a blank filter panel, that is the fastest path from open to shortlist.
It is also a fork point. Run it, see what comes back, then adjust the tightness threshold or bolt on your own earnings requirement and save the result as a named screen.
Minervini’s Own Criteria, Built In
Among the 80 Top Traders presets is Mark Minervini – Trend Criteria, described as SEPA-style alignment of stage, relative strength, and base structure.
Since Minervini is the trader most associated with the VCP concept, running his trend template as a first pass gives you a universe that already satisfies the leadership conditions a VCP requires, before you layer contraction filters on top.
Other presets in that library speak to adjacent parts of the same workflow: Deepvue Leaders for relative strength leadership across the market, Oliver Kell – Strength On Down Day for names holding up when the market gives back, and Mike Webster – Swing Trading List for shorter hold setups.
A Filter Builder That Handles Real Complexity
A serviceable VCP screen has multiple conditions that need to be true together, and often a few that only need one of several to be true.
Deepvue’s drag-and-drop filter builder uses named filter groups with ANY/ALL operators between them, so you can require all of your trend conditions while accepting any of three different tightness definitions. Numeric ranges, multi-select, text search, and checkbox conditions are all available. There is no formula bar and no syntax to learn.
Filter sets save as reusable named screens and organize into folders, and you can stack a preset on top of your own filters to layer strategies rather than rebuilding from scratch.
Live Data on the Fields That Matter
Volatility contraction resolves intraday. A pivot that clears at 10:15 on expanding volume is a different trade at 3:55. Deepvue streams 568 fields live over WebSocket during market hours, with cells flashing when values change, on a virtualized table that holds a thousand rows without slowing down. The 24 pre/post market columns extend the picture to extended-hours action, which matters when a tight base resolves on a gap.
Describe the Screen Instead of Building It
The Deepvue Terminal takes plain English. Type what you are looking for and it builds the screen, runs it, and returns the names. You can reference a watchlist with @, trigger actions with /, and pull from a curated Prompt Library. Usage is unbounded, with no daily quota and no per-query meter, so iterating on the wording of a contraction screen costs you nothing.
From Scan to Position Without Tab Switching
The screener feeds directly into the rest of the platform. A row becomes a chart in a split layout, a bulk add into a named watchlist, or a one-click alert that surfaces in the alerts panel. For a pattern where the entire edge is being present at the pivot, closing the gap between finding a name and monitoring it matters more than it does for most setups.
Who This Screener Is Built For
- ✓Growth stock traders using CANSLIM methodology who need chart structure and fundamental quality in the same scan
- ✓Swing and position traders holding trends that run several weeks to several months
- ✓Momentum traders who already know what a contraction looks like and want a faster path to the shortlist
- ✓Traders coming from legacy platforms who want live data and a filter builder that keeps up
- ✓Anyone running Minervini-style SEPA criteria who wants those conditions available as a preset
Pricing
Deepvue is one plan at $49 per month. That includes the full screener with all 1,152 data points, every preset, the drag-and-drop filter builder, unbounded terminal usage, charts, watchlists, and alerts. There is no separate screener tier and no per-feature upgrade path.
For reference, MarketSurge is $149 per month.
What Is a VCP Pattern?
VCP stands for Volatility Contraction Pattern. It describes a stock that pulls back in a series of progressively shallower corrections, each on lighter volume than the last, until supply dries up and the name breaks out of the final tight range.
Mark Minervini popularized the term as part of his SEPA methodology. The underlying idea is older than the label: a leading stock that has already run needs to digest that move, and the way it digests tells you who owns it.
Sellers who wanted out get flushed on the first correction. The second correction is shallower because fewer holders are willing to sell at that level. By the third or fourth, the float has passed into stronger hands and the daily ranges compress into something that barely moves.
That compression is the signal. The pattern is not really about geometry. It is about the transfer of ownership that the geometry reveals.
The Anatomy of a Contraction
A textbook VCP has a handful of measurable characteristics:
- •A prior uptrend. The pattern is a continuation setup. It only means something on a stock that has already demonstrated leadership.
- •Two to four contractions. Each pullback is shallower than the one before it. A common progression runs something like 25 percent, then 15 percent, then 8 percent.
- •Declining volume through each leg. Falling volume on each successive pullback is the confirmation that selling pressure is genuinely exhausting rather than pausing.
- •A tight final range. The last contraction is often single digits, sometimes just a few percent of price. Daily bars overlap heavily. The stock looks boring.
- •A volume expansion on the pivot. The breakout should arrive on volume well above the recent average. Without it, the move lacks the sponsorship to hold.
The final contraction is where most traders take their position. The tighter it is, the closer your stop can sit under the low of the range, which is the entire risk management argument for the pattern.
Why Contractions Form
Every correction inside a base is a supply test. On the first leg down, weak holders, momentum chasers, and traders sitting on gains all have reason to sell. Volume is heavy because a lot of stock changes hands.
On the second leg, that group is smaller. The people who wanted out at that price already got out. Volume drops. The pullback runs out of steam sooner and cannot fall as far.
Repeat this two or three more times and you arrive at a float held almost entirely by holders who have already declined several chances to sell. There is very little stock available. When demand shows up against that thin supply, price has to move sharply to find sellers, which is why VCP breakouts tend to expand in volatility immediately rather than drifting.
How a VCP Stock Screener Works
A VCP pattern screener cannot work the way a price screener works, because chart patterns do not have a single field you can filter on. There is no boolean column that says “this is a VCP.” What a VCP pattern screener does is approximate the pattern with quantitative conditions that describe its component parts, then narrow the universe to a chartable shortlist.
That means a good VCP pattern stocks screener is really doing four things at once, and the best VCP pattern stock screener is the one that lets you control all four.
Isolating Leadership
The pattern needs a prior advance to continue. Screening for contraction alone returns a lot of dead stocks that are quiet because nobody wants them. Relative strength filters, distance from 52 week high, and moving average alignment separate names that are consolidating a gain from names that are simply drifting.
Measuring Tightness
Volatility compression is the core condition. Average true range as a percentage of price, narrowing high-to-low ranges over recent sessions, and distance between price and its shorter moving averages all describe the same thing from different angles. Deepvue’s 276 Technicals category includes every moving average, oscillator, momentum, and trend metric on the platform, which gives you multiple independent ways to express tightness in a single screen.
Confirming Volume Dry-Up
Contraction without declining volume is a stock that has stopped moving, not a stock that has been absorbed. Relative volume and dollar volume conditions, drawn from the 145 Price & Volume data points, let you require that recent activity has fallen off against the stock’s own baseline.
Adding Fundamental Weight
Not every VCP trader screens fundamentals, but the CANSLIM lineage the pattern comes from does. Deepvue exposes 227 Earnings, 159 Fundamentals, and 126 Sales data points as filterable conditions, so you can require accelerating earnings or triple digit sales growth alongside the technical structure. That layer is what separates a base worth trading from a base that happens to look tidy.
Then You Look at the Chart
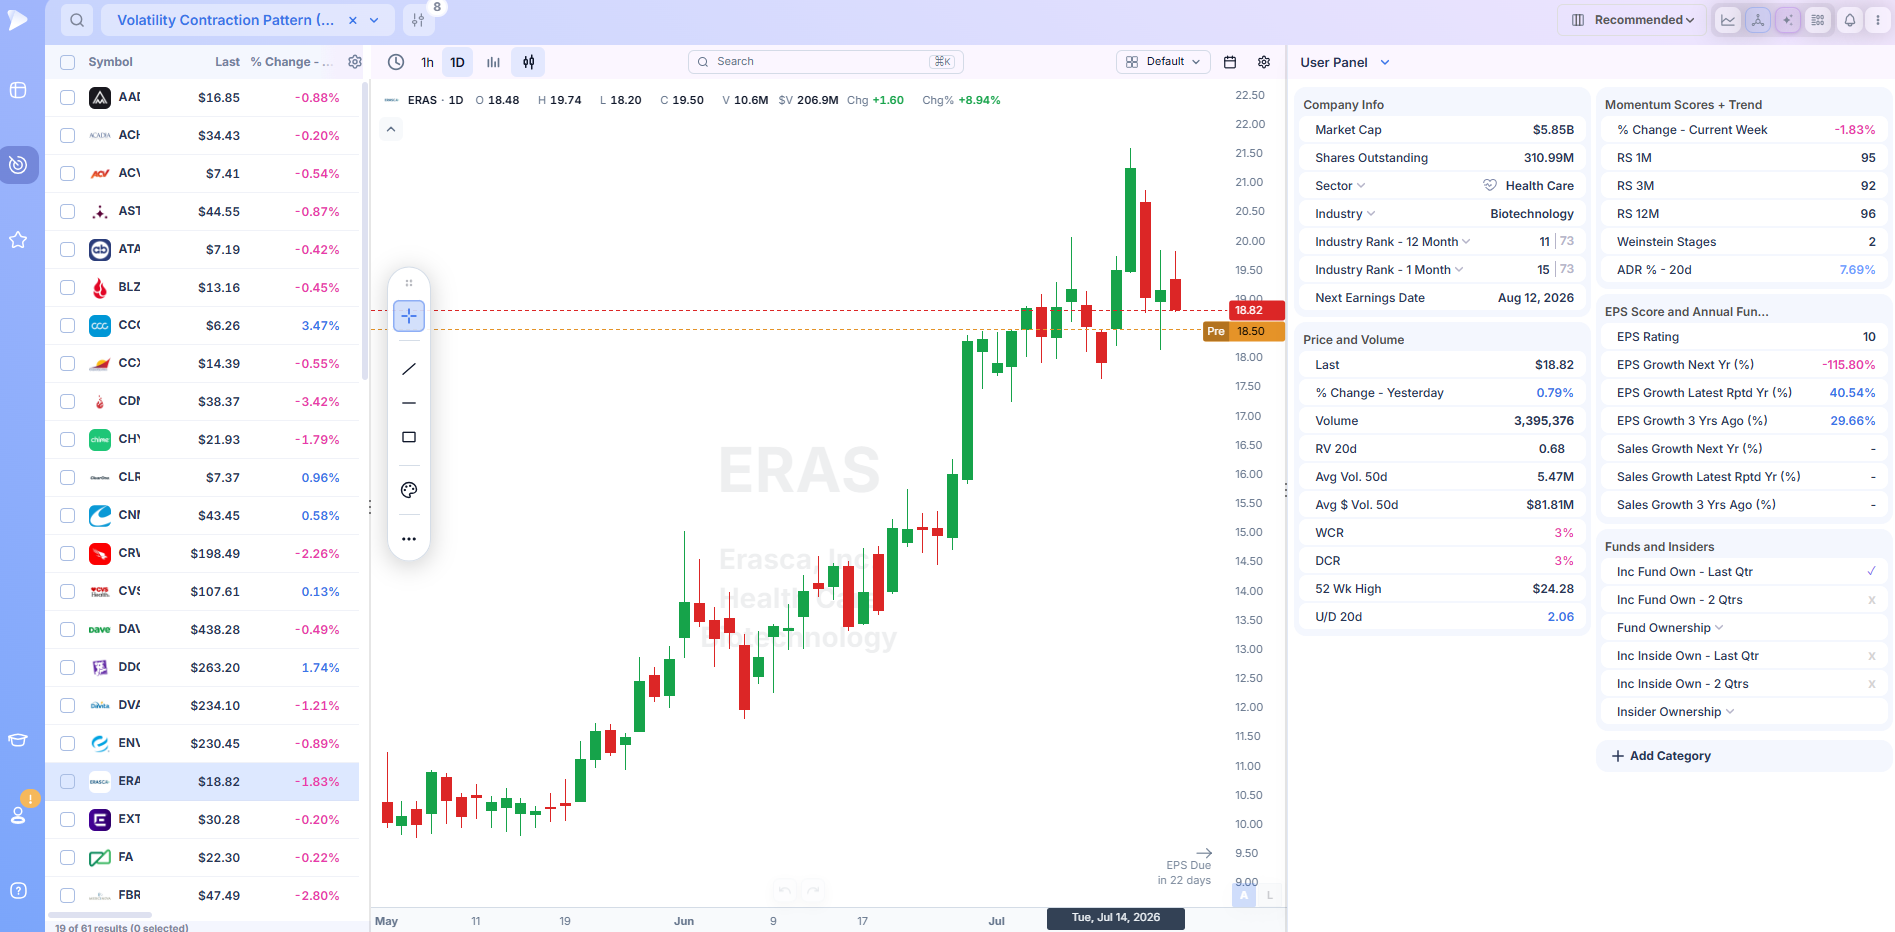
No screen replaces the chart. The output of any VCP pattern stocks screener is a shortlist, and you confirm the count of contractions, the shape of each pullback, and the quality of the pivot by eye. Deepvue is built for that final step: click any row to open the chart in a split layout, or switch to the mini-chart grid to read an entire result set at once instead of clicking through names one at a time.
Frequently Asked Questions
What is VCP in stock trading?
VCP is a chart pattern in which a stock corrects in a series of progressively shallower pullbacks, each accompanied by lower volume, before breaking out of the final tight range. It signals that available supply has been absorbed and that the remaining float sits with holders unwilling to sell at current prices.
What does VCP mean in finance?
In a trading context VCP means Volatility Contraction Pattern. The term is specific to technical analysis of individual equities and describes price behaviour during a consolidation. It is unrelated to other uses of the acronym in corporate finance or accounting.
How does VCP work?
Each pullback inside the base tests for sellers. The first correction flushes the least committed holders on heavy volume. Subsequent corrections find fewer sellers, so they are shallower and quieter. Once supply is exhausted, the stock trades in a narrow range on minimal volume, and modest demand against that thin float produces a sharp breakout.
How reliable is the VCP pattern?
No chart pattern produces reliable outcomes on its own. The VCP is generally regarded as higher probability when it forms in a leading stock during a healthy market, with clearly declining volume across contractions and a breakout on well above average volume. It fails more often in weak markets, in laggards, and when volume does not confirm the pivot. Its practical value comes as much from the tight stop the final contraction permits as from the win rate.
How to find VCP pattern stocks?
Every VCP screener workflow starts the same way: with a screen that isolates leadership, then add conditions describing volatility compression and volume dry-up, then confirm the survivors visually. In Deepvue you can run the Volatility Contraction preset for an immediate shortlist, build your own conditions in the filter builder, or describe the setup in plain English through the terminal and let it construct the screen.
What does VCP mean?
Volatility Contraction Pattern. The name is literal: the pattern is defined by volatility contracting across a sequence of corrections until the stock’s trading range becomes unusually narrow.
What is the VCP indicator in TradingView?
TradingView does not ship an official VCP indicator. Community scripts published in its public library attempt to flag contraction sequences automatically, and quality varies considerably between them. Deepvue takes a different approach, exposing contraction as filterable conditions across 276 Technicals and 145 Price & Volume data points so you can define tightness on your own terms rather than accepting a script’s assumptions.
What is the time frame for VCP pattern?
Most VCP bases develop over several weeks to several months on the daily chart, with individual contractions typically lasting one to several weeks each. Shorter bases can form after a strong advance, and longer ones appear in stocks digesting larger moves. The daily chart is the standard frame for identifying the pattern, with the weekly chart used to confirm the broader trend.
What is the Mark Minervini strategy?
Minervini trades under a framework he calls SEPA, which combines a trend template, fundamental quality requirements, and a focus on entering leading stocks at low risk pivot points. The VCP is his primary entry pattern within that framework. Deepvue includes Mark Minervini – Trend Criteria as one of its 80 Top Traders presets, covering the stage, relative strength, and base structure alignment the trend template calls for.