The Relative Strength Stock Screener Built for Finding Leaders
Every advance is led by a small group. In any given cycle a few dozen names account for most of the gains available, and the rest either drift or actively work against you. Identifying that group early is the single highest leverage decision in growth trading, and it is a comparative question rather than an absolute one. A stock up thirty percent means nothing until you know what the index did over the same window.
That comparison is what relative strength measures, and it is why a relative strength stock screener is a different instrument from a percentage gainers list. Deepvue’s screening engine carries 56 proprietary ratings including RS Rating, sits on 1,152 total fields, and refreshes 568 of them live through the session. The RS Line and Mansfield relative strength both render as indicators in charts, while output flows through to watchlists, alerting, and a terminal you can type sentences into, none of it requiring a second tab.
Why Deepvue Is the Best Relative Strength Stock Screener
Most platforms treat relative strength as one line item among hundreds of technical fields. For a growth trader it is not one field among many, it is the organising principle: the measure that decides which names enter the workflow at all before any pattern or fundamental question gets asked.
The best relative strength stock screener therefore has to do three things ordinary tools do not. It needs a ranked rating so leadership is comparable across the whole universe rather than only within a watchlist. It needs the line itself on the chart so you can see whether outperformance is improving or decaying. And it needs to combine both with structure and earnings in one screen, because leadership backed by decelerating revenue is a very different animal from leadership backed by an accelerating business.
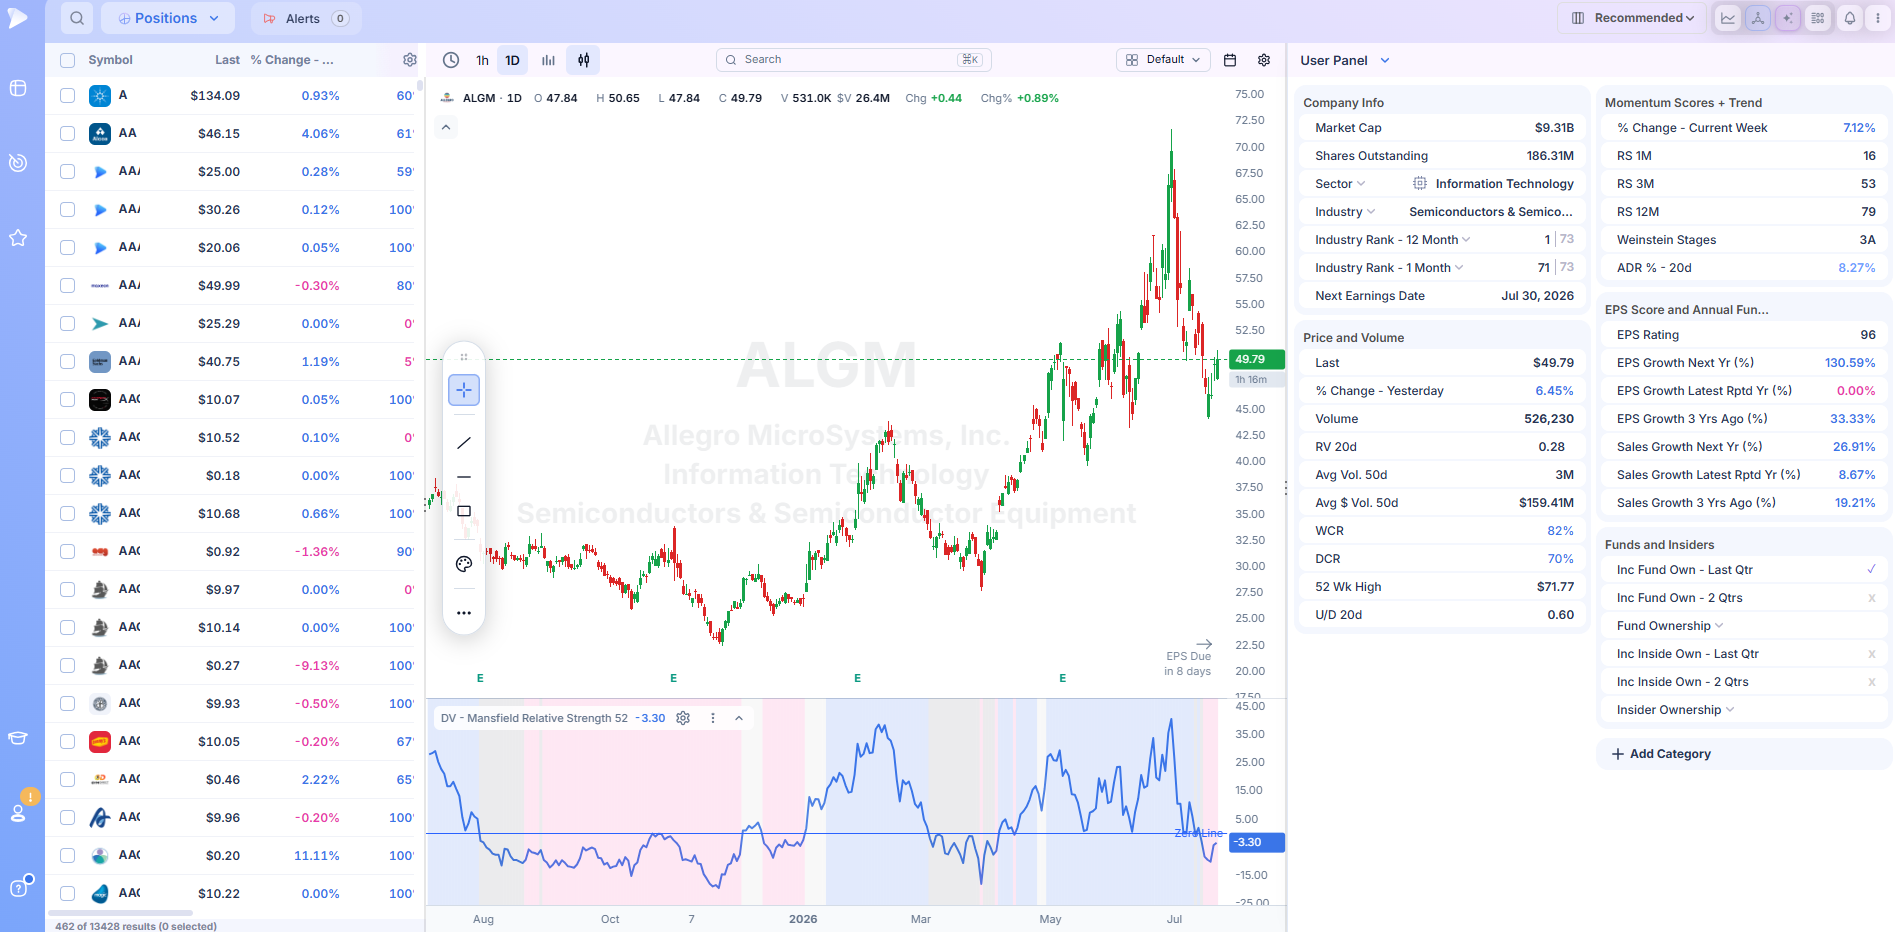
RS Rating: The Core of a Stock Relative Strength Screener
Deepvue’s proprietary ratings number 56, and RS Rating sits among them alongside EPS Rating and Composite Rating. A rating expresses relative performance as a rank against the rest of the market rather than as a raw return, which is what makes it usable as a screening threshold. Set a floor and everything below it disappears, regardless of sector or price.
This is the foundation layer of nearly every screen a growth trader builds. Whatever pattern or fundamental criteria come next, they get applied to a population that has already demonstrated it is outperforming.
The RS Line and Mansfield RS on the Chart
A rating is a snapshot. The RS Line is the trajectory, plotting the stock against the index continuously so you can read whether leadership is being extended or quietly given back. Deepvue renders it as a charting indicator alongside Mansfield relative strength, the version popularised through Stan Weinstein’s stage analysis work, which normalises the comparison around a zero line so that positive and negative readings are directly interpretable.
The practical use is confirmation. A stock breaking out while its RS Line makes a new high before price does is the configuration growth traders look for. The same breakout with a flat or falling line is the one that tends to fail.
Presets for a Relative Strength Trading Screener
Deepvue Leaders surfaces whichever names are leading on strength at that moment, making it the quickest available answer to the question this page concerns itself with. Two of the eighty professional screens apply here directly.
Minervini’s Trend Criteria aligns stage, RS and base structure in the SEPA manner. Kell’s Strength On Down Day pulls out leaders that hold their ground while the market gives back, which is about as pure a statement of this concept as a screen can make.
None of the three is locked. Open one, read the result, apply thresholds of your own, and preserve the whole thing as a screen you have named.
A Stock Screener for Strong Momentum Stocks Needs More Than Strength
A relative strength screener that only measures strength produces a list of extended stocks. The 276 Technicals let you require that leadership coincides with a workable entry, whether that is proximity to a moving average, a tight recent range or a base structure.
Earnings contribute 227 fields and sales another 126, which is where you establish that the company is accelerating and not merely the share price. A further 84 cover institutions and insiders, showing whether sponsorship is being accumulated as the move develops.
This is the argument for a stock screener for strong momentum stocks over a simple ranking table. Strength is the entry criterion, not the whole thesis.
Live Ranking Through the Session
Leadership rotates, sometimes within a single day. A theme that led at the open can be under distribution by the afternoon while something else takes over. While the market trades, 568 of the fields update continuously rather than on refresh, and every cell signals the moment its number shifts. The table beneath handles a thousand rows without lag. Twenty four further columns carry the picture into pre and post market trading.
From Ranked List to Tracked Position
Strength screening produces a rotating list rather than a fixed one, which makes tracking the point. Tick the rows worth keeping and dispatch them to a watchlist in one action. Bring a single name up against its chart to read the RS Line beside price. Place alerts where an entry would trigger, then leave the waiting to the alerts panel, which matters because leadership frequently needs weeks to mature into a workable setup.
Who This Screener Suits
- ✓Growth and momentum traders who build every watchlist from a leadership ranking first
- ✓CANSLIM practitioners for whom the L in the acronym is a screening condition, not a slogan
- ✓Traders working from stage analysis who need Mansfield RS available on the chart
- ✓Anyone tracking theme and sector rotation who needs the ranking refreshed daily
- ✓Traders leaving legacy platforms that report relative strength but will not let you screen on it
Pricing
One subscription, $49 each month. Inside it: the complete 1,152 field library, all 56 proprietary ratings, the full preset collection, the visual builder, terminal access with no meter on it, charting that renders the RS Line and Mansfield RS, plus watchlists and alerting. There is no tier above this one.
MarketSurge sells its comparable product at $149 each month.
What Is Relative Strength?
Relative strength measures a stock’s performance against a benchmark, usually a broad index, over a defined period. It answers one question: is this name outperforming the market, or merely moving with it?
The distinction matters because absolute returns are misleading in isolation. A stock up twelve percent during a quarter when the index rose eighteen is a laggard wearing the costume of a winner. A stock down four percent while the index fell fifteen is showing genuine strength, and names that hold up through a correction are disproportionately the ones that lead the advance that follows.
This is a comparative concept, and it underpins the momentum tradition in equity trading. William O’Neil built relative strength into CANSLIM as a screening requirement. Stan Weinstein made it central to stage analysis. The observation both were working from is that outperformance tends to persist, which is among the more durable findings in market research.
Relative Strength vs the Relative Strength Index
The two share most of a name and almost nothing else, and conflating them is the most common error in this area.
- •Relative strength compares one instrument against another. The reference point is external, usually an index. A rising reading means the stock is beating the market. It is a trend following concept, and high readings are a reason to buy.
- •The Relative Strength Index, developed by J. Welles Wilder, compares a stock against its own recent price action. The reference point is internal. It produces a bounded oscillator between zero and one hundred, conventionally read as overbought above seventy and oversold below thirty. It is a mean reversion tool, and high readings are traditionally read as a reason for caution.
The two therefore give opposite instructions on the same chart. A market leader in a sustained advance will show high relative strength and an RSI pinned in overbought territory for weeks. A trader using the first buys it; a trader using the second sells it.
Anyone searching for a relative strength index stock screener should establish which of the two a given tool actually computes, because the name on the box will not settle it. A relative strength index stock screener filtering for oversold readings is looking for the opposite population to the one described on this page.
For growth and momentum traders the first is the relevant one. That is the measure this page and Deepvue’s RS Rating are built around.
How Relative Strength Is Measured
Three representations do most of the work, and they answer different questions.
- •The RS Line. Price divided by the index, plotted continuously. Its direction is the entire signal: rising means the stock is gaining ground on the market, falling means it is losing it. A new high in the line before price confirms a breakout is one of the strongest tells available.
- •The RS Rating. Performance ranked against the whole universe and expressed on a percentile scale. Because it is a rank rather than a return, it is directly comparable across sectors and price levels, which is what makes it usable as a filter threshold.
- •Mansfield relative strength. A normalised version of the comparison, plotted around a zero line so readings above indicate outperformance against the benchmark and readings below indicate the reverse. It comes out of Stan Weinstein’s stage analysis framework, where it is used to confirm a stock has entered its advancing stage rather than merely bouncing within a base.
Each is a different view of the same underlying comparison. The rating is best for screening, the line is best for confirmation, and Mansfield RS is best for judging where a stock sits in its cycle.
Why Relative Strength Persists
The behaviour has an explanation rooted in how institutional money moves.
Large funds cannot establish a position in a single session. Building a meaningful stake in a mid cap company takes weeks and sometimes months of accumulation, and that sustained buying is what produces persistent outperformance rather than a single spike. Once the position exists, those same institutions have an incentive to add on weakness, which is why leading stocks pull back less severely during market corrections.
There is a reflexive element too. Outperformance attracts attention from analysts, allocators and other traders, and that attention brings further capital. The process is self reinforcing until something breaks it, typically a deceleration in the underlying business or a change in the market environment.
This is also why relative strength deteriorates before price does. Institutions reduce exposure gradually for the same reason they build it gradually. A stock still making nominal highs while its RS Line rolls over is showing the early signature of distribution, and that divergence tends to appear well before the price chart looks damaged.
How a Relative Strength Stock Screener Works
The calculation is arithmetic, so the worth of a stock relative strength screener rests entirely on what surrounds it: which benchmark it compares against, over what window, and what else can be demanded in the same query. A relative strength screener that offers the number but nothing to combine it with has done the easy part only.
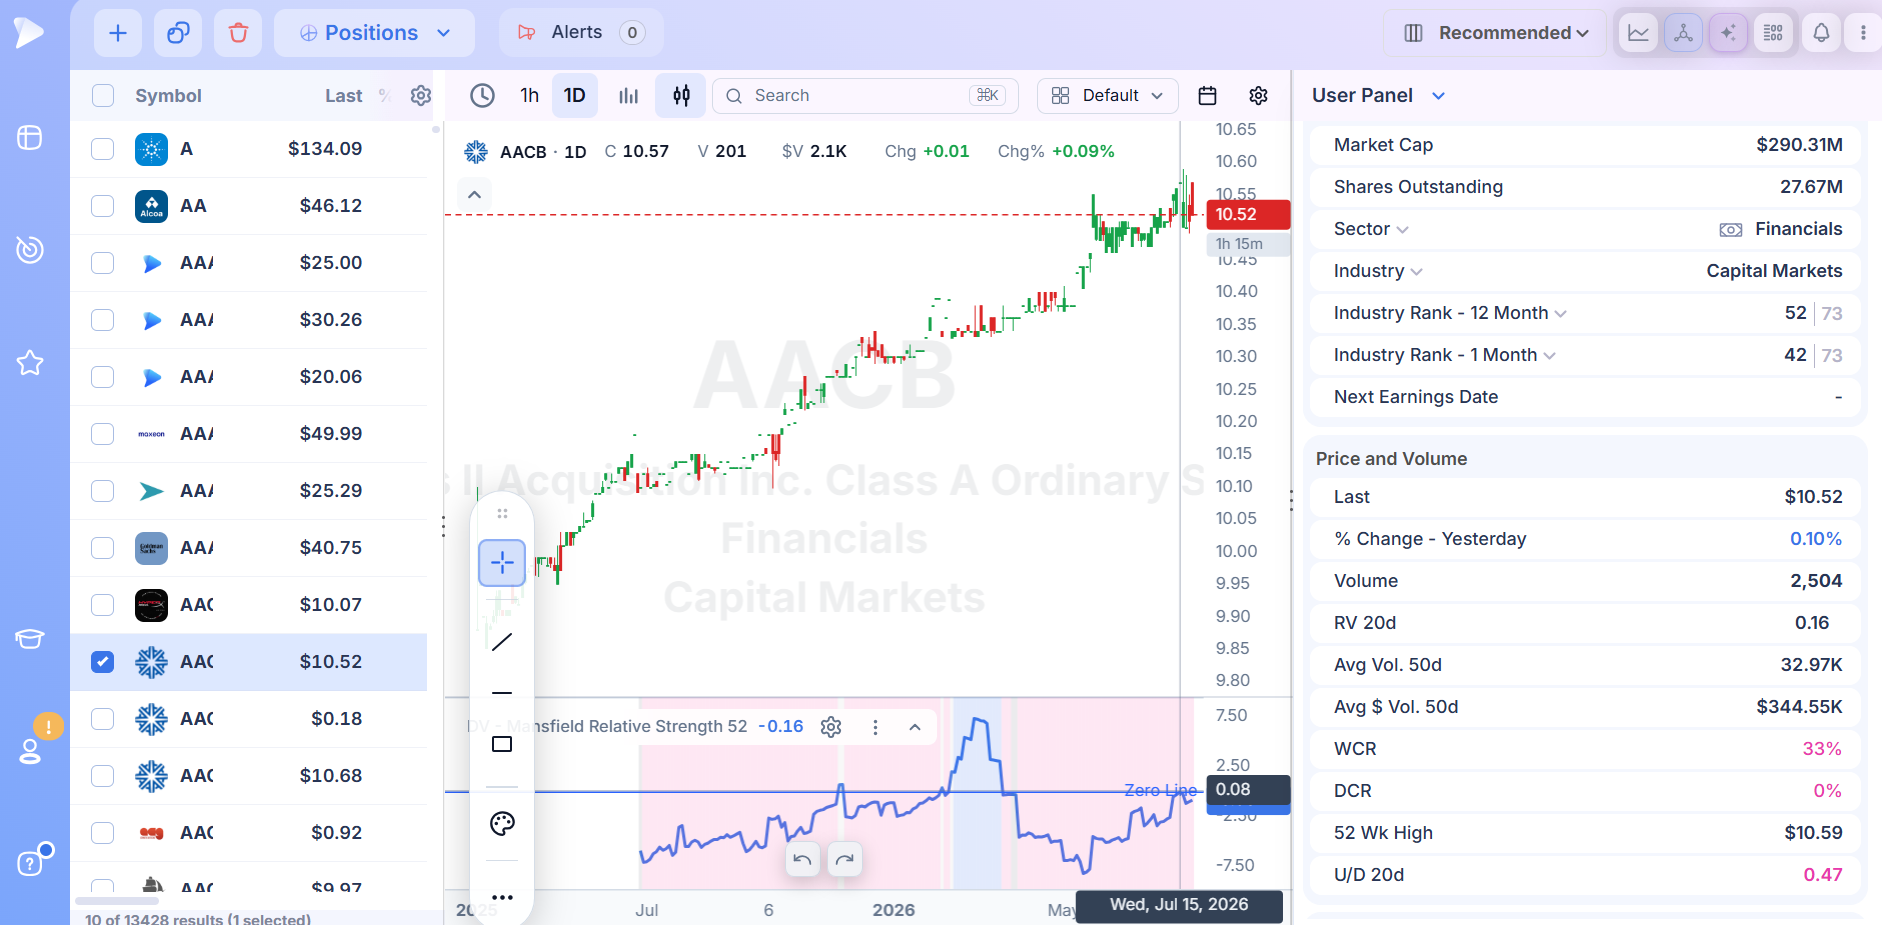
Choosing the Comparison Window
Relative strength over one month and over twelve months describe different things, and a name can lead on one while lagging the other. Short windows catch emerging leadership early and produce more false signals. Long windows are more reliable and slower, often surfacing names already well advanced. Many traders require strength across several windows simultaneously, which filters for consistency rather than a recent burst.
Why a Relative Strength Stock Scanner Ranks Instead of Listing Returns
A raw return list is dominated by whatever is most volatile. A percentile rating solves this by expressing performance relative to the entire universe, so a threshold means the same thing for a large cap industrial as for a recent listing. This is why RS Rating sits among Deepvue’s 56 proprietary ratings rather than being left as a calculation the user assembles.
Requiring Structure Alongside Strength
The strongest names by rating are frequently the most extended, which is a poor entry even when the thesis is right. A relative strength trading screener justifies itself by pairing the ranking with conditions that find an actual entry: distance from a moving average, how tight the recent range has become, where price sits inside its base. Those measures live in the Technicals category, 276 fields deep.
What the Best Relative Strength Stock Screener Confirms
Strength on rising volume is accumulation. Strength on falling volume is drift. Telling them apart is what the Price and Volume group is for, 145 fields of range, turnover and volatility measures. Whether the outperformance rests on a genuinely improving business is a question for the 227 earnings fields and the 126 covering sales. A relative strength stock scanner blind to either will keep returning names that lead for three weeks and then stop.
Then You Read the Chart
Ranking is not interpretation. Is the RS Line confirming price or quietly diverging from it? Was the outperformance built steadily or delivered in one overnight jump? Does the present structure actually offer somewhere to enter? These are visual judgments. Bring a row up alongside its chart, or switch the output to tiled miniatures and take in the whole leadership picture at once.
Frequently Asked Questions
What is a good RS Rating for a stock?
Most growth traders working in the CANSLIM tradition treat the low eighties as a working floor, with the strongest candidates in the nineties. The reasoning is that the historical studies behind the methodology found the biggest winners already showed high relative strength before their largest advances, so a low rating disqualifies a name regardless of how attractive the rest of the picture looks. Thresholds are a matter of preference rather than rule, and traders hunting emerging leadership sometimes screen lower deliberately to catch names before the rating catches up.
How is relative strength different from momentum?
The terms overlap heavily and are often used interchangeably. Momentum usually refers to the rate and persistence of a stock’s own price movement, while relative strength is explicitly comparative, measuring that movement against a benchmark. In practice most momentum strategies use relative strength as their selection mechanism, so a stock screener for strong momentum stocks and a relative strength screener typically describe the same tool.
What timeframe should I use for relative strength?
There is no single correct answer, and the choice reflects your holding period. Traders holding for weeks often weight three month readings most heavily. Those holding for months lean on six and twelve month comparisons. A common approach requires strength across multiple windows at once, which surfaces names outperforming consistently rather than those that produced one strong month. Deepvue’s field library supports building the comparison across whichever windows suit the method.
Can relative strength be used to sell?
Yes, and many traders find it more useful as an exit signal than an entry one. Because institutions reduce positions gradually, relative strength usually deteriorates before price breaks down. An RS Line rolling over while price still makes nominal highs is a recognised divergence and often the earliest warning available. Some traders exit on relative strength deterioration alone; others use it to tighten stops rather than to close outright.
Does relative strength work in a falling market?
The measure remains informative but the interpretation changes. In a correction, strong relative strength frequently means falling less than the index rather than rising at all, and names that hold up through a decline are historically over represented among the leaders of the next advance. That said, buying strength during a downtrend has a poor record. Most methodologies treat a bear market as a period for building the leadership list rather than acting on it, then buy once the broader market confirms a turn.
Is relative strength a lagging indicator?
Partly, since it is calculated from prices that have already occurred. But it is considerably less lagging than most technical measures, because it captures institutional accumulation that is still in progress rather than a completed pattern. The persistence effect is what gives it forward value: outperformance tends to continue, so a stock leading now is more likely than average to lead over the coming months. That is a probabilistic statement rather than a guarantee, and it holds better in trending markets than choppy ones.