The Moving Average Convergence Divergence Stock Screener for Momentum Traders
MACD is among the most widely taught indicators in technical analysis and among the most widely misused. Traders learn the crossover rule, apply it as a signal, discover it produces a large number of poor entries in anything other than a clean trend, and conclude the tool is broken. It is not broken. It was never a signal generator.
What it does well is describe the state of momentum, and that description is far more valuable applied across a whole universe than read one chart at a time. That is the case for a moving average convergence divergence stock screener rather than a moving average convergence divergence indicator sitting under a single chart.
Deepvue’s screening engine carries 276 technical measures covering oscillators, momentum and trend, all exposed as conditions you can filter and columns you can sort. Those sit inside a total of 1,152 data points, 568 of them refreshed continuously while the session runs. Oscillators draw in charts beside price, and anything a screen returns can be pushed to watchlists, turned into alerts, or handed to a terminal you talk to in English.
Why Deepvue Is the Best MACD Screener for Stocks
Oscillator conditions appear on most platforms. Very few let you combine them with the context that makes them mean anything.
A crossover in a market leader partway through a base is a completely different event from an identical crossover in a broken stock bouncing off its lows, and no oscillator reading distinguishes the two.
What separates the best MACD screener for stocks is whether the momentum condition can sit alongside relative strength, earnings quality and structural position in one query, so the output is a list of candidates rather than a list of arithmetic coincidences.
What a MACD Stock Screener Needs From Its Fields
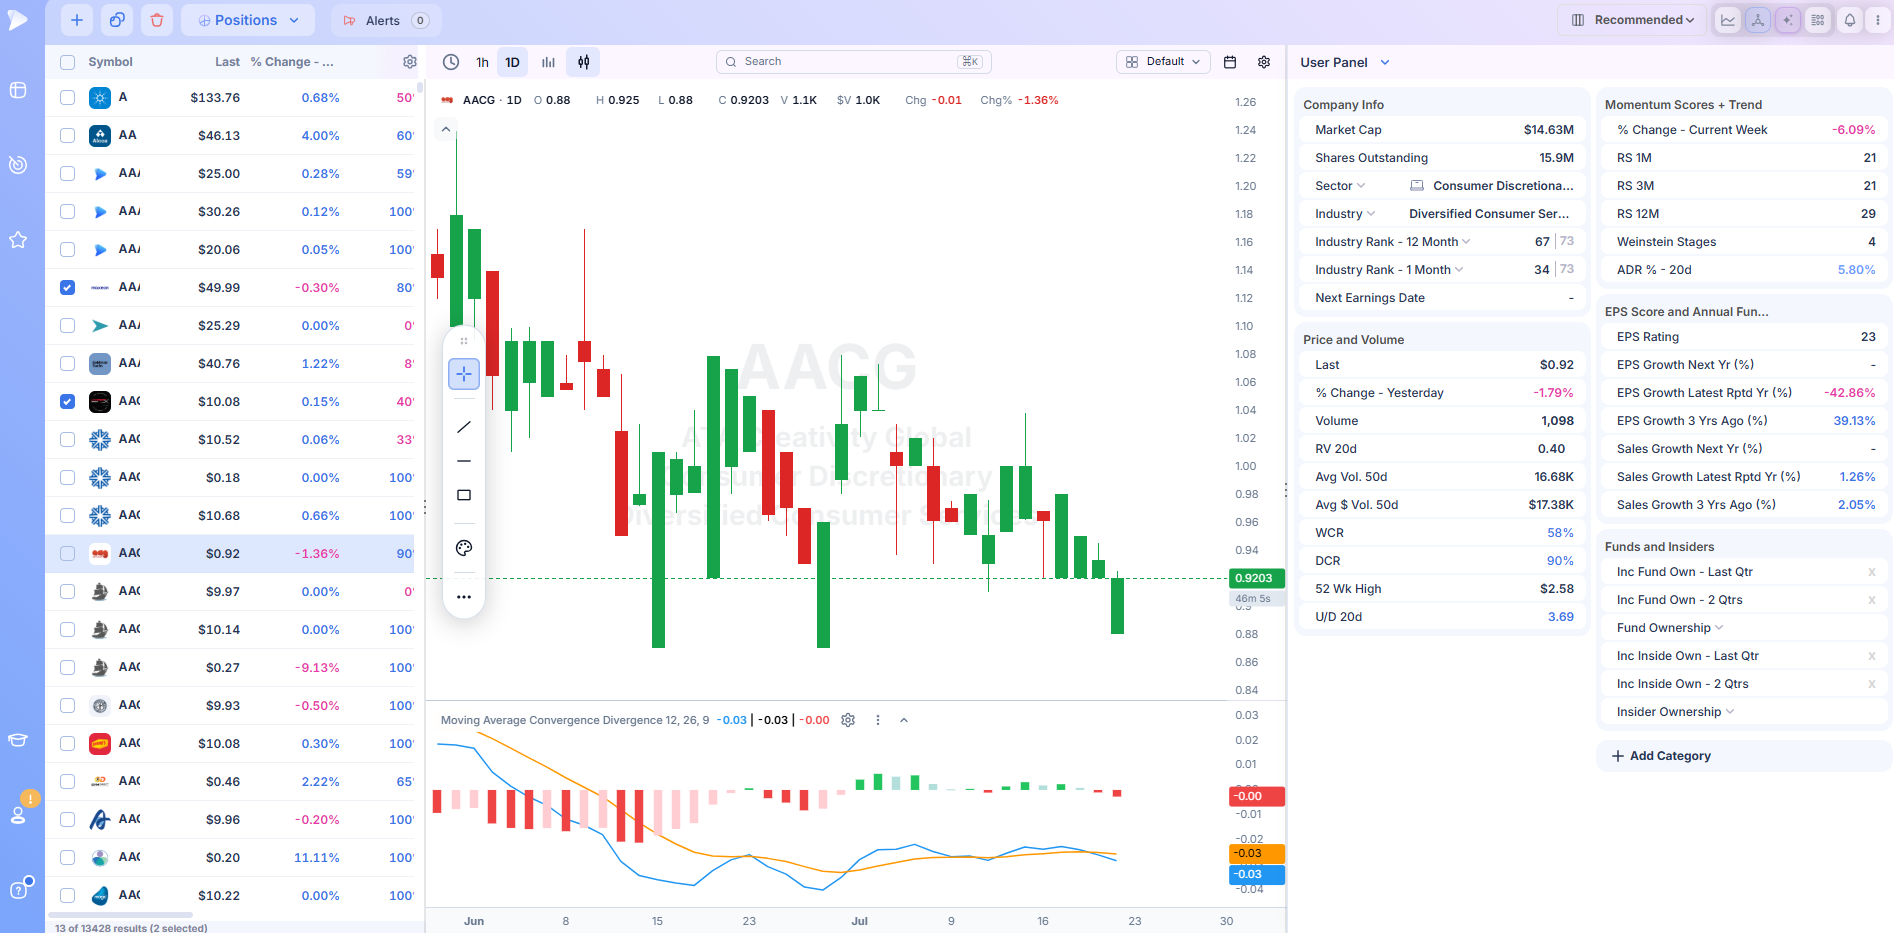
Every oscillator and momentum measure on the platform lives inside the 276 strong Technicals group, handled the way every other field is handled: filterable, sortable, addable as a column. That is what turns the moving average convergence divergence indicator from something you read into something you query.
The same group holds the Webby and Qullamaggie measures, both of which come from traditions that use momentum readings as confirmation within a trend rather than as standalone triggers, which is the correct way to apply this family of indicators.
A MACD Momentum Stock Screener Needs Leadership Conditions Too
The 56 proprietary ratings include RS Rating. Pairing a momentum condition with a relative strength floor is the single most useful thing a MACD momentum stock screener can do, because it answers the objection that kills most oscillator screens: momentum turning up in a stock nobody wants is not an opportunity.
Add the 227 earnings measures and 126 covering sales and a MACD momentum stock screener can insist that the momentum shift coincides with a business actually improving. Institutional and insider activity contributes another 84 fields.
Grouped Logic for Multi Condition Momentum Screens
Momentum screens are rarely one condition. A usable query might want the line above its signal, the histogram expanding, and price above a rising average, all at once, and might accept any of several definitions of the trend condition.
Deepvue’s builder answers that by letting each cluster of conditions take a name, with an operator deciding whether clusters must all hold or only one of them. Nothing here is written as syntax. A condition is a range, a selection, a text match or a checkbox. Sets that work get stored, organised into folders and reopened whenever you want them.
Live Values When Crossings Occur
A crossing is a moment. Whether it happened this morning or three sessions ago changes what it means, and a screen refreshed overnight tells you about the third case only. Deepvue pushes 568 of its data points down a live socket for as long as the market is trading, and every cell announces itself the instant its value moves. The table underneath was built to scroll cleanly through a thousand results. Extended hours get their own 24 columns.
Presets as a Starting Universe
Momentum readings are most useful applied to a population that already qualifies on other grounds. Deepvue Leaders hands back the current relative strength leadership. Minervini’s Trend Criteria tests stage, RS and base structure the way SEPA lays it out. Under Momentum, High Volume Edge picks out today’s unusual volume names with a quality filter applied.
Each opens with a single click, and each remains editable. Begin with one, look at what returns, layer your oscillator thresholds over it, then keep the whole configuration under a title of your choosing.
From Signal to Monitored Position
Momentum shifts often precede a tradeable setup by weeks. Tick whichever rows deserve following and move the batch into a watchlist. Call any of them up next to a chart so the oscillator sits under price where it can be read properly. Hang alerts on the levels that would settle the question, then let the panel come to you.
Who This Screener Is For
- ✓Growth and momentum traders who use oscillators to confirm a thesis rather than to generate one
- ✓Swing and position traders holding for weeks who need momentum context on a candidate list
- ✓Traders watching for divergence as an early warning in positions they already hold
- ✓Anyone combining momentum readings with relative strength and earnings in the same query
- ✓Anyone whose current platform draws oscillators well and then leaves them unscannable
Pricing
Deepvue runs to $49 monthly and there is only the one plan. Inside: every one of the 1,152 data points, all 276 Technicals, the full library of presets, the visual builder, a terminal nobody meters, and the charting, watchlist and alert tooling that surrounds the screener. Nothing has been reserved for an upper tier.
The nearest MarketSurge product costs $149 monthly.
What Is Moving Average Convergence Divergence?
As a moving average convergence divergence stocks indicator it measures one thing: the relationship between two exponential moving averages of price. Gerald Appel developed it in the late 1970s, and it remains one of the few indicators from that era in constant use.
The construction is simple. Subtract a longer exponential average from a shorter one and the result is the MACD line. When the short average pulls away from the long one, the averages are diverging and momentum is building. When they close on each other, they are converging and momentum is fading. The name describes exactly what the calculation tracks.
The standard settings are a twelve period and twenty six period average, with a nine period average of the resulting line plotted as a signal line. Those numbers date from a five day trading week and are conventional rather than optimal, but their ubiquity gives them a self reinforcing quality since a great many participants watch the same readings.
The Three Components
The moving average convergence divergence stocks indicator has three parts, and most confusion comes from treating them as a single reading.
- •The MACD line. The difference between the two exponential averages. Above zero means the shorter average sits above the longer, which is to say the trend is up on that timescale. Below zero means the reverse.
- •The signal line. A nine period exponential average of the MACD line itself. It smooths the primary line, and the relationship between the two produces the crossover most traders reference.
- •The histogram. The gap between the MACD line and its signal line, drawn as bars. It expands when the two are separating and contracts when they converge. Because it measures the rate of change in the relationship, it turns before the crossover does, which is why a MACD histogram stock screener catches momentum shifts earlier than a crossover screen does.
Reading all three together is the difference between using the indicator well and using it as a crossover alarm. The line tells you the trend direction on that timescale, the crossover tells you momentum has shifted, and the histogram tells you how quickly.
MACD Signal Line Crossover Stocks: What the Signal Means
A MACD signal line crossover occurs when the primary line crosses its nine period average. Traders screening for MACD signal line crossover stocks are looking for exactly that event. Crossing upward is treated as a positive sign and crossing down as a negative one.
The mechanism repays a little thought. The MACD line already represents the gap between two averages. Crossing its own smoothed version means that gap is now changing faster than its recent norm, in other words that momentum is accelerating relative to its own recent behaviour. It is a second derivative of price, which explains both its early warning value and its noisiness.
A bullish MACD crossover screener finds names where that acceleration has just turned positive. A bearish MACD crossover screener finds the reverse, at least as useful for anyone managing positions they already hold rather than hunting new ones. Most traders end up running both, since a bullish MACD crossover screener builds the candidate list and a bearish MACD crossover screener protects what is already open.
Where the crossing occurs matters enormously and is routinely ignored. A crossover above the zero line happens in a stock already in an uptrend and typically signals a resumption after a pause. The identical crossover below zero happens in a downtrend and more often signals a bounce than a reversal. Requiring stocks with positive MACD readings at the point of a crossing discards a great many of the weaker signals at almost no cost.
MACD Divergence: The Most Useful Application
Divergence occurs when price and the indicator disagree. Price makes a higher high while MACD makes a lower one, or price makes a lower low while MACD makes a higher one.
This is the application most experienced traders rate highest, and it is the one least suited to a mechanical rule. Bearish divergence in a stock you own is an early indication that the buying behind the advance is weakening, often visible well before price structure shows damage. Bullish divergence during a decline suggests selling pressure is exhausting.
The caveats are substantial. Divergence can persist for a long time before anything happens, and a strongly trending stock will generate repeated divergences during an advance that continues regardless. A MACD divergence stock screener is best understood as producing a watchlist to examine rather than a set of instructions. Built that way, a MACD divergence stock screener becomes a monitoring tool rather than an entry system. Run as an entry system it disappoints; run as an early warning on open positions it earns its place, and that is the use most traders get value from.
How a Moving Average Convergence Divergence Stock Screener Works
Every platform computes this the same way. What sets one moving average convergence divergence stock screener apart is the variety of questions its fields will answer, and what else you are permitted to demand in the same breath. Any MACD stock screener can report a crossing; the useful ones let you qualify it.
Finding Stocks With Positive MACD Readings
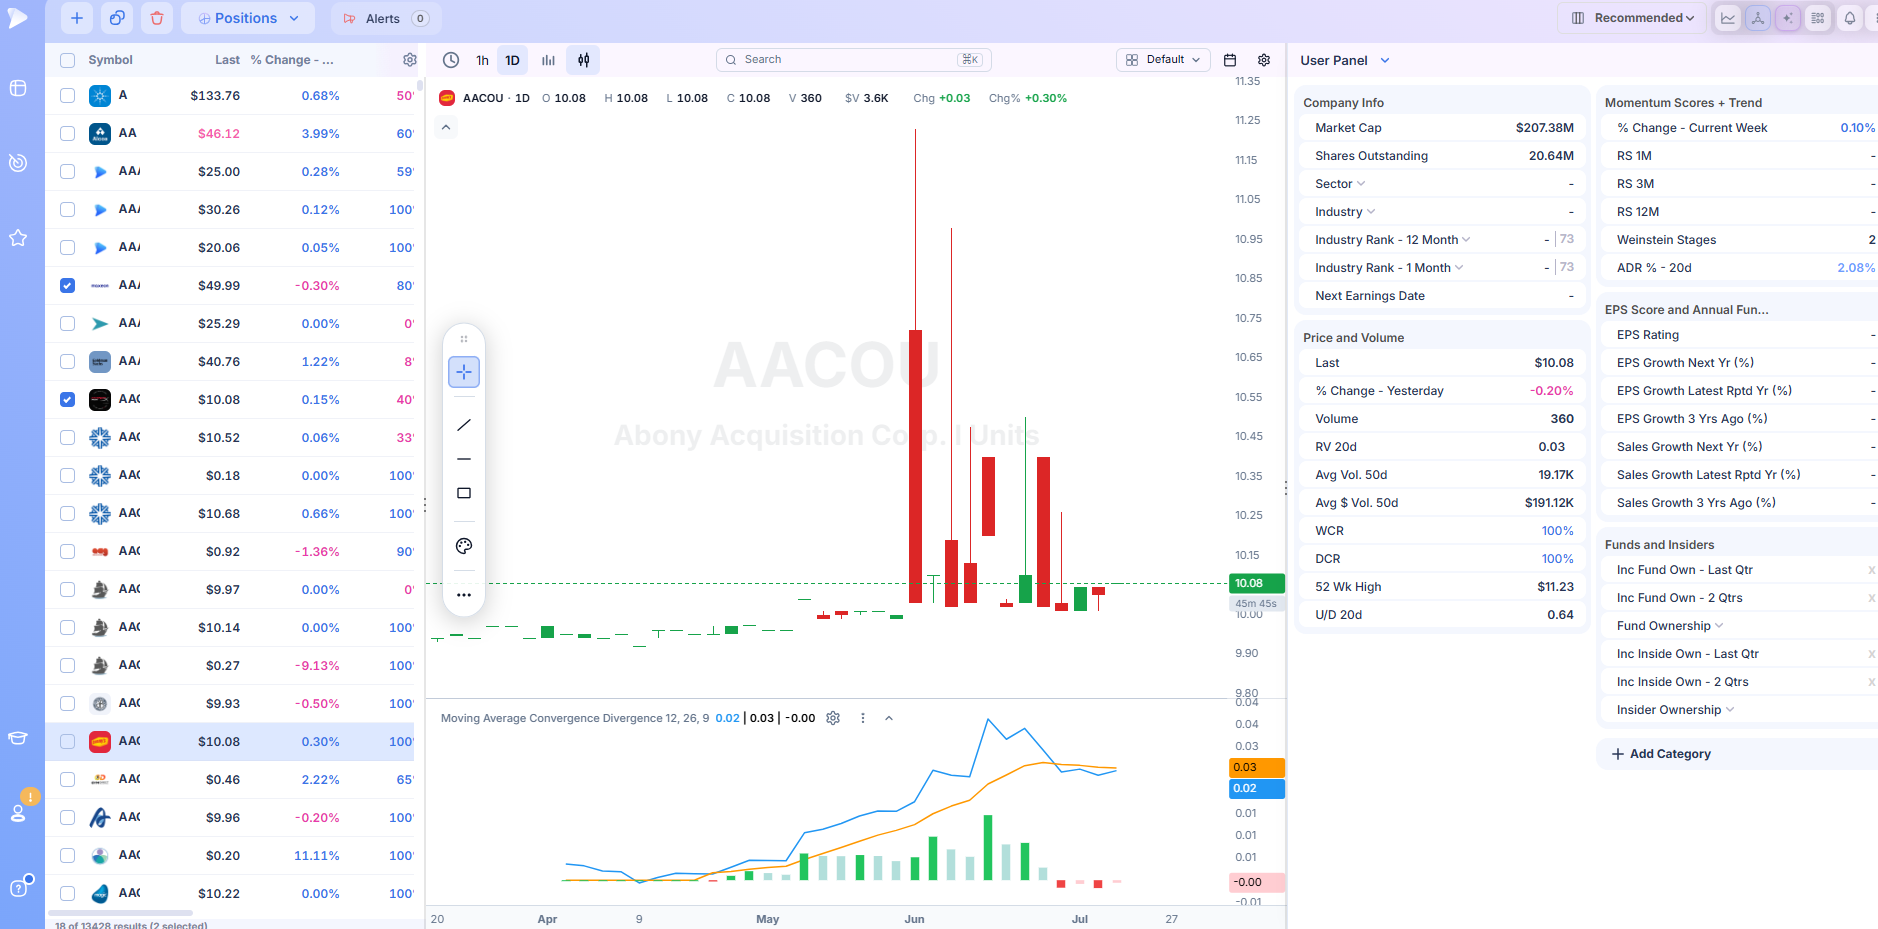
The coarsest and most useful first cut. Screening for stocks with positive MACD readings restricts the universe to names where the shorter average sits above the longer, which removes most of what is in a downtrend. Blunt, and that bluntness is precisely the reason it belongs near the top of a query.
MACD Crossover Stock Screener: Direction and Recency
Something that crossed this morning is not the same candidate as something that crossed three weeks ago and has drifted since. A MACD crossover stock screener needs both direction and freshness, since the population that crossed at some point recently is far too large to review. Recency is the condition most people forget to add, and a MACD crossover stock screener without it returns noise.
MACD Histogram Stock Screener: Expansion and Contraction
The histogram answers the question the crossover cannot: is momentum still building or already fading? Expanding bars mean the separation is widening. Contracting bars mean it is closing, which frequently precedes a crossing in the opposite direction. A MACD histogram stock screener therefore catches transitions earlier than one built on crossings alone.
Combining With Trend and Strength
This is where a momentum screen becomes usable. Requiring price above a rising average, a relative strength floor from the 56 proprietary ratings, and adequate liquidity from the 145 Price and Volume measures turns a list of arithmetic events into a list of candidates worth the time.
Then You Read the Chart
Filters narrow. Eyes decide. Whether the crossing occurred at a structurally sensible place, whether the divergence is meaningful or noise, and whether volume supported the momentum shift are all visual judgments. Put a row next to its chart, or flip everything into a wall of thumbnails and take the set in at a glance.
Frequently Asked Questions
Is MACD a good indicator?
It is a good indicator for the job it actually does, which is describing the state and direction of momentum, and a poor one for the job it is usually asked to do, which is generating entry signals. Used as confirmation within a trend, or to surface divergence in positions already held, it has genuine value. Used as a standalone crossover system it produces a high proportion of losing trades in anything other than a cleanly trending market. The tool is sound; the common application is not.
How to use MACD effectively?
Three principles cover most of it. Use it as one condition among several rather than as a system, since momentum without leadership or structure is not a trade. Pay attention to where readings occur relative to zero, because a crossing in an uptrend and the same crossing in a downtrend mean different things. And weight divergence more heavily than crossings, particularly as a warning in positions you already own, since that is where the indicator provides information price has not yet shown.
Do professional traders use MACD?
Some do, though generally not the way retail material presents it. Professionals who use it treat it as a momentum description that supplements a thesis built elsewhere, most often to time entries within a trend already identified, or to flag deterioration in an existing position through divergence. Very few trade crossovers mechanically. Among growth stock traders specifically, relative strength and base structure carry far more weight, with momentum oscillators playing a confirming role.
When to buy and sell on MACD?
Treating it as a timing instruction is the most common error. If you use it for timing at all, the more defensible approach is buying on a bullish crossing that occurs above the zero line in a stock already in an uptrend, and treating a bearish crossing or a divergence as a reason to tighten a stop rather than to exit outright. Selling on every bearish crossing will take you out of strong stocks repeatedly during normal consolidation, which is why most traders who hold for weeks use it to inform decisions rather than to make them.
What is a better indicator than MACD?
That depends on the question being asked, and the honest answer for growth stock traders is that relative strength is more useful. Momentum tells you what a stock is doing; relative strength tells you what it is doing compared to everything else, which is the more decisive question when the goal is identifying market leaders. Volume measures also carry more information about institutional participation than any oscillator does. MACD remains useful as a supplement, but it is not the field a leadership focused screen should be built around.
What are the disadvantages of using MACD?
Three stand out. It lags. Both halves of the calculation average prices that are already history, so any signal shows up once some of the move has gone. It whipsaws badly in sideways markets, generating repeated crossings that lead nowhere. And it is unbounded, so readings cannot be compared across stocks or ranked across a universe, which limits its use as a primary screening field. It also produces frequent divergences in strongly trending stocks that resolve by the trend simply continuing, which makes divergence signals unreliable when taken in isolation.