The Live Stock Screener Where the Data Comes to You
Every screening tool eventually reveals itself through one small detail: the refresh button. If the page needs reloading to show current prices, the tool is showing you photographs of the market, taken at intervals, arranged to look like a feed. The picture may be minutes old or hours old, and nothing on screen tells you which.
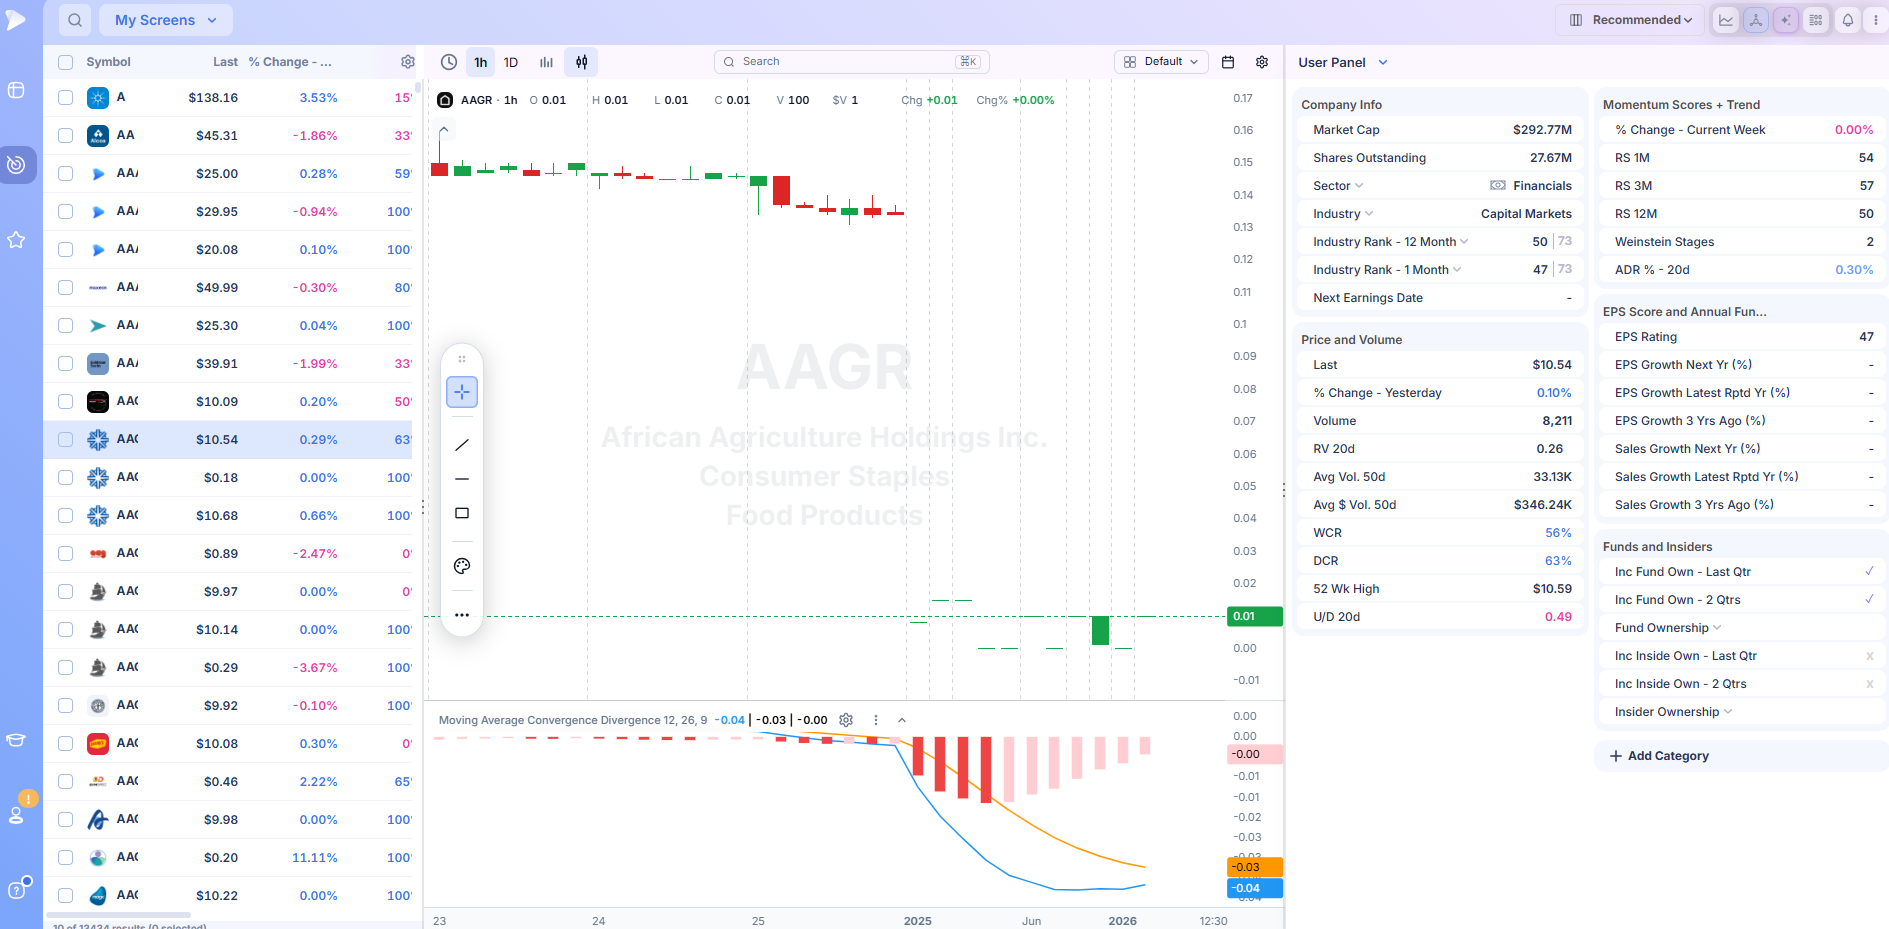
A live stock screener works the other way around. Data is pushed to the table as trades occur, not pulled when you ask. Deepvue’s screening engine streams 568 of its fields over WebSocket for the length of every session, with cells flashing the instant a value changes. The full library runs to 1,152 data points. The whole loop stays on one page: charts open beside results, watchlists absorb them in bulk, alerts fire from them, and a terminal builds new screens from a typed sentence.
Why Deepvue Is the Best Live Stock Screener
Plenty of products describe themselves as real time. Far fewer are architected for it, and the difference shows up exactly when it matters most: the open, the close, and the minutes around a catalyst.
The best live stock screener is defined by three commitments. The feed must push rather than poll, so the table reflects the tape instead of trailing it. The fields that matter for timing, volume and range above all, must be among those streaming. And the interface must survive the load, because live data through a table that stutters at scale is worse than useless during the busiest half hour of the day.
Streamed Over WebSocket, Not Refreshed on a Timer
Deepvue holds a socket connection open for the duration of market hours and sends changes down it as they happen. There is no polling interval and no cache to go stale. When a print moves a value, the corresponding cell flashes, so the table itself shows you where activity is concentrating without any sorting or searching on your part. 568 of the platform’s 1,152 total behave this way.
The Live Stock Volume Screener Inside It
Volume is where stale data costs the most, because volume readings only mean anything in relation to time elapsed. Half a stock’s average daily turnover by late morning is a genuinely unusual session; the same figure at the close is an ordinary Tuesday.
A live stock volume screener has to keep that context current, and the Price and Volume category supplies the raw material across its 145 fields, RVOL and dollar volume among them. Under the Momentum heading, the High Volume Edge preset applies the idea directly, surfacing today’s unusual volume movers with a quality filter attached.
Twenty Four Columns Before the Bell Rings
The session’s most consequential information often arrives while the market is closed. Deepvue gives extended hours trading 24 columns of its own, so the morning’s gaps, the after hours reactions to earnings, and the names already trading heavily at 8am are all visible inside the same table you screen with, not on a separate quotes page somewhere else.
A Table Built for a Thousand Moving Rows
Streaming data into a browser is easy. Keeping a browser responsive while a thousand rows of it update is not, and it is where most attempts at a live screen quietly fall apart. Deepvue renders its results on a virtualized table designed to scroll smoothly past a thousand rows while cells fire, which is the unglamorous engineering that makes live screening usable rather than merely technically true.
Presets That Depend on Freshness
Some screens are indifferent to timing. Others are worthless a day late. Oliver Kell – Gappers targets one specific population, gapping names whose RS is climbing, and that population exists on a particular morning and not the following one. High Volume Edge reads today’s turnover specifically. Deepvue Leaders reports current relative strength leadership, and leadership rotates. Each of these opens in a click, and each accepts your own conditions layered over the top before you save the combination as your own.
Acting on What You See, While You See It
Live information invites a live response. Rows push into a watchlist in bulk, any single row opens beside its chart in a split layout, and an alert attaches in one click, surfacing in the alerts panel the moment its level trades. A typed sentence to the terminal produces a fresh screen without a form, and nothing about the sequence involves leaving the page or waiting for one to load.
Who This Screener Suits
- ✓Swing and position traders whose entries cluster in the first and last hour, where stale data misleads most
- ✓Growth traders monitoring earnings season, when pre market reactions decide the day before it starts
- ✓Anyone whose method turns on volume confirmation, which is meaningless read late
- ✓Traders running alert heavy workflows who need triggers tied to the tape rather than to a refresh cycle
- ✓Users of end of day and delayed platforms who have felt the cost of the lag at least once
Pricing
$49 a month buys the whole platform. There is one plan, and the live architecture is not an upgrade: the streaming fields, the extended hours columns, all 1,152 data points, the preset library, the visual filter builder, the unmetered terminal, charting, watchlists and alerts are simply what the subscription is.
MarketSurge, for context, runs $149 a month.
What Is a Real Time Stock Screener?
Screening tools sit on one of three tiers of data freshness, and the tier shapes everything about how the tool can be used.
End of day tools update once, after the close. They suit research conducted at night for orders placed tomorrow, and for a position measured in months they are often perfectly adequate.
Delayed tools show the market as it stood roughly fifteen to twenty minutes ago. This is the default state of a great deal of free financial data, a convention rooted in exchange fee structures rather than in any technical necessity. The delay is invisible on a quiet afternoon and enormous around a catalyst.
A real time stock screener occupies the third tier: values current to the moment, updated as trading happens. Within that tier there is a further split that marketing language tends to blur, between tools that fetch fresh data when you reload and tools that stream it continuously, and the two feel completely different in use even though both can truthfully print the words real time on a features page. Every best real time stock screener argument ultimately comes down to that split.
What Makes a Stock Screener Real Time
The phrase gets applied loosely, so it is worth being precise about the mechanics that make a stock screener real time in the sense that matters.
The first requirement is push architecture. A polling tool asks the server for new data on a schedule, or when the user reloads, which means every reading on screen is as old as the last request. A streaming tool holds a connection open and receives changes as they occur. Only the second removes the question of how stale the screen is, because the answer becomes: it is not.
The second is that derived fields update along with prices. A screen is mostly derived values, ranges, averages, relative measures, and a tool that streams the last price while the calculated columns sit frozen from the morning is live in only the shallowest sense.
The third is honest labelling of what is and is not streaming. Across stock screener tools real-time data is the specification most often asserted and least often itemised, and the useful question to put to any vendor is not whether the product is real time but which fields are, sourced from where, delayed by how much.
What the Fifteen Minute Delay Actually Costs
An honest account cuts both ways, because live data is routinely oversold to people who do not need it and underrated by people who do.
For research conducted after hours, deciding what belongs on tomorrow’s watchlist, delay costs nothing at all. The market is closed; every tool shows the same picture.
The cost concentrates around events. A stock clearing a pivot at 9:47 on four times its usual pace has, on a delayed feed, not cleared anything yet, and by the time it visibly has, the low risk entry is often finished.
Confirmation is a moment, and a fifteen minute delay converts moments into history. The same applies to a stop level failing in a position you hold, to a gap extending or fading in the first half hour, and to any alert whose entire purpose was to reach you when the level traded rather than a quarter of an hour after.
There is also a subtler cost: decisions made on numbers believed current that were not. A delayed extension reading, a delayed volume pace, a delayed price against a moving average, each can be individually small and collectively expensive, precisely because nothing on screen announces its own age.
What live data does not do is oblige constant action. Traders holding for weeks use it at specific moments, entries, exits, and catalyst mornings, and ignore it the rest of the time. The point is that the data is trustworthy at the moments that decide outcomes, not that every tick demands a response.
How a Live Stock Market Screener Works
Three engineering problems have to be solved together, and a live stock market screener stands or falls on the weakest of the three solutions.
The Feed
Trades print at the exchanges, flow through market data infrastructure, and arrive at the platform, which relays changes to your browser down a persistent connection. The alternative, fetching a fresh snapshot on a schedule, is simpler to build and is what many products quietly do behind a real time label. The tell is behavioural: a streaming table changes in front of you, cell by cell; a polling table changes all at once, on an interval, or when you reload.
The Derived Values
A price arriving is the easy half. That price participates in dozens of computed fields, distance from the day’s range, relation to averages, turnover pace against the norm, and each has to be recalculated as its inputs move for the table to stay coherent. This is the layer where live claims most often turn out to be partial, with last price current and everything calculated from it stale.
The Rendering
The browser is the final bottleneck. A table naively redrawing a thousand rows on every update will freeze precisely when updates are heaviest, which is precisely when you are watching. Virtualized rendering, drawing only what is visible and updating surgically, is what keeps a live table usable at the open, and its absence is why some live screens are demonstrations rather than tools.
Then the Judgment Is Yours
None of this machinery decides anything. What streams to the table is a set of facts, current ones, and whether the volume behind a move is conviction or noise, whether a level clearing matters, whether a fading gap is opportunity or warning, remain readings only a person makes. The machinery’s contribution is narrower and essential: when you make the call, the facts underneath it are true right now.
Frequently Asked Questions
What is the best real-time stock screener?
The best real time stock screener is identified by four specifics rather than by the label: whether data is pushed continuously or fetched on reload, how many fields actually stream as opposed to the last price alone, whether extended hours activity is covered, and whether the table stays responsive under a full result set at the open. A real-time stock screener that fails the last test is real time in name only. Deepvue’s implementation streams 568 fields down a live socket while the market trades, adds 24 extended hours columns, and renders it all on a virtualized table built for a thousand rows, at $49 a month with nothing gated behind a higher tier.
Is TradingView stock screener real-time?
For US stocks, TradingView’s default data is real time, supplied through the Cboe One feed, an alternative exchange group handling a substantial share of US volume. Because that feed is not the primary exchanges, readings on thinly traded names and during extended hours can be less complete, and direct NYSE or Nasdaq data is a paid add on purchased per exchange. Most international stock data defaults to a delay of roughly fifteen to twenty minutes unless the relevant exchange feed is purchased. So the accurate answer is yes for mainstream US names by default, with the caveats living in the edges: thin tickers, pre and post market, and non US markets.
How can I see stocks in real-time?
Three routes exist. Brokerage platforms generally include real time quotes for account holders, since the broker absorbs the exchange fees. Dedicated analysis platforms with streaming architecture, Deepvue among them, deliver live data as part of the subscription. And exchange data can be purchased directly through platforms that support it, priced per exchange. What to avoid is assuming a free quote page is current: much of the free financial web runs delayed by convention, and the delay is rarely labelled prominently. When comparing stock screener tools real-time data handling is the first specification to pin down.
Are stock screeners worth it?
For anyone selecting individual stocks from a universe of thousands, yes, and the argument is arithmetic. A disciplined manual review of even two hundred charts is an evening’s work; a screen performs the disqualifying pass across the whole market in seconds and leaves a list short enough to study properly. What a screener is not worth is outsourcing judgment to. It removes what cannot qualify; deciding among what remains is still analysis, and traders disappointed by screeners are usually asking the tool to do the second job.
What is the 7% rule for selling stocks?
It is the sell discipline popularised by William O’Neil: if a stock falls seven to eight percent below your purchase price, sell it, without exception and without waiting for the story to improve. The reasoning is asymmetry, small losses are recoverable and large ones are not, and the rule exists precisely because holding losers in hope is the most expensive habit in trading. It is a risk management convention rather than a law of markets, and practitioners implement it through stop orders or through manual discipline, but the underlying principle, that the first loss is the cheapest, has aged well.
How much money do day traders with $100,000 accounts make per day on average?
There is no honest average to give, because the distribution is dominated by losses. The academic research on day trading populations consistently finds that a large majority lose money over time and only a small fraction sustain profits after costs, so the representative outcome for that account is negative, whatever the outliers earn. Figures circulating online skew heavily toward survivors and sellers of courses. It is also a different discipline from the one Deepvue is built around, which is holding leading stocks for weeks to months rather than trading intraday.
Is it illegal to buy and sell a stock in the same day?
No. Buying and selling the same stock within a session is entirely legal. The confusion comes from the pattern day trader rule, a US regulation under which a margin account executing four or more day trades within five business days is designated a pattern day trader and must maintain at least $25,000 in equity to continue. Falling under the threshold restricts the activity in margin accounts; it does not make it unlawful, and cash accounts are outside the rule entirely, constrained instead by settlement timing.
What is Warren Buffett’s 90/10 rule?
It is an allocation Buffett described for his own estate’s trustee: ninety percent in a low cost S&P 500 index fund, ten percent in short term government bonds, held indefinitely. The logic is that most investors, professionals included, fail to beat the index after costs, so owning the index cheaply and leaving it alone outperforms most attempts at cleverness. It belongs to passive long horizon investing, a different discipline from active trading, and its relevance to a trader is mostly as a reminder that active approaches must clear that simple benchmark to justify their effort.