The Double Bottom Stock Screener Built for Reversal Traders
Reversal patterns punish impatience. Every stock making a lower low eventually stops making them, but almost none of the ones you notice mid decline are the ones that turn. The double bottom separates those two groups, and it only does so after the second low holds and price clears the peak between them. Everything before that confirmation is a guess.
That is a screening problem more than a charting problem. You cannot watch a thousand damaged charts waiting for second lows, which is the entire case for running a double bottom stock screener instead. Deepvue was built for traders who need the machine to do the watching.
Its screening engine makes 1,152 fields available as sortable columns and filter conditions, refreshes 568 of them continuously while the market is open, and ships with more than 150 prebuilt screens. Results sit on the same page as charts, watchlists, alerts and a plain language terminal, so nothing here requires a second tab.
Why Deepvue Is the Best Double Bottom Screener
Reversal screening asks something unusual of a tool, which is why the best double bottom pattern chart screener looks different from a momentum scanner. Most screens reward strength, and a stock forming its second low has none yet by conventional measures.
It sits below its moving averages, its relative strength reading is poor, and its yearly performance looks bad. A screener that only knows how to find leaders will never show it to you. The best double bottom screener has to describe position within a range, not just momentum, and it has to let you loosen the leadership rules without abandoning quality altogether.
Presets the Best Double Bottom Screener Needs
Over 150 screens ship with the platform. Eighty of them carry a professional trader’s name, 18 come from Deepvue’s own team, and what remains is sorted under four category labels covering technicals, fundamentals, momentum and earnings.
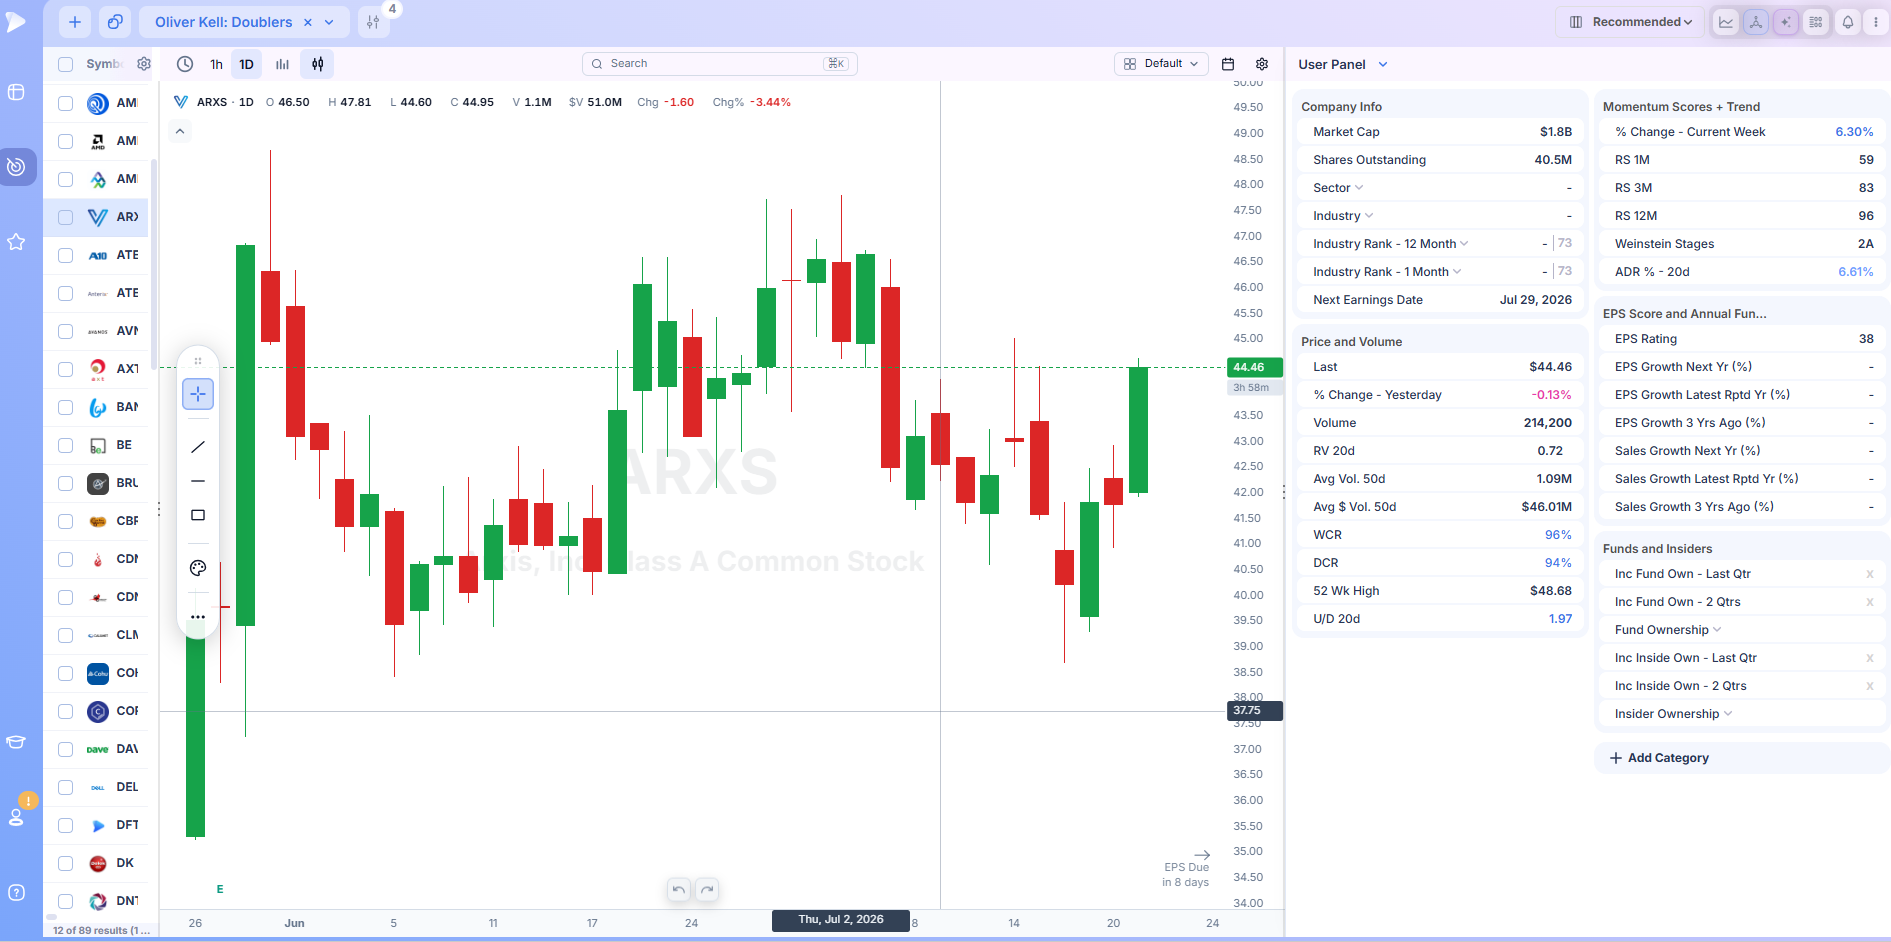
Two are unusually well suited here. Oliver Kell – Strength On Down Day picks out issues that refuse to break when the tape is heavy, and refusing to break is precisely the behaviour a second low is meant to demonstrate.
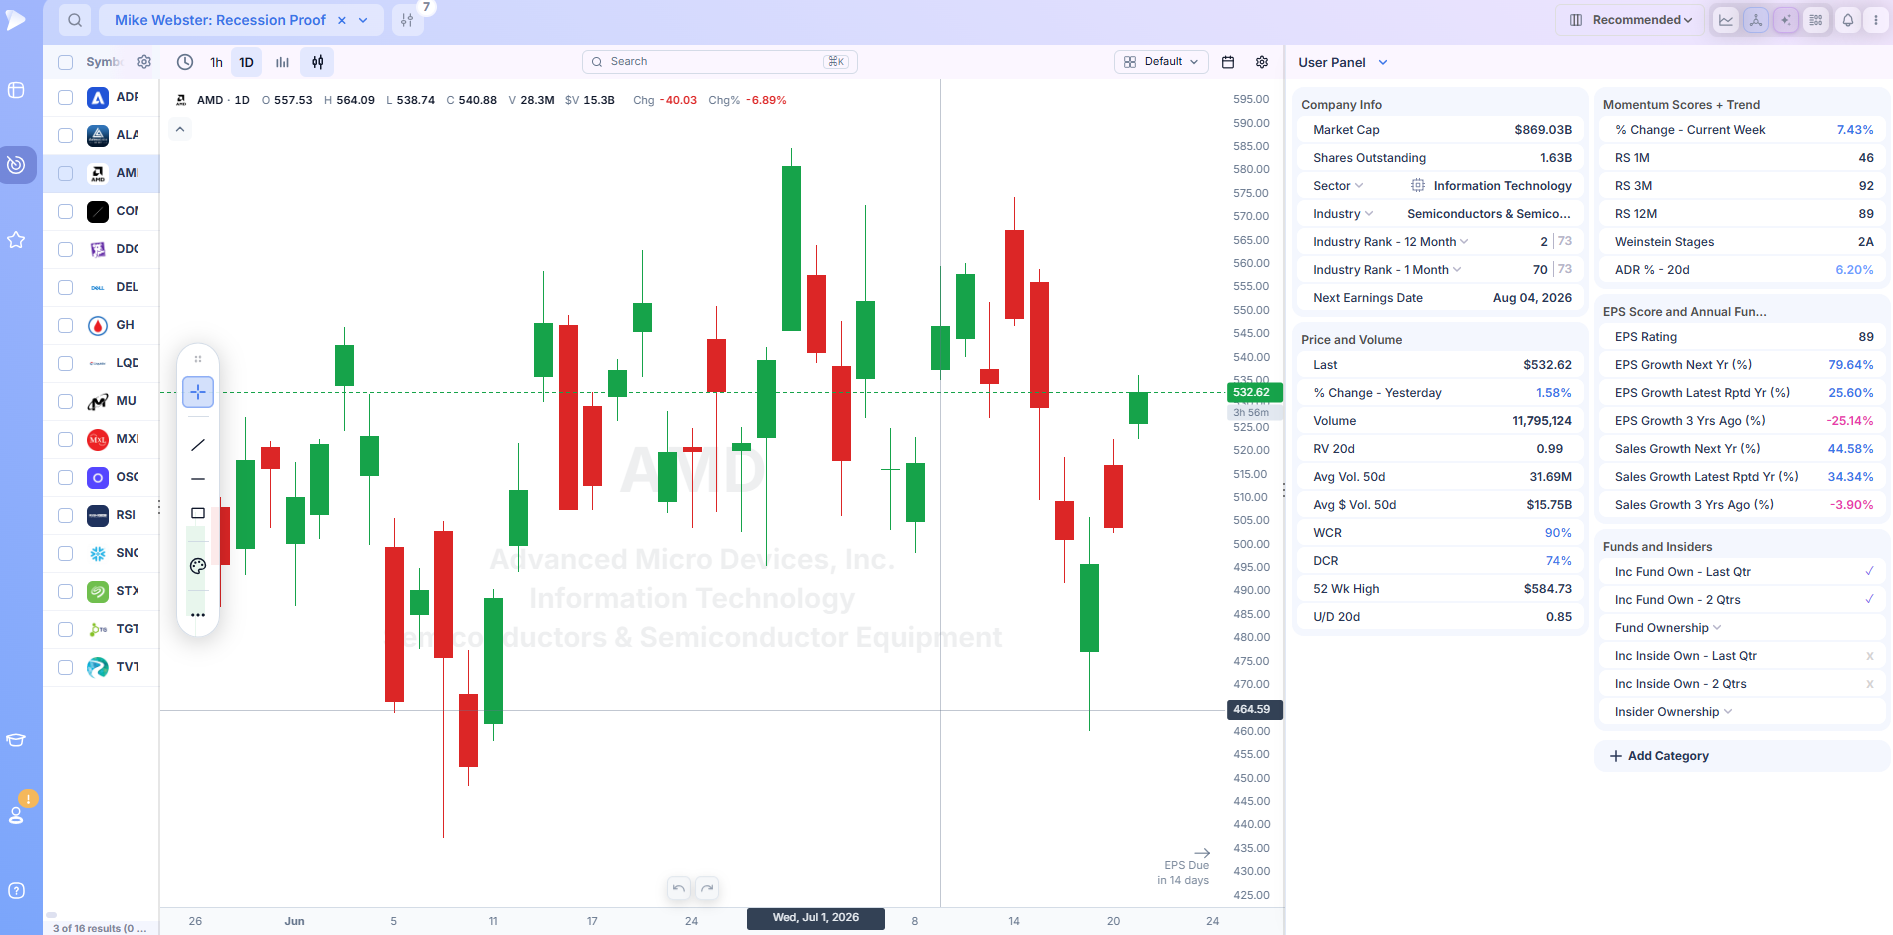
Mike Webster – Recession Proof hunts cycle defying names with structural demand, and that description maps closely onto the sort of business worth holding through a bottoming process instead of one simply bouncing on short covering.
Any of them launches with a click, and none is fixed. Start one, read the output, add rules of your own, then store the result as a screen of your own naming.
Range Position Fields a Double Bottom Chart Pattern Screener Depends On
The stock you want has stopped going down but has not yet started going up. Describing that state requires fields that place price inside a range rather than fields that measure trend.
The Price and Volume group, 145 fields in total, carries what you need: how far below the annual high price sits, where it rests inside its recent span, how much daylight separates it from the annual low, and the gap behaviour around each of the two troughs.
Add the Technicals bucket on top, 276 fields deep, and the confirmation signals get expressed separately: a moving average reclaimed, an oscillator lifting off an extreme, momentum crossing back through zero. None of this is collapsed into a single composite score, and that separation is exactly what a double bottom chart pattern screener requires, because the range conditions and the turn conditions describe different moments.
Grouped Logic for a Two Low Structure
The pattern has two lows at similar levels separated by a rally, so a screen describing it holds conditions about different windows in time at once. Deepvue’s visual builder solves this with named condition groups joined by ANY or ALL operators. One group can hold your range and damage limits, a second can hold the recent turn conditions, and you set how strictly the two need to agree.
Four condition types cover the ground: numeric ranges, list selections, text matches and yes or no boxes. No formula language is involved anywhere. A working set can be named, filed and recalled the next morning, and any preset will stack onto rules you wrote yourself if a second strategy deserves a layer.
Live Columns Through the Confirmation Bar
The trade in this pattern is triggered by a specific event: price closing above the intervening peak on convincing volume. That is a moment, not a condition that persists for days, and a screen refreshed overnight will hand it to you a session late.
During open hours 568 fields arrive over a persistent connection rather than a page refresh, and every cell marks itself the instant a value changes. The table underneath is built to stay smooth at a thousand rows. Twenty four more columns cover trading before the open and after the close, which is frequently where a confirmation gap begins.
Say It Rather Than Build It
Deepvue’s terminal parses ordinary sentences. Ask it for names holding above a low they set two months ago while pushing back toward the high in between, and it constructs the conditions, executes them and returns the list.
An @ pulls a watchlist into the query, a slash runs commands, and a Prompt Library covers you when the wording is the obstacle. Access is uncapped. No daily limit, no charge per question, so rewriting the description until the output looks right is free.
Watching Is Most of the Job
Weeks can separate a second low from its confirmation, so Deepvue treats tracking as the primary task. Tick several rows and dispatch the lot to a watchlist in a single move. Pull one name up next to its chart. Attach an alert with one click; the alerts panel will surface it the moment the level gives way. Something spotted in week one should not have to be rediscovered in week six.
Who This Screener Suits
- ✓Traders who buy turns rather than breakouts and need range aware screening to find them
- ✓Growth stock traders holding positions for weeks or months who want reversal candidates alongside leadership names
- ✓CANSLIM practitioners who treat the double bottom as one of the legitimate base structures
- ✓Anyone monitoring a damaged watchlist for the names that repair first
- ✓Traders migrating off older software who want fields that update during the session
Pricing
Deepvue sells a single plan priced at $49 each month. That single price covers the whole 1,152 field library, every preset, the visual condition builder, terminal access without a cap, plus charting, watchlists and alerts. No capability is reserved for a premium tier and none carries a surcharge.
The comparable MarketSurge subscription runs $149 each month.
What Is a Double Bottom Pattern?
A double bottom is a bullish reversal formation. Price falls to a low, rallies to an interim peak, falls back to roughly the same low a second time, then turns up again and eventually closes above that interim peak. The resulting shape resembles the letter W.
It appears at the end of a decline rather than inside an advance, which distinguishes it from continuation structures like the flat base or the cup. The pattern’s argument is about failure: a downtrend continues only if each low undercuts the last one, so when a second attempt at new lows fails to produce them, the trend that had been in force has stopped working.
Confirmation is not optional. Two lows at a similar level are just two lows. The pattern is only complete once price closes above the peak that sits between them, and traders who buy the second low before that happens are anticipating a reversal rather than trading one.
The Anatomy of a Double Bottom
Structural characteristics worth measuring:
- •A genuine prior downtrend. The pattern reverses something. Two lows at similar prices inside a sideways range are support, not a reversal formation, because there was no trend in place to reverse.
- •Two lows at comparable levels. The second low usually lands within a few percent of the first. It can be marginally higher or marginally lower. A second low that undercuts the first and then recovers fast is often the stronger version, because it flushes the last holders before turning.
- •Meaningful separation between them. The lows want weeks between them, not days. A one to three month gap is typical on daily charts. Lows only a few sessions apart describe short term support rather than a completed reversal.
- •An interim peak with a defined level. The rally between the lows sets the confirmation line. Its height also matters, because a very shallow middle rally means buyers were barely present, and any best double bottom chart screener setup should let you require a minimum.
- •Heavier volume on the second low and at the breakout. Ideally turnover thins into the second low, evidence that sellers have run short, then swells as price takes out the middle peak. Breakouts that arrive on unremarkable turnover are the single most common way this structure disappoints.
The measured move target is conventionally taken as the distance from the lows to the interim peak, projected upward from the breakout level. A stop belongs beneath the second low, and how far that sits from your entry decides whether the trade justifies itself.
Why the Pattern Forms
The first low is where selling exhausts itself temporarily. Forced sellers finish, short sellers take profits, and the absence of supply lets price lift. The rally that follows is usually met with scepticism, so it stalls somewhere below the prior highs and rolls over.
The second decline is the important part. Everyone who bought the first bounce is now underwater and has a reason to sell. If the stock were still genuinely broken, that pressure would carry it to new lows without difficulty. When it fails to, the message is that demand at that level is no longer coming only from short covering. Real buyers are absorbing what is being sold.
The interim peak becomes the reference point because that is where the first rally failed. Everyone who bought it is sitting on a loss, and that overhead supply is what caps the second rally as it approaches the same level. Clearing it means the stock has absorbed both the trapped buyers from the first bounce and the sellers from the second decline. Very little supply remains above, which is why confirmed double bottoms often move quickly once the level gives way.
How a Double Bottom Stock Screener Works
Patterns are shapes, and no database column stores a shape. There is nothing to filter on that returns true for a W. What a double bottom stock screener can do is express the pattern’s measurable properties as conditions, shrink several thousand names down to a few dozen, and return the structural verdict to the person reading the chart.
Four groups of conditions carry most of that weight, and a double bottom chart pattern screener is only as good as the control it gives you over each one.
What a Double Bottom Pattern Stock Screener Must Isolate
The universe here is the opposite of a leadership scan. You want stocks well below their highs, which is easy, while excluding those still in freefall, which is not. Percentage below the yearly high sets the first boundary. Distance above the yearly low sets the second, because a stock sitting at its absolute low has no second bottom yet. Liquidity minimums matter more than usual in this population, since low priced damaged names dominate the results otherwise.
Locating the Second Low
The defining condition is a recent low that did not undercut an older one. Approximated with screening fields, that means requiring a low within a recent window that sits close to but not below the low of a longer window. Among the 145 Price and Volume fields you will find the range, volatility, turnover and gap measures needed to draw that comparison.
Catching the Turn
A second low that has not turned yet is just a low. Conditions describing the reversal include price reclaiming a short term moving average, an oscillator lifting from an oversold reading, and recent gains against a still weak longer term picture. Technicals hold 276 fields across moving averages, oscillators, momentum and trend, so the turn can be specified loosely or strictly according to how early you are willing to be.
Why the Best Double Bottom Chart Screener Filters Fundamentals
Plenty of stocks trace a technically valid W and go nowhere, because nothing changed in the underlying business. This is where the best double bottom pattern chart screener earns its keep against a pure chart tool, and where a double bottom pattern stock screener separates itself from a drawing package.
There are 227 earnings fields, 159 fundamental ones and 126 covering sales, every one usable as a condition, which lets you insist that the top line is still expanding or that analyst estimates have stopped sliding. Ownership adds another layer, with 84 fields devoted to institutions and insiders, and purchases by insiders around a second low have long been treated as meaningful.
Then You Read the Chart
Output from any screen is a candidate list. Whether the two lows are genuinely comparable, whether the separation between them is right, whether the middle peak sits at a sensible height and what volume did at each stage are all judgments the eye makes better than a filter. Deepvue is arranged for it. Pull any row up alongside its chart, or flip the entire output into tiled miniatures and judge thirty candidates during the minute you would otherwise spend opening four.
Frequently Asked Questions
Is a double bottom bullish?
Yes. Textbooks file it under bullish reversals, because it develops inside a decline and is expected to resolve to the upside. The classification describes the anticipated direction, not the odds. An unconfirmed double bottom carries no bullish implication at all, and even a confirmed one fails regularly when the broader market is falling or when the breakout arrives without volume behind it.
What is an example of a double bottom?
A representative case runs like this. A stock declines 40 percent over four months and puts in a low. It rallies roughly 15 percent over three weeks, stalls, and turns back down. Six weeks later it returns to within two percent of the original low, this time on noticeably lighter volume, and holds.
It rallies again, and after a further month it closes above the interim peak on volume three times its recent average. Committing individual historical charts to memory helps less than volume of exposure. Traders build the instinct by running a double bottom stock screener repeatedly and putting many candidates beside each other.
How do you know if a stock has bottomed?
You do not know it at the time. Bottoms are identified afterward. What you can observe are conditions that make one more plausible: declining volume on successive lows, an inability to make new lows despite bad news, relative strength improving against the index while price is still flat, and the first higher high after a sequence of lower ones. The double bottom is one framework for reading those conditions, and its confirmation rule exists precisely because the pattern is unreliable before that point.
What does triple bottom mean in trading?
A triple bottom is the same idea with three touches of the support level instead of two, separated by two interim rallies. It is less common and generally read as stronger, since the level has withstood three tests rather than two. Confirmation works identically, requiring a close above the highest of the intervening peaks. In practice the distinction is often ambiguous, and traders disagree about whether a given formation is a triple bottom or a double bottom with a messy second low.
What is the strongest bullish pattern?
No pattern is strongest in isolation, and any source claiming one is overstating what the evidence supports. Reliability depends far more on context than shape: the same formation behaves very differently in a strong market than in a falling one, and differently again in a leading stock than in a laggard. That said, patterns that require an explicit confirmation event before entry, the double bottom among them, tend to produce better outcomes than those entered on anticipation, mainly because the confirmation filters out a large share of failures before any money is committed.
How do you confirm a double bottom?
Confirmation is a close above the peak that formed between the two lows, ideally with turnover far heavier than the recent norm. Some traders wait for a daily close, others require a weekly close for a stronger signal. Additional confirmation often comes from the stock reclaiming a longer term moving average around the same time and from relative strength turning up. Without the close above the interim peak, the structure is unconfirmed regardless of how convincing the two lows look.