The Cup and Handle Pattern Stock Screener Built for Base Traders
A cup and handle pattern screener has to solve a counting problem. The pattern takes weeks or months to build, which means the useful window is not the day it completes but the stretch before it does, while the handle is still drifting and the pivot has not yet printed. Traders who wait for a finished chart are looking at a move that already started, so a cup and handle screener earns its value on the names it catches mid formation.
Deepvue serves traders who work from base structure rather than signals. Its screening engine turns 1,152 fields into conditions you can filter and sort on, streams 568 of those fields as the session runs, and ships with more than 150 ready-made screens. Charts, watchlists, alerts and a natural language terminal sit on the same surface, so nothing about this workflow requires a second tab.
Why Deepvue Is the Best Cup and Handle Stock Screener
Screening for base structure exposes a gap in most tools, which is why choosing a cup and handle stock screener usually means accepting a trade off. Lightweight platforms give you price and volume but nothing that describes where a stock sits inside a consolidation.
Heavier platforms give you the depth but bury it behind configuration work that takes longer than reading the charts by hand would. The best cup and handle pattern stock screener has to close both ends of that gap.
Presets That Already Know What a Base Looks Like
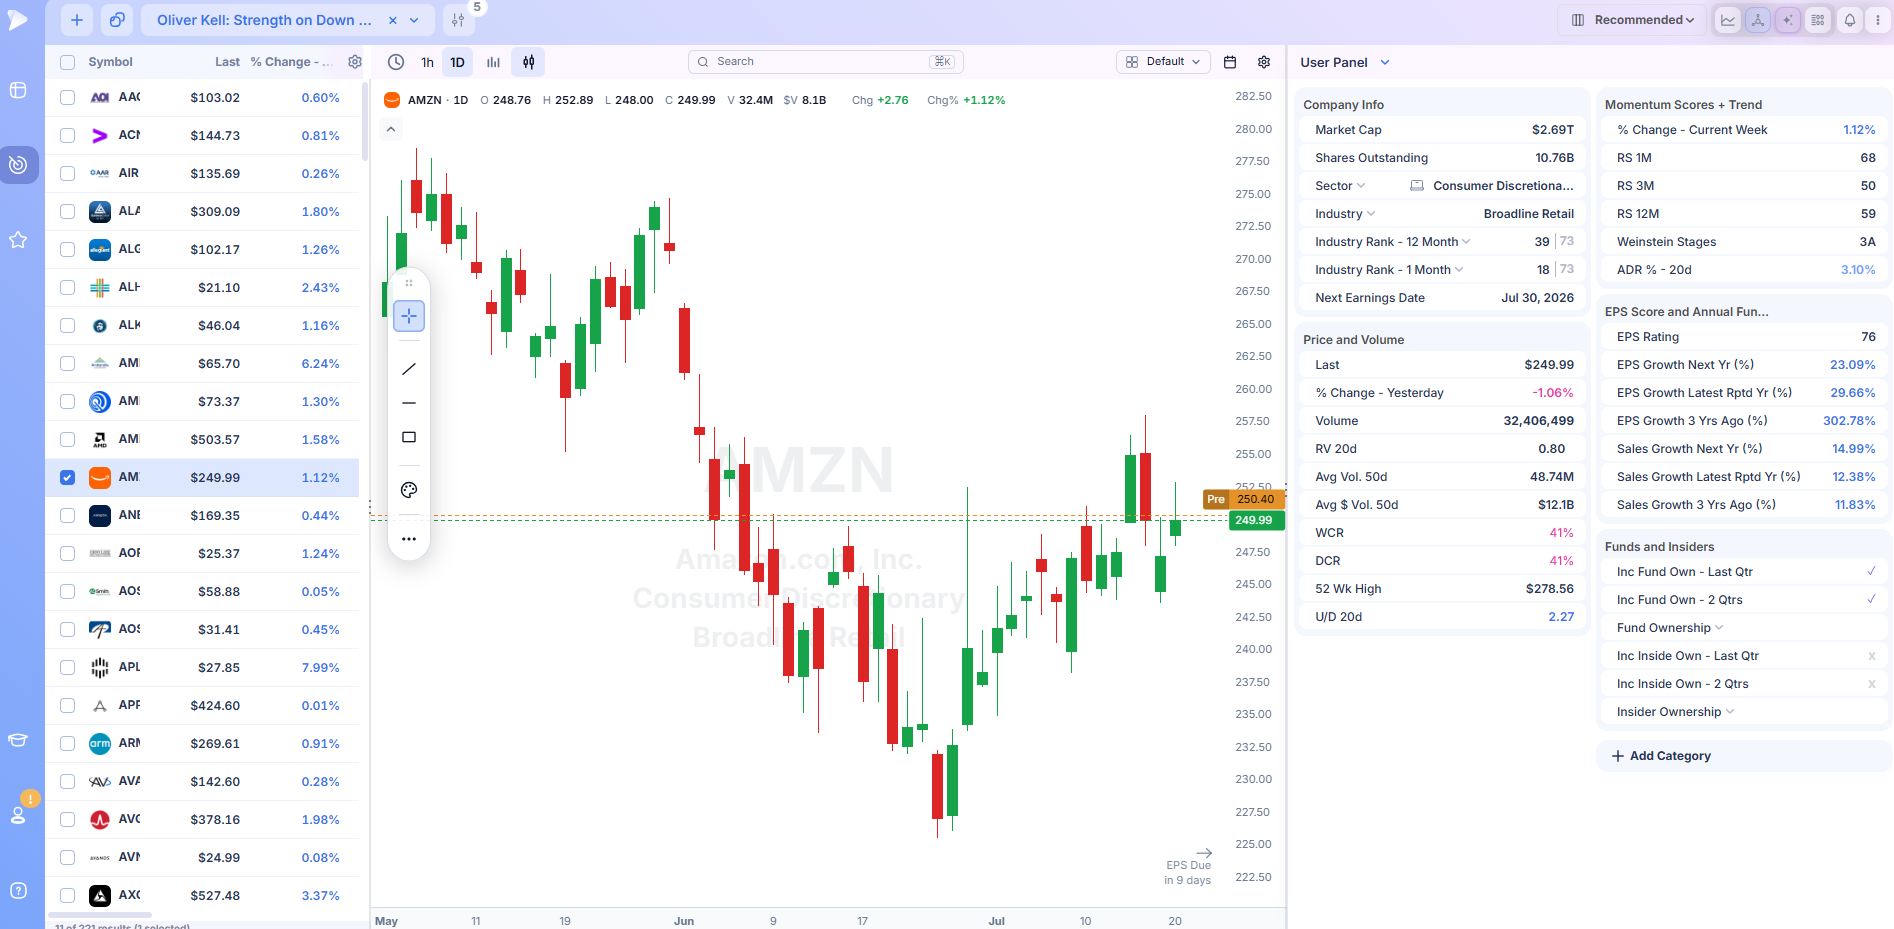
The preset library runs past 150 screens. Eighty carry the name of a working professional, another 18 come from the Deepvue team, and the balance sit under Technical, Fundamental, Momentum and Earnings headings. A cup and handle pattern stocks screener needs a leadership universe before anything else, and several of these produce exactly that.
Deepvue Leaders returns whatever is leading on relative strength right now, which is the population where proper cups form in the first place. Oliver Kell – Strength On Down Day isolates names holding their ground while the broader market gives back, a behaviour that shows up repeatedly in the right side of a well formed base.
Under Technical, the Volatility Contraction screen flags tight basing with low ATR, which is a reasonable proxy for the handle stage of the pattern.
Any of them opens with a single click. None of them is final. Run one, study the output, bolt your own rules onto it and store the combination under a name you will recognise next week.
O’Neil’s Framework, Available as Filters
The cup and handle came out of William O’Neil’s work and remains the anchor pattern of the CANSLIM methodology. That methodology never treated the chart in isolation, which is why the pattern’s original definition carries earnings and relative strength requirements alongside the shape.
Deepvue is built for exactly that combination. The 56 Proprietary Ratings include the platform’s own composite scores, and the 227 Earnings and 126 Sales categories let you require the growth profile the framework calls for. Among the 80 professional screens, Mark Minervini – Trend Criteria checks stage, relative strength and base structure together in the SEPA tradition, which makes it a solid foundation layer before your own conditions go on top.
Filter Groups for a Two Stage Pattern
A cup and handle is two consolidations stacked on each other, and a cup and handle chart pattern screener needs to hold conditions for both. The visual builder handles this by letting you name a group of conditions and choose whether the groups relate by ANY or by ALL. Put your depth and duration rules for the cup in one group, put the tighter handle conditions in a second, then decide how strictly the two must agree.
Conditions come in four shapes: numeric ranges, multi choice lists, text matching and simple checkboxes. Nothing is typed as a formula. Once a set behaves the way you want, name it, file it in a folder and reuse it tomorrow. You can also drop a preset over the top of your own conditions when a second strategy is worth layering in.
Streaming Fields for the Moment the Handle Breaks
Handles are shallow, so they finish quickly. Clearing the handle high at 11:40 on triple normal turnover is a very different entry than buying the same name at 3pm once the move has run. Deepvue pushes 568 of its fields through a live socket connection while the session is open, flashing each cell as its number moves, across a table engineered to scroll cleanly at a thousand rows. Another 24 columns cover pre and post market activity, which is where plenty of bases actually resolve.
Type the Pattern, Get the Screen
Deepvue’s terminal reads ordinary sentences. Describe a name sitting under its old high after a small recent give back and the terminal assembles the conditions, executes them and hands you the list. An @ symbol pulls in a watchlist, a slash triggers commands and a stocked Prompt Library covers you when phrasing is the hard part. Nothing about this is metered. There is no cap per day and no charge per question, so rephrasing your description ten times until the output looks right costs you nothing.
One Surface From Scan to Alert
Bases are slow, so most of the job is watching rather than buying. Deepvue accommodates that. Select rows and send the whole selection to a watchlist at once. Open any single row beside its chart. Attach an alert in a single action and let the alerts panel tell you when it fires. A name spotted five weeks before its pivot never has to be found twice.
Who This Screener Suits
- ✓CANSLIM practitioners who refuse to separate the chart question from the earnings question
- ✓Traders whose holding period is measured in weeks and months, not minutes
- ✓Anyone who tracks bases as they develop instead of waiting for finished patterns
- ✓MarketSurge and legacy platform users who want current data and screens they can actually modify
- ✓Traders whose morning routine is base counting and pivot watching
Pricing
There is one Deepvue plan and it costs $49 monthly. Everything described on this page is inside it: all 1,152 fields, the complete preset library, the visual builder, uncapped terminal access, charting, watchlists and alerts. Nothing is gated behind a higher tier and no feature carries a surcharge.
MarketSurge, by comparison, charges $149 monthly.
What Is a Cup and Handle Pattern?
A cup and handle is a bullish continuation setup. A stock corrects into a rounded, U shaped base, recovers to near its prior high, then drifts sideways or slightly lower in a shallow secondary pullback before breaking out above the high of that drift.
William O’Neil described the pattern in the 1980s after studying the chart behaviour of the market’s biggest winners before their largest advances. It became the signature setup of the CANSLIM approach and remains the most widely recognised base structure in growth stock trading.
The name is descriptive. The cup is the long correction and recovery. The handle is the short, shallow consolidation that forms once price returns to the old high. Both parts matter, and traders who buy the completed cup without waiting for the handle typically pay more and take on a wider stop.
The Anatomy of a Cup and Handle
A well formed pattern has characteristics you can measure:
- •The prior advance. Nothing about the shape means anything on a stock that has not already gone up. Continuation requires something to continue, and a meaningful run into the base is the precondition for every other criterion here.
- •A rounded left and right side. The correction should curve rather than spike. A V shaped recovery means the decline never gave sellers time to exit, so supply remains overhead. The rounding is what makes the base constructive.
- •Proportionate depth. Most usable cups correct somewhere between roughly 12 and 35 percent from the high. Much shallower and little has been resolved. Much deeper and the damage often takes longer to repair than a single base can accomplish.
- •A shallow handle in the upper half. The handle should form in the upper portion of the cup and pull back only modestly, frequently in the range of 8 to 12 percent. A handle that cuts into the lower half of the base or gives back most of the right side advance is a warning rather than a setup.
- •Volume that dries into the handle and expands at the pivot. Volume should recede as the handle forms, indicating sellers have stepped away, then expand sharply as price clears the handle high. Volume that never contracts, or a breakout that arrives on ordinary volume, undercuts the pattern.
The pivot sits just above the handle high, and the low of the handle gives the natural stop. The tighter the handle, the smaller the distance between those two levels, which is the entire risk argument for waiting on the handle rather than buying the cup.
Why the Pattern Forms
The cup traces a full cycle of sentiment in a single structure. The left side is the correction: holders who bought late sell into the decline, and volume runs heavy because a large amount of stock changes hands. The bottom is the point at which the last motivated sellers have finished, which is why volume typically dries up there and price stops falling even without obvious good news.
The right side is recovery, but it is also a supply test. As price climbs back toward the old high, it moves through the levels where earlier buyers are sitting on losses that have just become breakevens. Some of them sell to get out flat. That overhead supply is real, and it is the reason a stock so often stalls on its first approach to a prior high.
The handle is that stall. Rather than pushing straight through, price drifts back slightly and gives the breakeven sellers their exit. Because the group is small and shrinking, the drift is shallow and volume falls away. Once it is finished, the overhead supply that stopped the first attempt has been cleared, and the next move at the high meets far less resistance than the last one did.
That sequence explains why the breakout usually expands rather than grinds. The stock is not fighting its way through sellers, because the handle removed them.
How a Cup and Handle Chart Pattern Screener Works
Chart patterns have no single field to filter on. No column returns true for a cup and handle, and a cup and handle pattern screener that claimed otherwise would be making a judgment call on your behalf about depth, duration, and handle quality. What a screen can do is describe the pattern’s measurable components, narrow thousands of names to a workable shortlist, and hand the structural judgment back to you.
That work breaks into four parts, and a capable cup and handle pattern stocks screener gives you control over each.
Establishing the Prior Advance
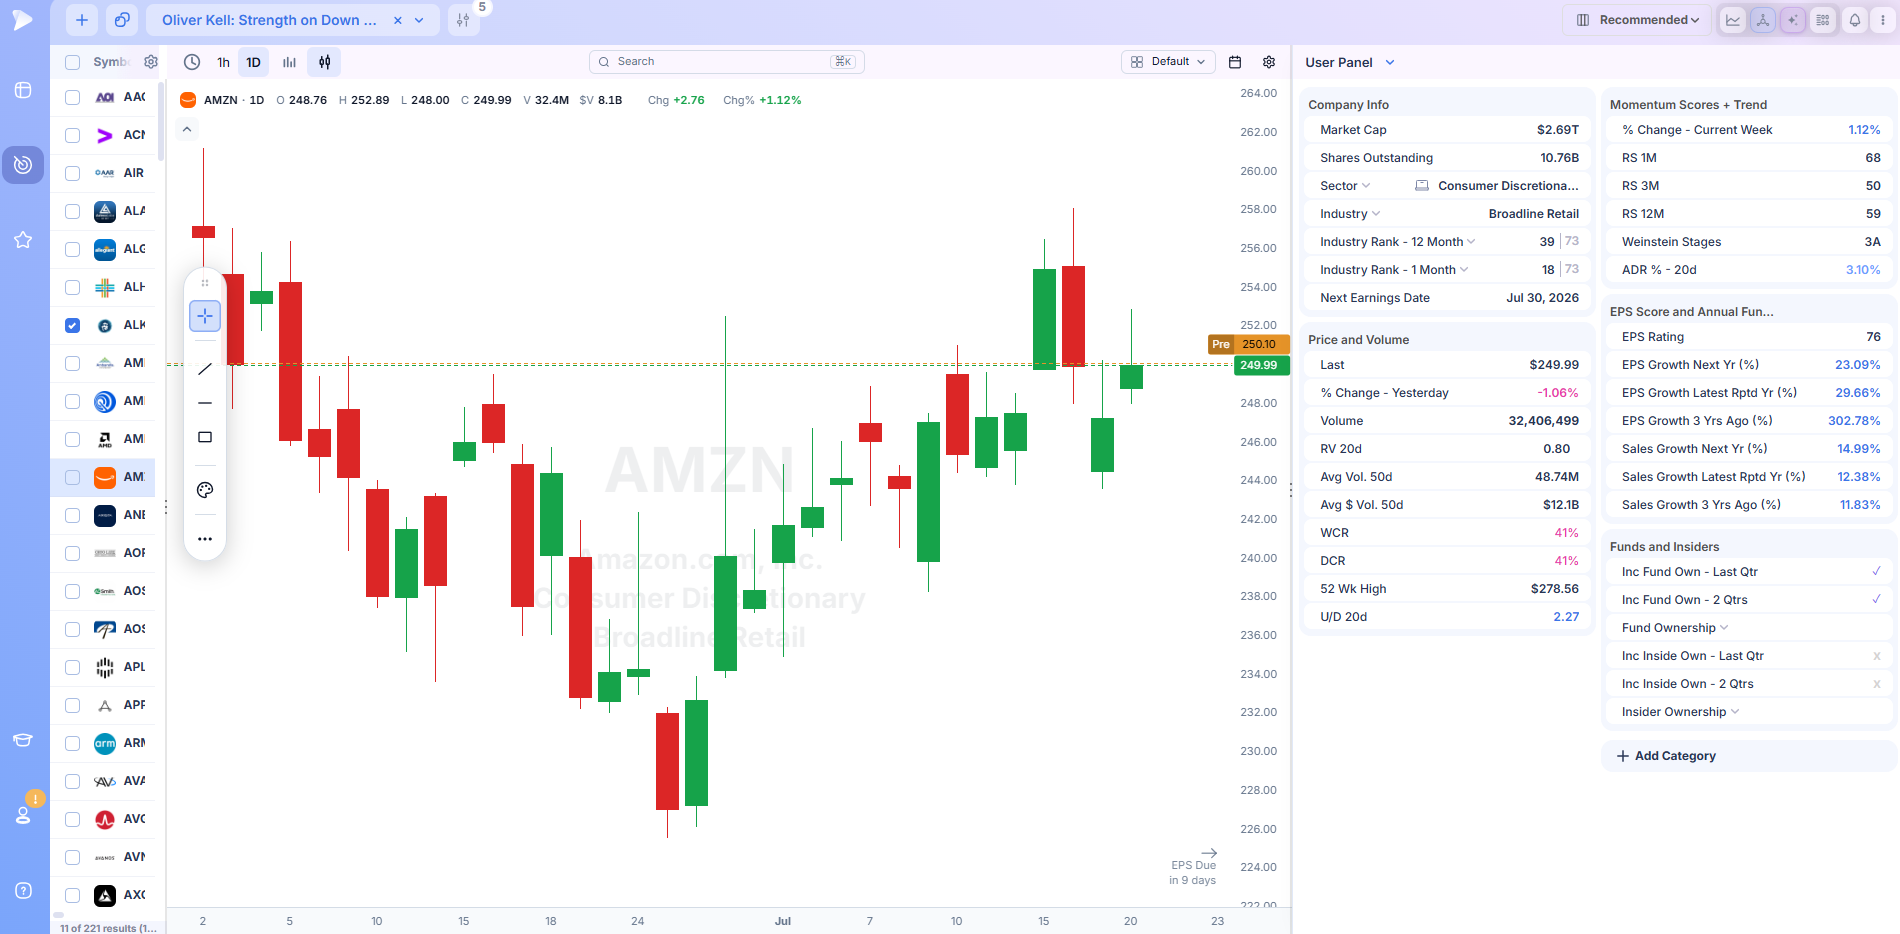
A base only qualifies if the stock earned it. Relative strength readings, standing versus the major averages and proximity to the yearly high are the three angles that separate a leader taking a rest from a name that simply broke. The Technicals bucket holds 276 fields covering trend, momentum, oscillator and moving average measures, which means leadership can be defined several different ways depending on how strict you want to be.
Describing the Base
Depth and duration decide whether a consolidation repaired the stock or damaged it. Distance below the high, the spread of a defined lookback window and where price currently sits inside its recent range each approximate the curve from a different direction. Price and volume derivatives run to 145 fields covering ranges, ATR, dollar turnover, relative volume and gap context, which is enough to put hard boundaries on the bases you are willing to look at.
Catching the Handle
The handle is where the pattern becomes tradeable and where most of a screen’s precision is earned. Recent tightness, a modest pullback from a very recent high, and reduced relative volume across the last several sessions together describe a handle in progress. Because these are short lookback conditions layered over the longer base conditions, this is where a cup and handle screener lives or dies, and where the filter builder’s grouped ANY/ALL logic does real work.
Requiring Fundamental Quality
Because the setup came out of CANSLIM, it assumes real numbers underneath the chart. Earnings fields number 227, fundamentals 159 and sales 126, all filterable, so quarterly acceleration, top line growth and margin quality can live in the same screen as the structural rules. Ownership belongs in that conversation as well: 84 fields track institutional holdings, sponsorship change and insider transactions.
Then You Confirm It Visually
What comes back is a candidate list, never a verdict. How cleanly the cup rounds, where the handle sits inside it and what volume did through both stages are judgments the eye makes, not the filter. Deepvue expects this. Open a row against its chart in a split view, or flip the whole result set into a grid of small charts and read forty names in the time it takes to click through five.
Frequently Asked Questions
What is the psychology behind cup and handle?
The cup records a full turnover of ownership. Late buyers sell through the decline on heavy volume, the bottom forms once motivated sellers are exhausted, and the recovery walks price back through levels where earlier buyers are finally breaking even. The handle exists to clear that last group. It gives breakeven holders a chance to exit in a shallow, low volume drift, so that when price returns to the high it faces far less overhead supply than it did on the first attempt.
Is cup and handle a bullish pattern?
Yes. It is classified as a bullish continuation pattern, meaning it typically forms during an uptrend and resolves in the direction of that trend. That said, classification is not prediction. A pattern that forms in a laggard, in a weak market, or that breaks out without volume expansion fails regularly. The bullish label describes the expected resolution, not a probability.
What is an example of a cup handle pattern?
A representative case looks like this. A stock advances strongly, then corrects roughly 25 percent over three months in a rounded shape with volume heaviest early in the decline. It recovers over the following two months back to within a few percent of its old high. There it stalls and pulls back around 9 percent over two weeks, with volume falling to well below average through the drift. It then clears the handle high on volume several times its recent norm.
What does a 4 handle mean?
This is trading floor shorthand and is unrelated to the chart pattern. The handle in this sense is the whole number portion of a price. A stock quoted with a 4 handle is trading somewhere between $4.00 and $4.99. Traders use it to communicate price levels quickly without repeating the decimals.
What is a 5 handle?
A price in the five dollar range, anywhere from $5.00 to $5.99. The same convention scales up: a 250 handle on an index means it is trading between 250 and 251. Note that this usage collides confusingly with the chart pattern, so context decides the meaning. If someone is discussing base structure they mean the consolidation. If they are calling out a level, they mean the whole number.
What is a 6 handle?
A price between $6.00 and $6.99. As with the others, this is quoting shorthand rather than technical analysis terminology and has no relationship to the handle portion of a cup and handle base.