The Exponential Moving Average Stock Screener Built for Trend Traders
Almost every trader has an opinion about moving averages. Far fewer can act on that opinion across the entire market at once. Knowing that a stock holding its rising fifty day line during a pullback is constructive is worth very little if finding those stocks means opening charts one by one.
That gap between knowing and screening is what this page is about. Used as an EMA stock indicator on one chart at a time the tool is ordinary. Used as a screening condition across the entire market it becomes something else, which is what an exponential moving average stock screener is for.
Deepvue’s screening engine holds 276 technical measures, the moving averages among them, and treats each as a condition you can filter on and a column you can sort by rather than a line you merely look at. Those measures belong to a wider set of 1,152 fields, 568 of which refresh continuously while trading is open.
The averages plot in charts, and whatever the screen returns carries through to watchlists, the alerts panel and a terminal that takes plain sentences, none of it needing a second tab.
Why Deepvue Is the Best Exponential Moving Average Stock Screener
Moving average conditions are common enough. What separates one tool from another is how many can be held in a single query and what else can sit beside them. Treating the exponential moving average indicator as a first class screening field rather than a chart overlay is the whole distinction, and it is what separates a genuine exponential moving average stock screener from a charting package with a filter bolted on.
A useful exponential moving average stock screener has to hold several averages in one query, since almost every serious application of the idea involves more than a single line. It has to express distance from an average, not merely which side of it price sits, because a stock four percent above its fifty day is a different trade from one twenty percent above. And it has to sit next to earnings, volume and relative strength conditions, since a moving average tells you about trend and nothing whatsoever about whether the trend deserves to continue.
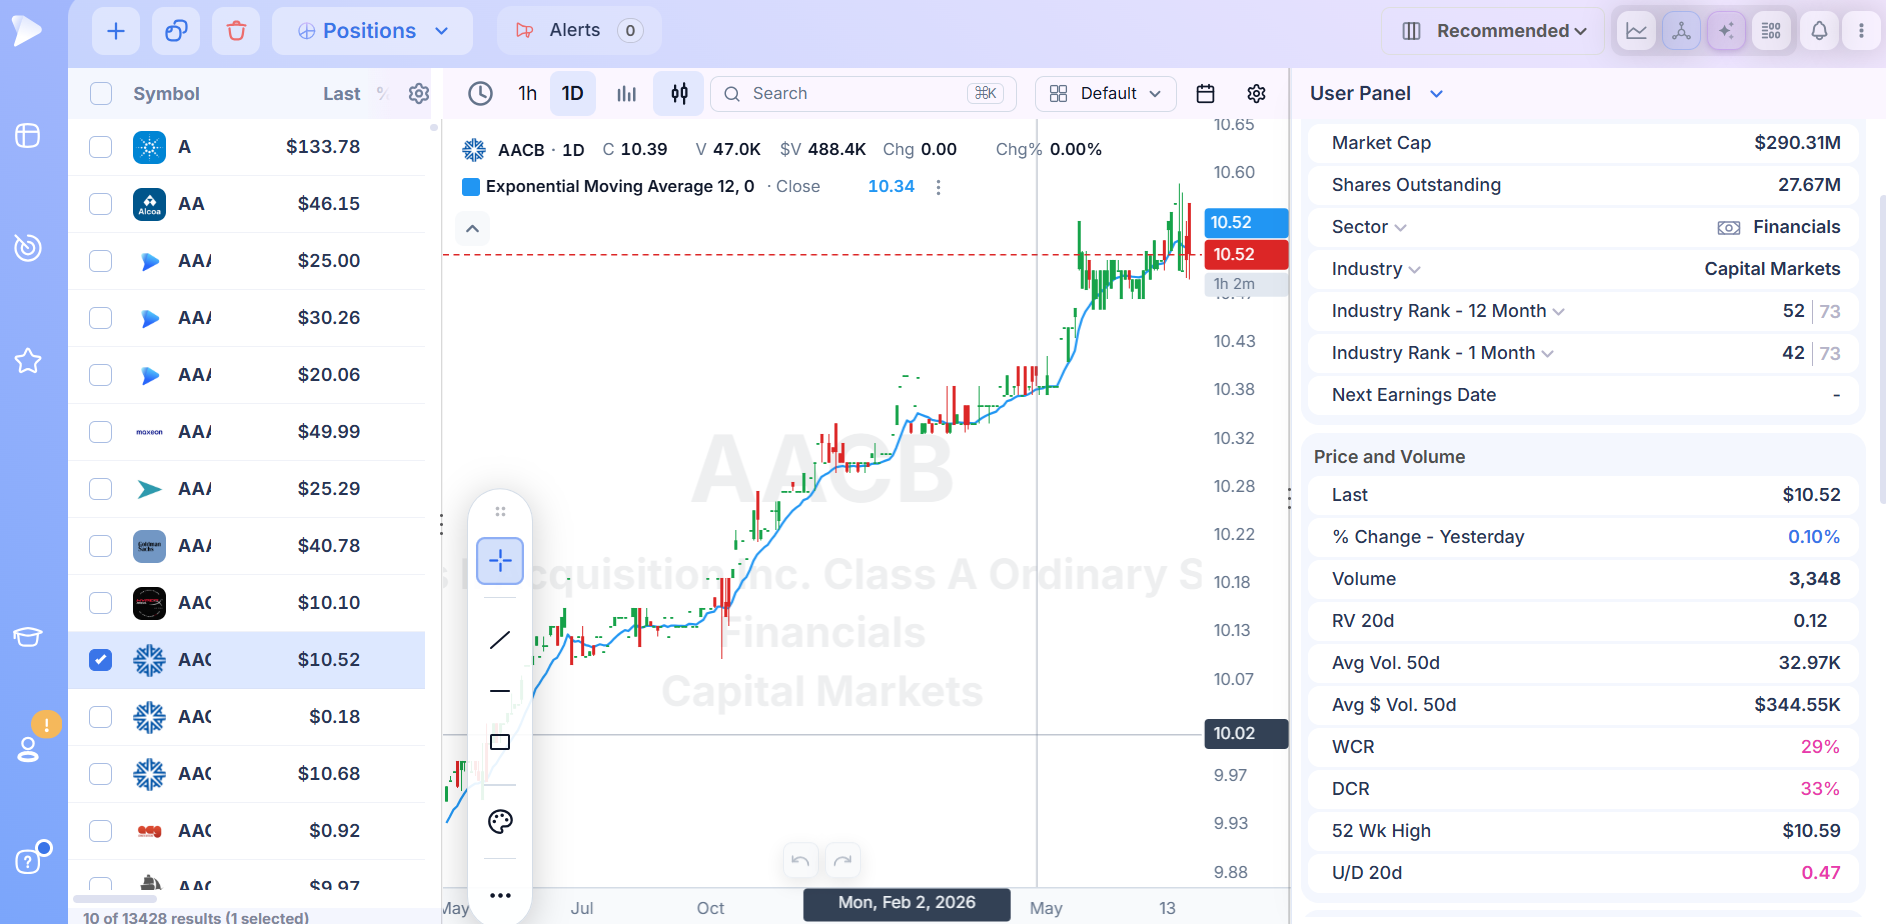
An EMA Stock Screener Finds Stocks Above the Line
What any EMA stock screener can do is bounded by the fields sitting behind it. All of the platform’s moving averages live in the Technicals group, 276 measures strong, and each is handled like any other field: available as a filter, available as a sort, addable to the table as a column.
That means finding stocks above exponential moving average lines of any length becomes a threshold rather than a manual chart review, and the same field can be sorted to rank the population by how far above or below it currently trades.
That same group carries the Webby and Qullamaggie measures, worth noting because both of those approaches build entries around how price behaves at an average rather than treating the lines as decoration.
Stacking Averages: The Basis of Any EMA Trading Strategy
Most moving average methods are multi line. A trend template might require price above the fifty, the fifty above the two hundred, and the two hundred itself rising. The visual builder addresses this with named bundles of conditions and an ANY or ALL setting between them, so an entire alignment becomes one bundle that sits beside whatever else the screen requires.
No formula language is involved. Conditions are numeric bounds, list choices, text matching or tick boxes, and once the set works it can be saved under a name, filed away and pulled up again next session.
Measuring Distance, Not Just Position
Whether price is above an average answers a yes or no question. How far above it answers a better one. Extension from a moving average is among the more reliable indications that an entry has become poor even when the trend is intact, and traders who buy leaders need that measure as much as they need the trend confirmation itself.
Extension only means something with volatility context attached, and that comes from the 145 measures of range, ATR and turnover in the Price and Volume group. Twelve percent above the twenty day is unremarkable for a fast moving name and extreme for a sedate one.
A Preset Built on the Exponential Moving Average Indicator
Minervini’s Trend Criteria is one of the eighty screens attributed to working professionals, checking stage, RS and base structure together the way SEPA prescribes. Average configuration is central to that trend template, so the preset gives anyone assembling a moving average screen somewhere to begin other than an empty panel.
Run it, read what it returns, then adjust the thresholds and store the result under your own name.
Combining Trend With a Reason to Trade It
A moving average is a description of trend, not an argument for it. Every stock in a sustained advance eventually rolls over, and nothing in the average tells you which ones are about to.
The neighbouring categories exist for that reason. There are 227 measures covering earnings and another 126 covering sales, which is where you establish whether the company justifies the chart. Institutional and insider holdings account for 84 more. RS Rating sits within the 56 proprietary scores and pairs naturally with average based conditions, since trend and outperformance answer different halves of one question.
Live Values as Price Crosses
Crossovers happen at a moment. A stock reclaiming its fifty day at 10:40 on heavy volume is a different situation from the same stock closing back beneath it at 3:50. During market hours 568 measures refresh continuously instead of on reload, each cell marking itself as the number underneath changes, on a grid engineered to remain quick at a thousand rows. Twenty four additional columns handle extended hours either side of regular trading.
From Screen to Alert at the Line
Moving average setups often require waiting for price to reach the line rather than acting immediately. Mark the rows worth keeping and move them to a watchlist together. Bring any of them up against its chart. Put an alert on the average itself and the panel will report when price arrives there, so the waiting is not yours to do.
Who Should Use This Screen
- ✓Traders who treat moving averages as a filter on the universe rather than as a buy signal
- ✓Swing traders working pullbacks to the twenty or fifty day line
- ✓Position traders who need the longer averages as a regime filter
- ✓Anyone running a trend template that requires several averages aligned at once
- ✓Anyone on a platform that draws these lines beautifully and then offers no way to scan the market with them
Pricing
A single Deepvue plan costs $49 a month. It carries all 1,152 measures with the 276 Technicals among them, every preset on the platform, the visual builder, unmetered terminal use, plus charting, watchlists and alerting. No tier sits above it.
MarketSurge asks $149 a month for its equivalent.
What Is the Exponential Moving Average?
A moving average smooths price into a single line by averaging it over a set number of periods. The exponential moving average does the same job but weights recent prices more heavily than older ones, so the line responds faster to what price is doing now.
The weighting decays exponentially, which is where the name comes from. Yesterday’s close influences the reading more than the close a month ago, and that influence tapers smoothly rather than cutting off. A simple moving average, by contrast, treats every period in its window identically and then drops the oldest one entirely when a new period arrives.
The practical consequence is responsiveness. An exponential moving average turns sooner after a change in direction and tracks price more closely during a trend. It also produces more false signals in choppy conditions, which is the trade off the entire simple vs exponential moving average debate turns on.
Simple vs Exponential Moving Average
Neither is better in the abstract. They answer slightly different questions and suit different periods.
- •The simple moving average treats all periods in its lookback equally. It is smoother, slower and less prone to whipsaw, which makes it well suited to the longer settings where you want a stable reference rather than a responsive one. Most traders who watch a two hundred period line use the simple version for exactly this reason, and much of the institutional convention around that level assumes it.
- •The exponential moving average front loads recent data. It reacts faster, hugs price more tightly and identifies changes in direction earlier. That responsiveness earns its keep on shorter settings, where the point of the line is to track current behaviour rather than describe the long term regime.
The common resolution is to use both according to period. Shorter lines exponential, longer lines simple. Plenty of successful traders ignore this entirely and run one type throughout, which is a reasonable indication that the distinction matters less than consistency in how you apply it.
Best EMA Settings: The Three Standard Periods
Three periods dominate practical use, and each answers a different question.
- •The 20-day exponential moving average. The short term reference. It tracks price closely during an advance and functions as the line a strong stock rides in a fast move. Traders watching 20-day EMA stocks are usually hunting names in an active uptrend that dip to the line and resume, a shorter hold than the fifty day equivalent. The 20-day exponential moving average is the line most often quoted when someone describes a stock as riding its average.
- •The 50-day exponential moving average. The swing trading standard, and the one most growth traders use as their primary reference. It is slow enough to ignore ordinary noise and fast enough to matter over a holding period counted in weeks. Screening for 50-day EMA stocks that have pulled back to a rising line is among the more common growth trading setups, which is why the 50-day exponential moving average appears in more trend templates than any other setting.
- •The 200-day exponential moving average. The regime line. Its main use is binary: above it, the longer trend is intact; below, it is not. Few traders enter on this line, but a great many use the 200-day exponential moving average to decide whether to be hunting entries at all.
The best EMA for stocks depends entirely on holding period, and asking which is best without naming that period is an unanswerable question. There is no single best EMA indicator and no universal best EMA settings, only a length matched to how long you intend to hold.
An EMA indicator for swing trading runs longer than the settings used on intraday charts, and the same number will feel sluggish to one trader and frantic to another. Traders screening exponential moving average stocks should settle their horizon before arguing about lengths. Deepvue is built for holds measured in weeks and months, so the twenty and fifty period lines carry most of the weight here.
The Exponential Moving Average Crossover Explained
An exponential moving average crossover happens when a shorter line crosses a longer one. Upward crossings are read as bullish, downward as bearish.
The mechanism is simply that a shorter average reflects recent price and a longer one reflects established price. When the short line pushes above the long, recent behaviour has diverged upward from the established pattern, which is what a change in trend looks like expressed arithmetically.
The most watched configuration crosses a fifty period line through a two hundred period line, called a golden cross upward and a death cross downward. These get substantial financial media coverage, and their record is considerably more mixed than that coverage suggests, largely because both averages are slow enough that the crossing occurs well into a move that is already underway.
Shorter combinations trigger earlier and produce more false signals. This is the unavoidable trade in any EMA crossover strategy: earlier entry means more of the entries are wrong. Traders hunting EMA crossover stocks generally treat the crossing as a filter defining which names deserve examination rather than an instruction to buy. The most durable EMA crossover strategy uses the signal to build a list, not to time an entry.
Building an Exponential Moving Average Strategy That Holds Up
Moving averages are descriptive, and treating a descriptive tool as a predictive one is the most common way traders lose money with them. A workable exponential moving average strategy rests on three ideas, and any EMA trading strategy that ignores them tends to fail in the same predictable way.
- •Use the average as a filter, not a trigger. Requiring price above a rising fifty day discards a large share of unattractive candidates cheaply, which is the cheapest thing any exponential moving average strategy does. Deciding what to buy from that remaining population is a separate question, answered by structure, volume and fundamentals.
- •Trade toward the line, not away from it. The most durable EMA stock trading strategy in the growth tradition buys pullbacks to a rising average within an established trend, rather than buying strength that has already extended far from it. The line supplies both a reference for entry and a level from which a stop can be placed.
- •Expect it to fail in ranges. Moving averages work in trends and whipsaw in sideways markets. Anyone applying an EMA indicator for stock trading without allowing for that will be stopped out repeatedly through consolidation. Some traders bolt on a trend strength filter for this reason; others accept a stretch of poor signals as the price of catching trends when they do arrive. No EMA indicator for stock trading escapes this trade off.
How an Exponential Moving Average Stock Screener Works
The calculation is standard everywhere, so what separates one exponential moving average stock screener from another is the range of questions the field can be asked.
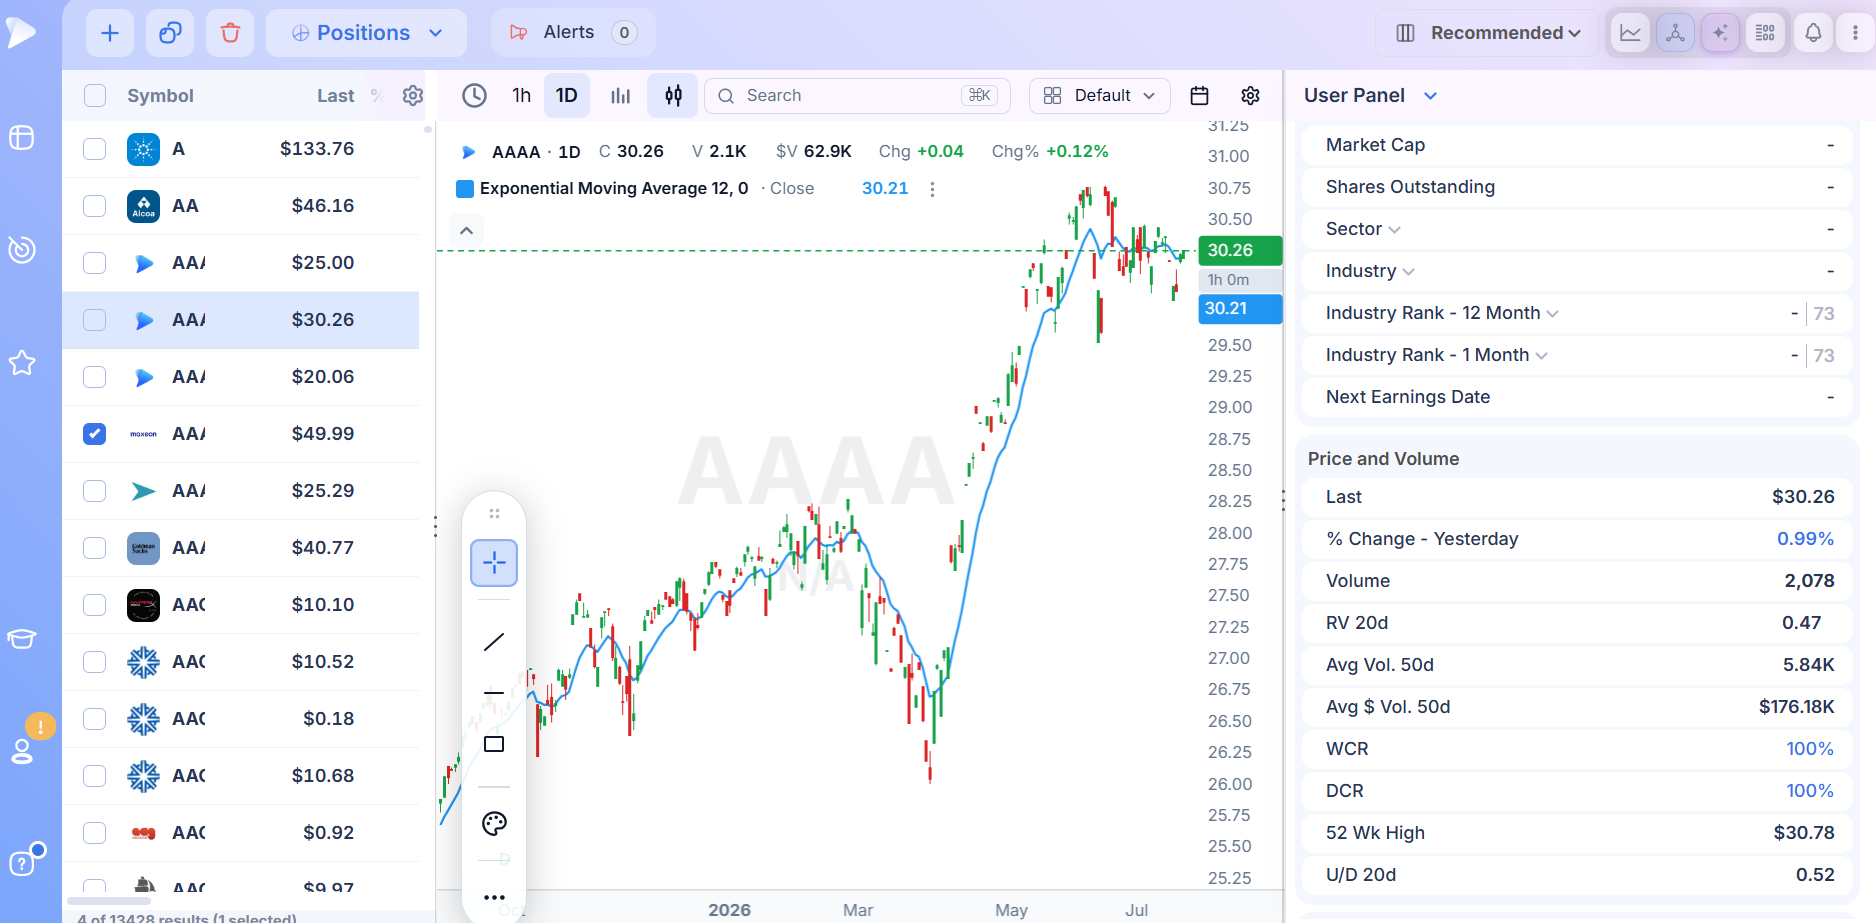
Position Against a Single Moving Average Indicator
The simplest and most used condition. Requiring price above a chosen line immediately halves the universe and removes almost everything in a downtrend. It is a crude filter, which is exactly why it belongs at the front of a screen rather than the end. As an EMA stock indicator this is the least sophisticated use available and still the most valuable one.
Alignment Across Several Averages
More useful than any single line is the relationship between several. Price above the twenty, the twenty above the fifty, the fifty above the two hundred, and the longest line rising describes a stock in a healthy trend at every timescale at once. Specifying that requires holding four conditions together, which is what grouped filter logic exists for.
Distance From the Line
Extension is where a moving average indicator becomes an entry tool rather than a trend filter. Screening for names within a small percentage of a rising average finds pullback candidates. Screening for names far above it finds stocks that have run too far to enter safely, equally useful if you already hold them. This is the condition that turns finding stocks above exponential moving average lines into an entry decision rather than a trend observation. Any EMA stock trading strategy built on pullbacks depends on this measure more than on the crossing itself.
Screening for EMA Crossover Stocks and Recent Reclaims
A stock that has just regained an average it lost is a different candidate from one that has held it throughout. Both are worth screening for and they suit different methods, the first favouring traders who buy turns and the second those who buy continuation. An EMA crossover strategy can be expressed either way depending on which population you want.
Then You Read the Chart
Conditions locate candidates; the chart decides. Whether the average has actually been respected on previous touches, whether the current pullback looks like normal digestion or the start of a breakdown, and whether volume behaved as price approached the line are all visual questions. Open a row alongside its chart, or render the output as tiled thumbnails and read the lot in one sitting.
Frequently Asked Questions
What EMA setting works best for stocks?
There is no universally good setting, only settings matched to a holding period. Traders holding positions for days tend toward shorter lines around ten or twenty periods. Those holding for weeks favour the fifty. Those assessing the longer regime use the two hundred. The twenty and fifty period lines are the most widely used among swing and growth traders because they suit a hold measured in weeks, which is where most of that community operates. Anyone asking what the best EMA for stocks is should answer the holding period question first.
Should I use 200 EMA or SMA?
Convention favours the simple moving average at that length, and there is a reasonable argument behind the convention. The two hundred period line exists to describe the longer regime, and stability matters more than responsiveness for that job. An exponential version at the same length reacts marginally faster, though the difference is slight at that lookback, while the simple version carries the advantage that a great many participants watch the identical line, which makes it likelier to be respected. This is one of the few cases where a best EMA indicator argument genuinely resolves in favour of the simple form.
Which is better, moving average or exponential moving average?
Neither, and the framing is slightly off since an exponential moving average is a type of moving average rather than an alternative to one. The real comparison is simple against exponential. The exponential version tracks price more closely and turns sooner, which suits shorter periods and shorter holding periods. The simple version is smoother and steadier, which suits longer periods. Most traders use the exponential form on short lines and the simple form on long ones.
Is the 5 EMA strategy profitable?
A five period line is extremely fast and produces a high volume of signals, the great majority of which are noise on anything longer than an intraday chart. An EMA indicator for day trading is set this short deliberately, because the holding period is measured in minutes. That is a different discipline with different risks and different tooling. For anyone holding across days, weeks or months, a five period average reacts to individual sessions rather than to trend, and an EMA indicator for swing trading needs to be considerably slower than that to be informative. The twenty and fifty period lines are where that community operates.
Do day traders use EMA or SMA?
Traders on an intraday horizon generally prefer the exponential form, since responsiveness matters more than smoothness when a position lasts hours. An EMA indicator for day trading is therefore set far shorter than anything used by someone holding overnight. The trade off reverses for swing and position traders: over a hold of weeks, that extra sensitivity mostly generates false signals rather than earlier entries. Screening exponential moving average stocks for a multi week hold is a different exercise, and it favours the twenty, fifty and two hundred period lines over anything faster.
What are the drawbacks of using EMA?
The responsiveness that makes it useful in trends makes it unreliable in ranges, where price crosses back and forth repeatedly and every crossing looks like a signal. It also lags by construction, being derived from prices that have already printed, so it cannot flag a turn at the moment the turn happens. And because it weights recent data heavily, a single sharp move can pull the line meaningfully, producing a change in reading that reflects one day rather than a change in trend.
Which EMA is most respected?
The fifty and two hundred period lines attract the most attention, largely because institutional participants and financial media both reference them constantly, which becomes self fulfilling as more traders place orders around the same levels. Among shorter settings the twenty and twenty one period lines are widely watched by swing traders, which is why 20-day EMA stocks attract attention disproportionate to the setting’s statistical merit. Respect here is a function of how many people are watching rather than any property of the calculation.
Why do traders use a 200 day moving average?
It functions as a regime filter. Its main value is not as an entry signal but as a way of deciding whether the environment supports being long at all, both for individual stocks and for indices. Many methodologies simply refuse to buy anything trading beneath it, and plenty of screens for 50-day EMA stocks add the longer line as a second requirement. It also serves as a widely watched support and resistance level, and it filters out the majority of short term noise, which makes it useful for framing the broader picture before any shorter timeframe decision gets made.
What is the golden cross, EMA or SMA?
The term is most commonly applied to the simple moving average, with a fifty period line crossing above a two hundred period line. That said, traders apply it to exponential versions as well, and the signal is often discussed without specifying which. The exponential version triggers slightly earlier, so an exponential moving average crossover of the same two periods will fire before its simple counterpart. In practice the distinction matters less than the widely noted limitation of the signal itself, which is that both averages are slow enough for the crossing to occur well after a trend change has already happened.