The Gap Stocks Screener Built for Traders Who Hold the Move
Hundreds of names gap every morning. Almost all of them are noise: thin issues jumping on nothing, index rebalances, currency moves in an ADR. A small number represent an actual change in what the market believes a company is worth, and those are the ones that keep going for weeks rather than filling by lunchtime.
Separating one from the other before 9:30 is the whole exercise, and it cannot be done by ranking the percentage movers. It needs the gap measured against volume, against the stock’s own volatility, against where it sits in its base, and against whether earnings just landed.
Deepvue’s screening engine exposes 1,152 fields for that purpose, holds 24 columns dedicated to extended hours activity, and updates 568 values continuously once trading begins. Charts, watchlists, alerts and a conversational terminal occupy the same screen as your results.
Why Deepvue Is the Best Stock Gap Screener
Almost every platform will show you a list ranked by overnight percentage change. That list is close to useless on its own, because the biggest movers are reliably the smallest and least liquid companies, and the gaps worth trading rarely top it.
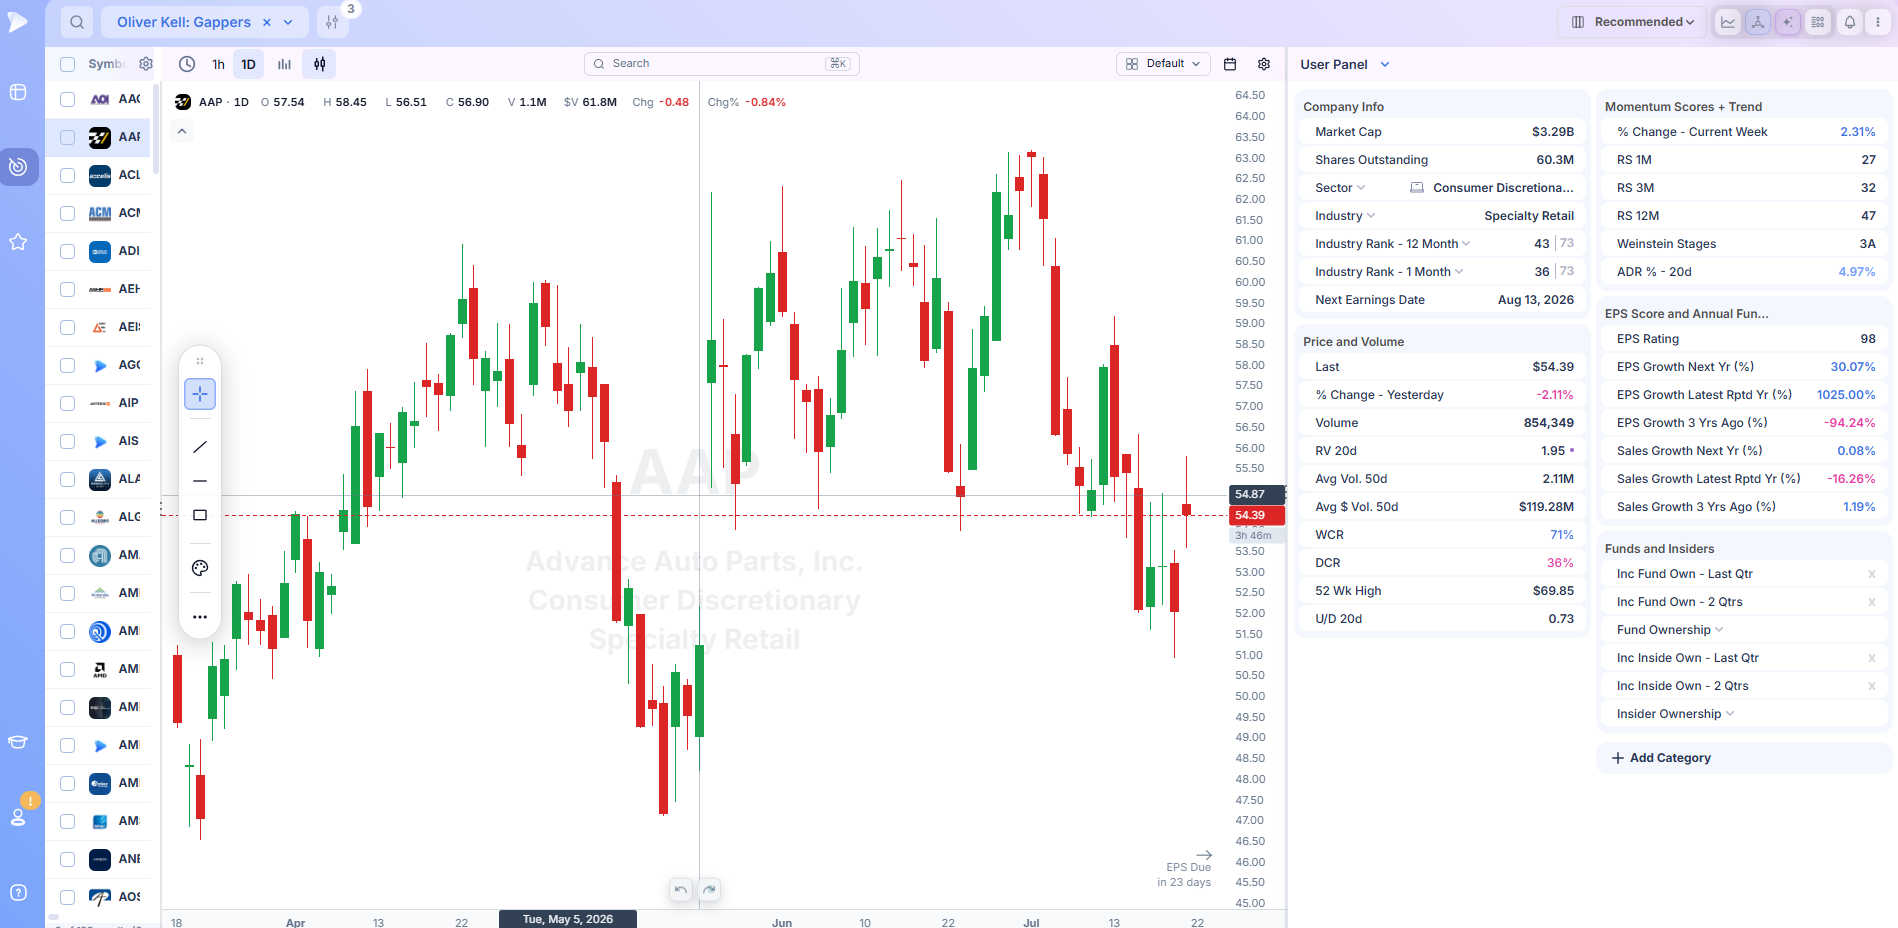
What distinguishes the best stock gap screener is context: the ability to ask not merely how far a stock jumped but whether the jump was backed by volume, whether it cleared something structurally significant, and whether the business behind it just changed.
The Preset Behind the Best Stock Gap Screener Workflow
Among the eighty screens contributed by working professionals is Oliver Kell – Gappers, which the platform describes as volatility expansion off gaps with rising relative strength. Those last four words are what make it useful. A gap in a name whose relative strength line is already climbing is a continuation event; the identical gap in a laggard is usually a one day repricing that goes nowhere.
High Volume Edge sits alongside it under the Momentum heading, isolating unusual volume movers filtered for quality, which catches gaps whose significance shows up in turnover rather than in the size of the jump itself.
Neither is a finished product. Run one, study what it returns, then hang your own thresholds off it and save the assembly under a name of your choosing.
Pre and Post Market Columns Before the Bell
A gap is knowable before it prints. The 24 extended hours fields cover price action outside regular trading, which is where a gap forms and where its early character reveals itself. A stock indicated up eight percent at 6am on almost no volume is a different proposition from one up eight percent that has already traded heavily by 8:30, and only the second has anything you can act on.
That window is also where a gap stocks screener earns most of its value, because the list you build at 8:45 determines what you are prepared to do at 9:31.
Measuring the Gap Against the Stock, Not the Market
Three percent is enormous for a utility and unremarkable for a recent listing that moves five percent on a quiet day. Ranking every name on the same percentage scale therefore buries the meaningful moves beneath the volatile ones.
Normalising is what the Price and Volume category is for, and it holds 145 fields. Relative volume compares today’s turnover against the name’s own baseline rather than against the market’s. Average true range expresses the gap as a multiple of what the stock ordinarily does. Dollar volume filters out the low priced issues that dominate raw percentage rankings. Together these turn a stock gap screener from a leaderboard into an instrument.
Earnings Fields for the Gaps That Persist
The most durable gaps follow a surprise, which is why the 227 earnings fields matter as much here as any technical measure. Reporting date, timing within the session, surprise magnitude against estimates and the growth trend leading in are all available as conditions. Sales adds 126 more, which is where you check whether the top line moved or only the bottom line did.
This is the difference between a gap that fades and an episodic pivot that runs for months. A stock gapping on a genuine acceleration in the business has a reason to keep going. One gapping on a headline does not.
A Gap Up and Gap Down Stocks Screener Needs Both Directions
Screening for a gap up and screening for a gap down are opposite instructions, so a gap up and gap down stocks screener has to describe each separately rather than collapsing both into a single absolute value. Deepvue’s builder handles that with named condition groups linked by ANY or ALL logic. One group carries your upside criteria, another your downside criteria, and the operator between them decides whether you want both populations in one output or only one.
Conditions arrive in four shapes: a number between two bounds, a pick from a list, a text match, or a box you tick. Formula syntax appears nowhere. Name a working set, file it in a folder, and it is there waiting at 8am tomorrow. Presets can also be laid over rules you wrote yourself whenever an extra strategy is worth adding.
Live Values Once the Session Opens
The first thirty minutes decide most gaps. Whether a stock holds its opening range or immediately surrenders it is information that exists only in real time, and a screen built on delayed prices will tell you about it afterwards. Deepvue streams 568 fields over a persistent connection during market hours, flagging each value as it changes, on a table that stays responsive at a thousand rows.
Turning a Morning List Into Positions
The gap list is a starting point, not an answer. Select the rows worth keeping and send them to a watchlist in one move. Open any name beside its chart to see what the gap did to the base. Set alerts at the levels that would confirm or invalidate the setup and let the alerts panel do the watching, which matters because plenty of gaps are worth trading on day four rather than day one.
Who This Screener Suits
- ✓Growth traders who buy earnings gaps and episodic pivots and hold them for weeks or months
- ✓Swing and position traders who need a pre market list built before the open
- ✓Anyone tracking gap downs in owned positions as much as gap ups in candidates
- ✓Traders who want the gap qualified by volume and earnings rather than ranked by percentage
- ✓Traders leaving legacy tools that lack usable extended hours coverage
Pricing
One plan, $49 monthly. That price buys the entire 1,152 field library, all 24 extended hours columns included, every preset in the collection, the visual builder, unmetered terminal access, and the charting, watchlist and alerting tools that sit around the screener. None of it is held back for a higher tier.
MarketSurge lists at $149 monthly.
What Is a Gap in Trading?
A gap is a discontinuity on the chart. It occurs when a session opens at a price meaningfully away from the previous close, leaving a range where no trading took place. On a candlestick chart it appears as visible empty space between one bar and the next.
Gaps form because the market closes but information does not stop arriving. Earnings land after the bell, regulators rule overnight, an acquisition is announced before dawn. Orders accumulate through those hours with no continuous auction to absorb them, so when trading resumes the price adjusts in one step rather than through a series of trades.
The size of the step is a rough measure of how much the market’s opinion changed while it was closed.
The Four Types of Gap
Traders separate gaps by where they occur in a trend, since the same visual feature carries very different implications depending on context.
Common gaps
Small discontinuities inside a range, usually with no catalyst behind them. They fill quickly and carry almost no predictive information. The majority of gaps on any given morning are these.
Breakaway gaps
These occur as price exits a consolidation, frequently on heavy volume and often on news. They mark the start of a move rather than a pause in one, and they tend not to fill. For growth traders this is the important category, since a breakaway gap out of a well formed base is one of the highest quality entries available.
Runaway gaps
Also called continuation gaps, these appear midway through an established trend as buyers chase an already moving stock. They confirm the trend but arrive with less margin for error than a breakaway, since price has already travelled.
Exhaustion gaps
These form near the end of an extended move, often on very heavy volume, and represent the last buyers arriving. They typically fill quickly and frequently precede a reversal. Distinguishing one from a runaway gap in real time is difficult and usually only possible after the fact.
Gap Fills and Why They Happen
A gap fills when price later trades back through the empty range, returning to the prior session’s close. The tendency is real but frequently overstated. Common gaps fill most of the time. Breakaway gaps backed by volume and a genuine catalyst often never do.
The mechanism is straightforward. When a gap forms on thin overnight volume, the opening price has not been validated by much actual trading. Sellers who were absent overnight arrive during the session, find buyers unwilling to pay the new level, and price works back down through the vacuum where no support was ever established. When a gap forms on heavy volume instead, that validation happens immediately. Positions are established at the new price, and the level becomes support rather than a vacuum.
This is why volume matters more than gap size for judging durability, and why any serious approach to the pattern requires the two measured together.
Why a Gap Up and Gap Down Stocks Screener Treats Them Differently
The two behave differently, and treating direction as a simple sign flip loses most of what makes each one tradeable.
Gap ups on good news attract buyers who missed the move and short sellers forced to cover, both of which supply demand into the open. That combination frequently produces continuation. But gap ups also arrive after extended advances, where they mark exhaustion instead.
Gap downs draw a different crowd. Sellers who cannot exit overnight sell into the open, while bargain hunters step in expecting an overreaction. The result is often more volatile and less directional than a gap up of comparable size. For anyone holding the stock, a gap down through a stop level is the situation the pattern is genuinely useful for anticipating, since it is the mechanism by which stop losses fail to work as intended.
How a Gap Stocks Screener Works
The gap itself is trivial to compute: today’s open against yesterday’s close. That single condition is available on almost any tool, which is precisely why it is not where the value lies. Two hundred names satisfy it every morning. A gap stocks screener is useful only to the extent that it qualifies those two hundred down to the handful worth attention.
Four groups of conditions do that work.
Sizing the Gap Relative to Normal Behaviour
The first cut is dimensional. Express the gap against the stock’s average true range rather than as a raw percentage and the comparison becomes fair across the universe. Add price and dollar volume minimums to remove the low priced names that otherwise fill the list. This is the step most screeners skip, and it is why their output is dominated by companies nobody would trade.
Requiring Volume to Validate It
A gap without turnover behind it is an opinion held by very few people. Relative volume, measured against the name’s own average rather than the market’s, is the number that decides this, and it sits among the turnover and range derivatives in the 145 field Price and Volume group. Extended hours volume from the 24 pre and post market columns tells you the same thing earlier, which is the difference between a list ready at 8:45 and one assembled after the fact.
Placing the Gap Within the Chart
Context determines type. A gap from the top of a tight consolidation is a breakaway; the same gap from a stock already extended well above its moving averages is more likely exhaustion. Position against moving averages, distance from the yearly high and relative strength readings all locate it, and the Technicals category runs to 276 fields covering exactly those measures.
Checking Whether Anything Actually Changed
The best stock gap screener separates the repricing from the noise, and that requires fundamental fields alongside the technical ones. Earnings contribute 227 fields spanning report timing, surprise magnitude, estimates and growth history. Sales adds 126 more. Institutions and insiders account for another 84, which is where sponsorship change shows up in the weeks after a significant gap.
Then You Read the Chart
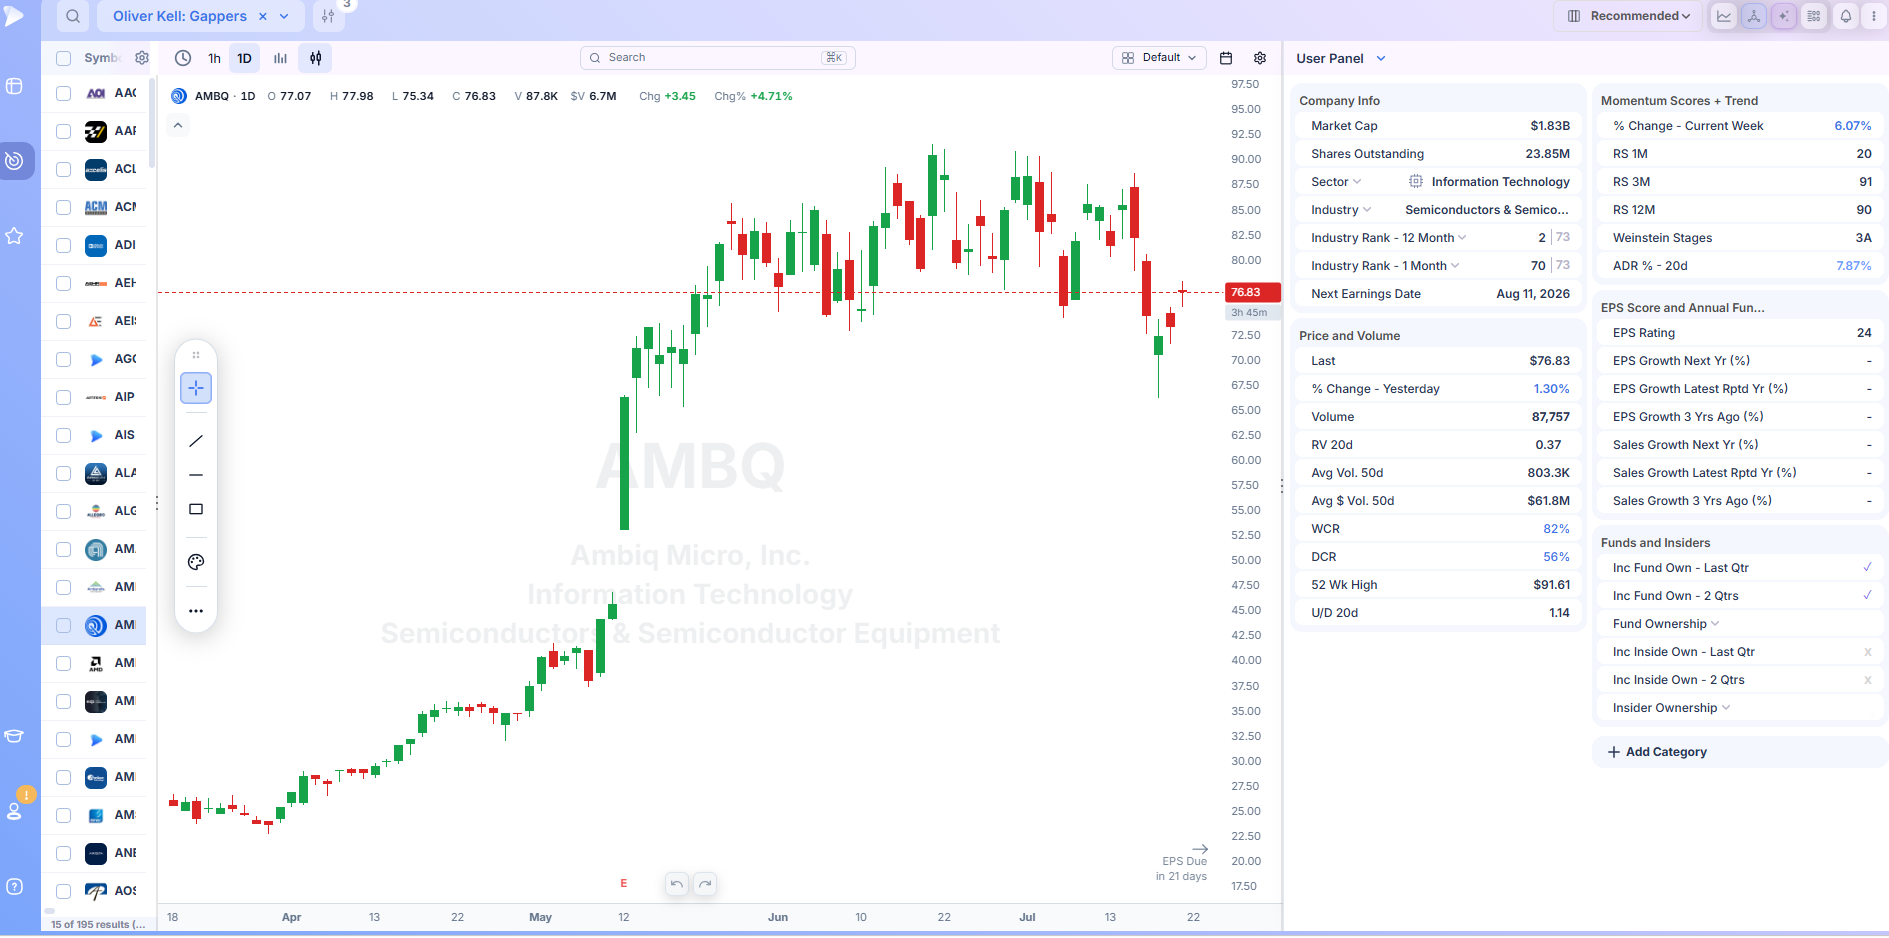
Screening produces candidates, never conclusions. Whether the gap cleared a real level, whether the base beneath it was properly formed, whether the opening range held and how the stock behaved in the sessions immediately after are all read visually. Pull any row up next to its chart, or tile the whole list as miniatures and assess the morning’s crop in a single pass rather than opening names one at a time.
Frequently Asked Questions
What does gap mean in trading?
A gap is empty space on a price chart, created when a session opens away from where the previous one closed so that no trading occurred in between. It reflects information arriving while the market was shut, most often an earnings report, a corporate announcement or a macroeconomic release. Gaps are described as up or down according to direction, and classified further by where they sit within a trend.
Is gap trading illegal?
No. Trading stocks that gap is entirely legal and extremely common, and gap driven entries are a standard part of many established methodologies. What is illegal is trading on material non public information, which has nothing to do with gaps as such but occasionally gets conflated with them because gaps are frequently caused by news. Reacting to a gap after it becomes public is ordinary trading. Positioning ahead of an announcement you learned about improperly is insider dealing, regardless of what the chart subsequently does.
Is a gap up bullish or bearish?
Usually bullish, but not reliably so, and the qualifier matters more than the answer. A gap up from a sound base on heavy volume with a real catalyst behind it is among the more constructive events on a chart. A gap up after an extended run, on light volume, that surrenders its opening range within the first hour is often the opposite, marking the arrival of the last buyers. Direction alone tells you very little; where the gap sits in the trend and what volume accompanied it tell you most of it.
What is an example of a gap in trading?
Consider a stock that closes a session at $50 having spent six weeks trading quietly between $47 and $51. It reports after the close, beating estimates substantially and raising guidance. It opens the next morning at $58, sixteen percent above the prior close, with no trades occurring between $51 and $58. That empty band is the gap. Because it exits a tight consolidation on a genuine catalyst, and because turnover on the opening day runs many times its normal level, it would be classified as a breakaway gap, the type least likely to fill and most likely to lead somewhere.