
Last Updated:
November 19, 2025
Why Stocks Breaking Out Are the Foundation of Growth Stock Trading
Stocks breaking out signal the beginning of powerful price movements. When a stock breaks through resistance levels with conviction, it demonstrates that demand has overwhelmed supply and institutional money is accumulating shares.
The strongest stock advances begin with properly identified stocks breaking out backed by strong fundamentals, technical setups, and volume confirmation.
What Makes a Valid Breakout:
- Stock moves above a key resistance level or consolidation area
- Volume surges 50% or more above the average daily volume
- Price closes in the upper portion of the daily range (Daily Closing Range above 50%)
- Stock demonstrates relative strength versus the overall market
- Fundamentals support the price action with strong earnings and sales growth
The most successful traders don’t chase stocks breaking out after they’ve already made big moves. Instead, they use systematic screening to identify stocks breaking out early when risk is manageable and reward potential is maximized.
Understanding different types of stocks breaking out and how to screen for them gives you a significant edge in catching market leaders before they make explosive moves.
💡 Pro Tip: Over 80% of the biggest stock market winners are stocks breaking out to new highs before making major price advances. Waiting for pullbacks often means missing the entire move.
Strategy #1: Green Line Breakouts (All-Time High Breakouts)
A Green Line Breakout (GLB) occurs when a stock closes at a new all-time high, breaking through a horizontal resistance level drawn from a previous high. This traditional pattern signals that a stock has overcome all previous supply and is entering uncharted territory where there are no overhead sellers waiting to exit positions.
Price Action – New All-Time High Requirement:
Screen for stocks breaking out by making new 52-week highs or all-time highs on both daily and weekly timeframes. Weekly closes at new highs carry more significance than intraday highs, as they demonstrate sustained buying pressure rather than temporary spikes.
Colume Confirmation – Institutional Buying Evidence:
Volume must surge significantly on the breakout day to validate institutional participation. Without strong volume, breakouts often fail as they lack the buying power needed to sustain the move higher.
Daily Closing Range Strength:
The Daily Closing Range (DCR) measures where the stock closed within its daily high-low range. A DCR above 70% indicates the stock closed near its highs, demonstrating buying pressure throughout the day rather than early morning strength that faded.
Fundamental Support – Earnings and Sales Growth:
Green Line Breakouts work best when backed by strong fundamental growth. The most powerful breakouts come from stocks showing accelerating earnings and sales, not just technical patterns.
💡 Pro Tip: Combine the Green Line Breakout screen with relative strength analysis. Look for stocks breaking out to new highs while the overall market is consolidating or even declining. These stocks show exceptional strength and often become the biggest winners when the market resumes its uptrend.
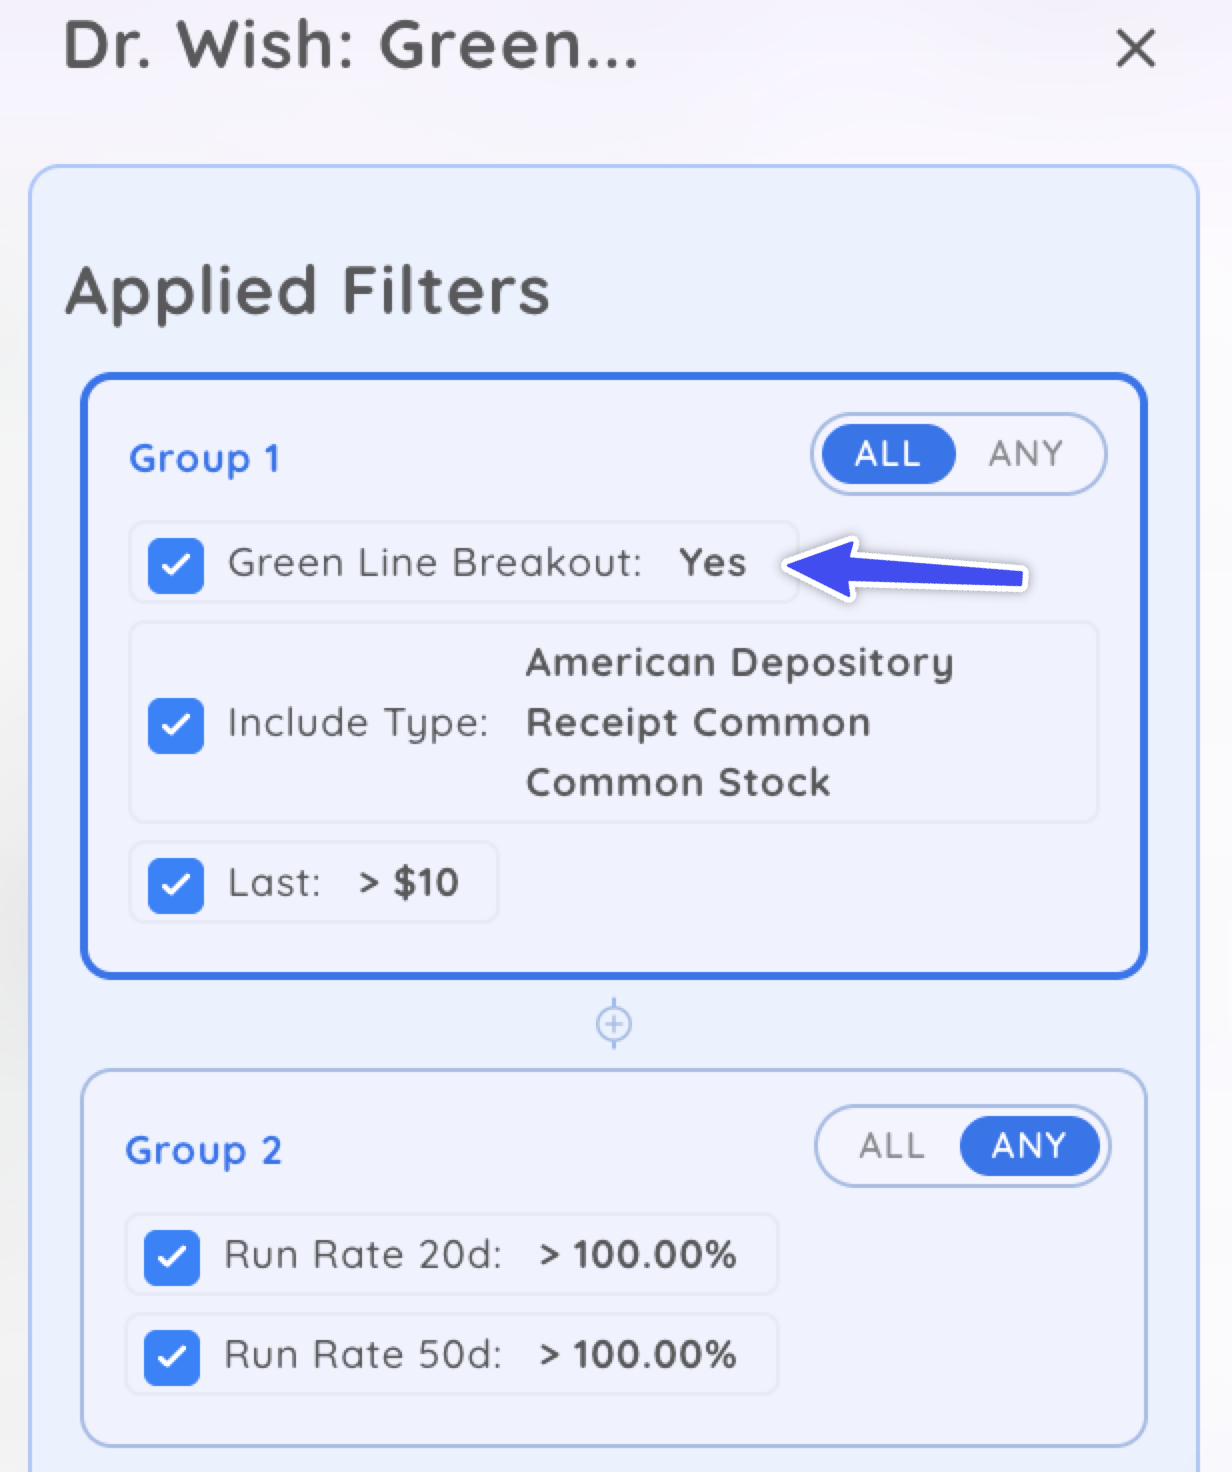
Recommended Screening Criteria:
- 52-Week High: Equal to Current Price (or within 1%)
- All-Time High: Equal to Current Price (for true GLB)
- Price: Above $12.50 (to filter out low-priced stocks)
- Volume vs. Average: Greater than 150% of 50-day average volume
- Dollar Volume: Above $20 million daily (ensures liquidity)
- Volume Trend: Increasing over the past 5-10 days
- Daily Closing Range: Greater than 70% (stock closes in the upper 30% of the daily range)
- Multiple days closing in the upper range shows sustained demand
To make things easier Deepvue has partnered with top traders and other market influencers to create preset screens. This Green Line Breakout screener is what Eric Wish uses to teach trading at new all-time highs.
Strategy #2: Consolidation Pivot Breakouts
Consolidation pivot trading identifies early entry opportunities in market leaders before they make traditional breakouts to new highs. These setups occur when a stock makes an initial move higher, then pauses to digest those gains through tight, low-volume trading near key moving averages.
A consolidation pivot occurs after a stock has already made a significant move of 15-25% from the bottom of its base. Instead of continuing straight up or pulling back deeply, the stock pauses and consolidates sideways in a tight range above key moving averages.
This provides the last low-risk entry opportunity before a stock’s major advance.
Prior Strength – Recent Price Advance Requirement:
The stock must have already proven itself with a significant advance before the consolidation. Look for stocks that have rallied 15-25% or more from a prior base and are now pausing to build energy for the next move.
Moving Average Position – Above Key Support Levels
The consolidation must occur above critical moving averages. Stocks consolidating above their 10-day and 21-day moving averages show institutional support, while those breaking below these levels indicate weakening momentum.
Tight Action – Multiple Tight Days Pattern
Look for 1-2 consecutive days of tight trading action where the stock builds a small, controlled base. This tight consolidation demonstrates that selling pressure has dried up and the stock is ready to move higher.
Volume Contraction – Drying Up Selling Pressure
Volume should contract during the consolidation phase, indicating minimal selling interest. When volume expands on any upward movement from the pivot, it confirms buying interest is returning and validates the setup.
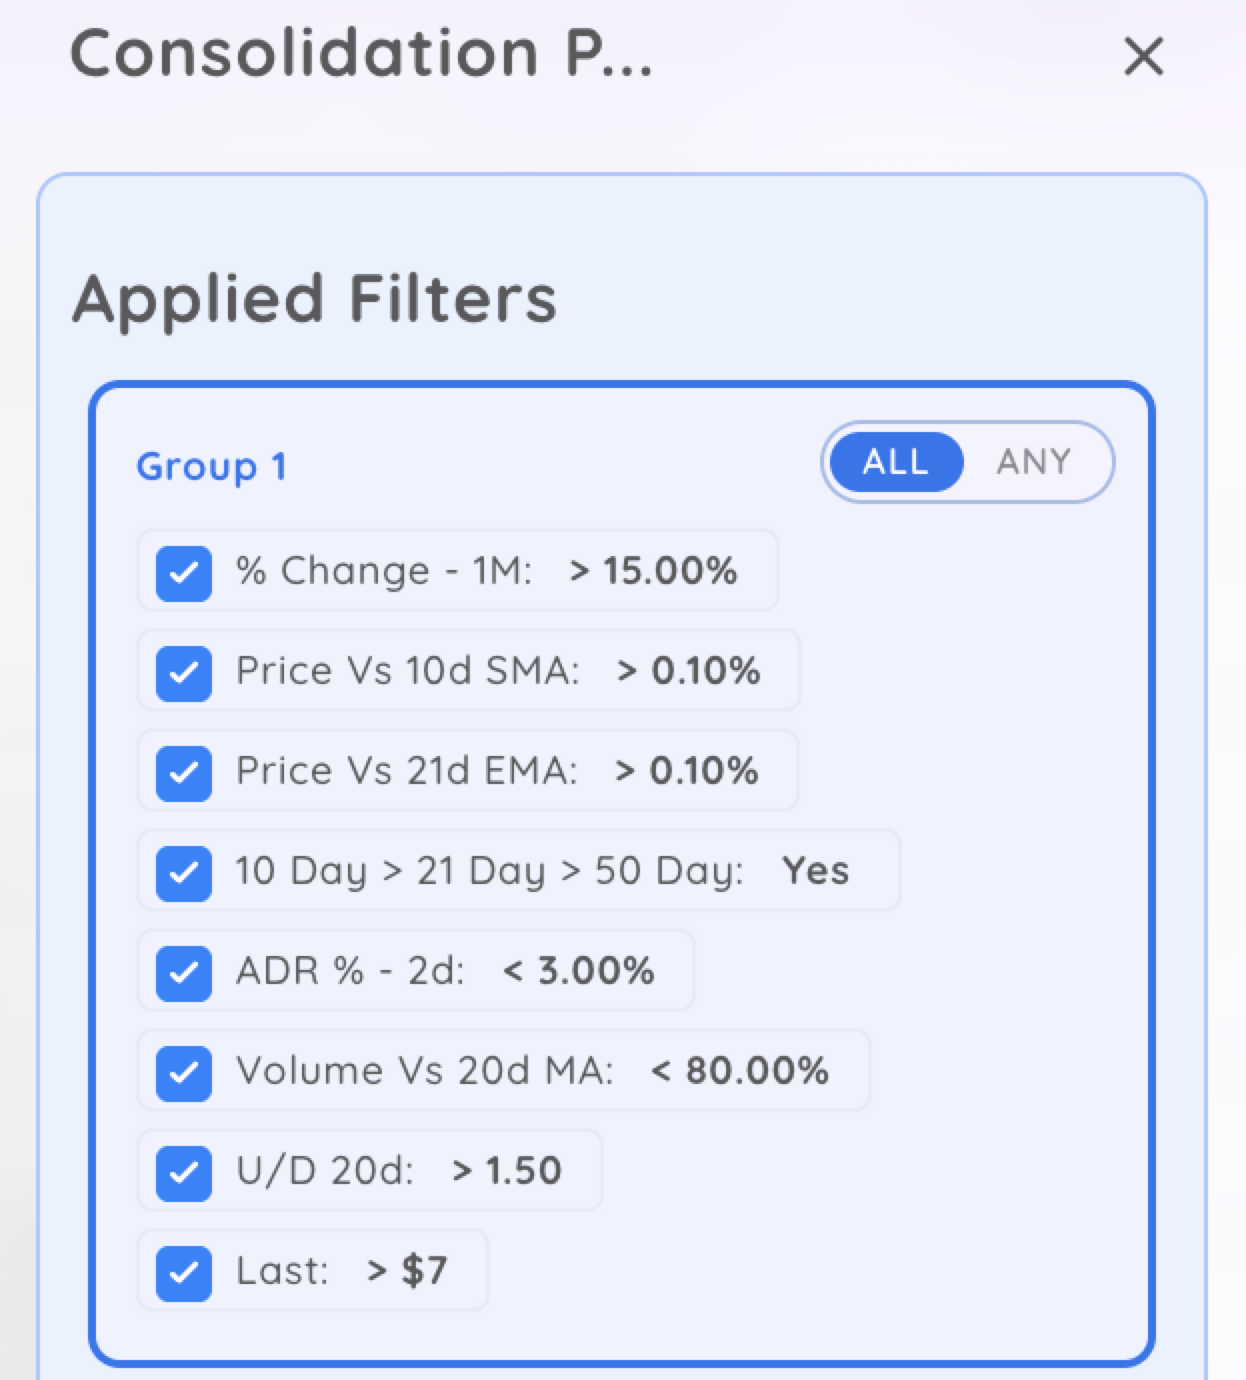
Recommended Screening Criteria:
- 4-Week Performance: Greater than 15%
- OR 8-Week Performance: Greater than 25%
- Stock is currently within 15% of its recent high
- Price vs. 10-Day EMA: Greater than 0% (price above 10-day)
- Price vs. 21-Day EMA: Greater than 0% (price above 21-day)
- 10-Day EMA vs. 21-Day EMA: 10-day above 21-day (proper MA alignment)
- 21-Day EMA Trend: Rising (calculated over 5-day period)
- Average Daily Range (5-day): Less than 3% (tight consolidation)
- Daily Range Today: Less than 2% (today shows tightness)
- Volatility: Contracting compared to 20-day average
- Volume (5-day average): Less than 80% of 50-day average
- Today’s volume in the first half of the day: Below average (for real-time screening)
- No heavy volume selling days during the consolidation period
💡 Pro Tip: The ideal entry occurs when the stock stops declining intraday and begins to turn higher, creating what’s known as an intraday U-turn pattern. Watch for the stock to find support at a moving average or recent consolidation low, then enter as it begins moving up with increasing momentum. Set your stop loss just below the intraday low or the key moving average support level.
Strategy #3: Traditional Basing Pattern Breakouts
Traditional base patterns represent longer-term consolidations lasting 7 weeks to several months, where stocks breaking out build the foundation for major advances.. These patterns include cup and handle formations, flat bases, ascending triangles, and double bottoms.
Understanding how to screen for these patterns positions you to catch stocks breaking out at their earliest stages.
Most Reliable Pattern – Cup and Handle Formation:
The cup and handle pattern has demonstrated an approximately 95% success rate (in ideal market conditions) when properly identified and entered at the correct pivot point. The pattern forms when a stock rallies at least 30%, pulls back 20-30% to create a rounded cup shape, then forms a shorter handle with a modest pullback before breaking out to new highs.
Flat Base – Tight Consolidation Pattern:
A flat base forms when a stock consolidates sideways in a tight range, typically 10-15% or less, after a prior advance. This pattern shows exceptional strength as the stock refuses to pull back significantly.
Ascending Triangle – Rising Support Pattern:
Ascending triangles form with a flat top resistance line and rising support line, showing increasing buying pressure. Breakouts from this pattern tend to be explosive.
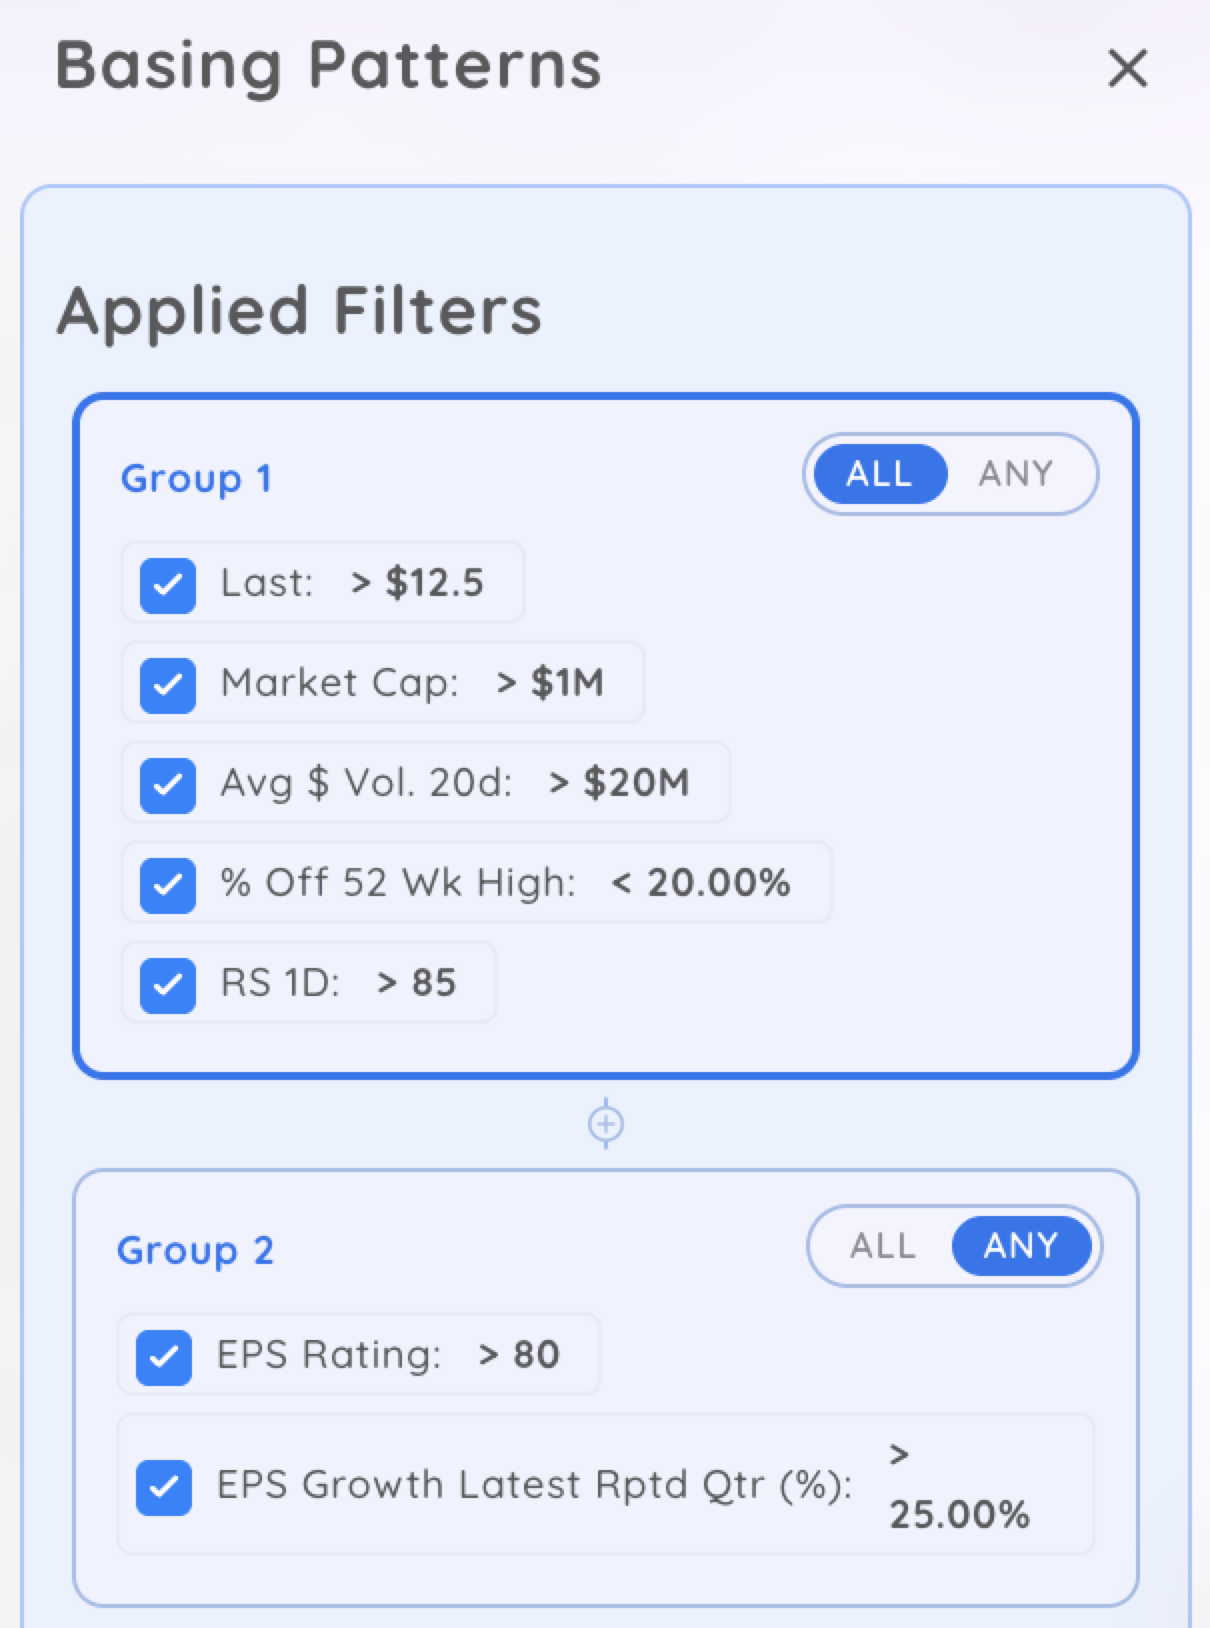
Recommended Screening Criteria:
- Price: Greater than $12.50
- Market Cap: Greater than $1 billion
- Average Dollar Volume: Greater than $20 million
- 4-Week % Change: Greater than 15%
- Distance from 52-Week High: Less than 15%
- Relative Strength Rating: Greater than 85
- Price vs. 10-Day EMA: Greater than 0%
- Price vs. 21-Day EMA: Greater than 0%
- Average Daily Range (5-day): Less than 3%
- Volume (5-day average): Less than 80% of 50-day average
- EPS Rating: Greater than 80
- OR Last Quarter EPS Growth: Greater than 25%
- OR Absolute Strength Rating: Greater than 90
💡 Pro Tip: After your screen identifies potential base patterns, always confirm the pattern visually on a chart. Look for proper depth, duration, and volume characteristics. The best bases show volume declining during the consolidation and surging on the breakout with at least 50% increase above average.
Strategy #4: High Volume Institutional Breakouts
Institutions leave their “footprint” on charts through massive volume spikes. When you see huge volume accompanied by strong price action, it signals that large money managers are accumulating positions and stocks breaking out.
Screening for these volume signatures helps you identify stocks attracting institutional interest before they make major moves.
Volume Analysis – What Constitutes Institutional Buying:
Institutional volume shows specific characteristics that distinguish it from retail activity. Look for volume that exceeds average by 100-300% or more, occurring on days when the price closes near its highs. This combination indicates accumulation rather than distribution.
Pocket Pivot Pattern – Identifying Early Accumulation:
One of the strongest institutional buying signals, a pocket pivot occurs when a stock has a strong up day with volume that exceeds the volume of all down days in the previous 10 trading days. This demonstrates that buying demand on one up day exceeded all the selling pressure from multiple down days.
Pocket pivots often appear at the bottom of bases or during consolidations, signaling early institutional buying before traditional breakouts. They provide lower-risk entry opportunities with manageable stops.
Highest Volume Edge:
The Highest Volume Edge is a proprietary stock screening criterion used to identify stocks with unusually high trading volume, which often signals significant institutional interest or a potential breakout. This screener focuses on four key volume conditions to help traders spot potential market leaders:
- Highest Daily Volume Ever: Identifies stocks experiencing the single largest trading volume day in their entire history, indicating a major shift in interest.
- Highest Daily Volume Since IPO: Highlights stocks gaining significant traction for the first time following their Initial Public Offering.
- Highest Daily Volume in a Year: Points to stocks experiencing their most significant trading volume in the past 12 months, a sign of recent, strong attention.
- Highest Daily Volume Since Last Earnings: Captures stocks that are reacting strongly to recent earnings reports, often driven by positive news or surprises.
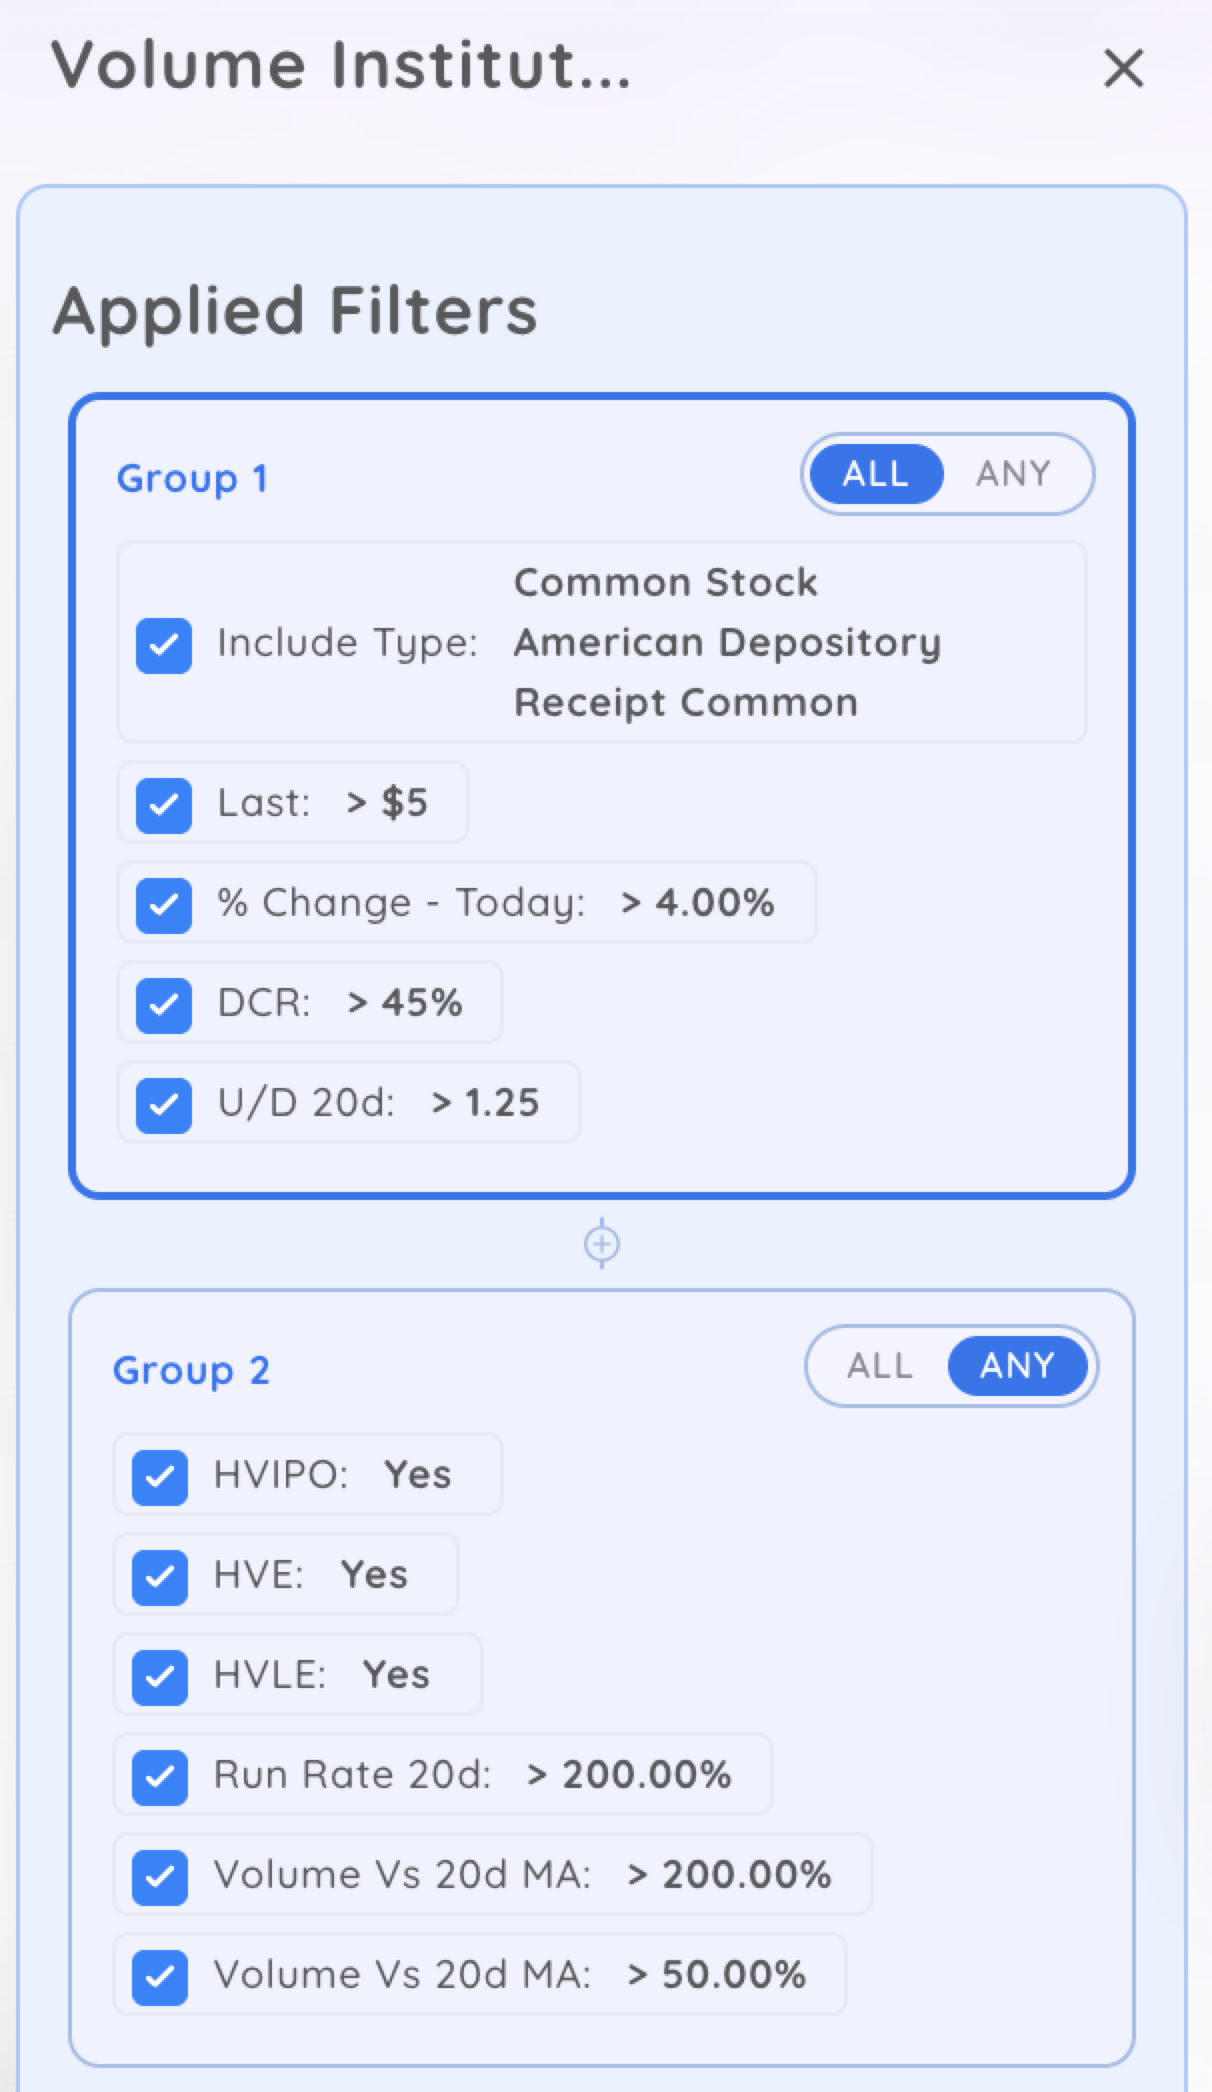
Recommended Screening Criteria:
- Volume surge of 100%+ above 50-day average
- Price closes in the upper 70% of the daily range
- Multiple days of above-average volume in the recent week
- Volume expansion on up days, contraction on down days
- Today’s volume: Greater than the highest volume down day in the past 10 days (pocket Pivot)
- Daily Closing Range: Greater than 60%
💡 Pro Tip: Context matters when analyzing volume. A 200% volume spike on a stock gapping down is distribution, not accumulation. Always confirm that high volume accompanies positive price action with the stock closing near its highs. The combination of increasing volume on up days and decreasing volume on down days is the hallmark of institutional accumulation.
Essential Universal Screening Criteria for All Stocks Breaking Out
Regardless of which specific breakout pattern you’re screening for, certain fundamental criteria should be included in every scan. These filters ensure you’re focusing on high-quality stocks breaking out with the characteristics needed for sustained moves.
Minimum Liquidity Requirements:
These basic filters eliminate stocks that lack sufficient liquidity for clean entries and exits. Without adequate liquidity, even perfect technical setups become difficult to trade profitably.
- Price: Greater than $12.50 (avoids overly low-priced stocks)
- Market Cap: Greater than $500 million minimum, $1 billion preferred
- Average Dollar Volume: Greater than $20 million (ensures institutional participation)
- Average Daily Range: Greater than 3% (provides sufficient movement for profits)
Outperformance Indicators:
True leaders outperform the overall market. Use relative strength ratings and comparisons to ensure you’re focusing on stocks breaking out that show superior price performance.
- Relative Strength Rating: Greater than 85 (top 15% of all stocks)
- Relative Strength Line: Making new highs or near new highs
- Outperforming the market in the past 1, 3, and 6 months
- Industry Group Rank: Top 40% of all industry groups
Fundamental Growth Criteria:
The biggest winners combine strong technicals with exceptional fundamentals. Include earnings and sales growth filters to ensure stocks breaking out have the fundamental power to sustain their advances.
- Last Quarter EPS Growth: Greater than 25% year-over-year
- Last Quarter Sales Growth: Greater than 20% year-over-year
- Earnings Acceleration: Current quarter growth exceeding the previous quarter
- Annual EPS Growth: Greater than 25% over 3 years
- EPS Rating: Greater than 80
- Positive earnings in the last 4 quarters (no losses)
Institutional Sponsorship:
Stocks need institutional buying power to make major moves. Screen for evidence that professional money managers are accumulating shares of stocks breaking out.
- Institutional Ownership: Between 15% and 75% (sweet spot)
- Number of Institutional Owners: Increasing quarter-over-quarter
- Accumulation Rating: Showing net institutional buying
- Ownership by top-performing funds: At least 3-5 quality institutions
Market Environment Considerations:
Even the best stocks breaking out with perfect fundamentals and technical setups will struggle during market corrections. Approximately 75% of stocks follow the general market direction.
Only run breakout screens and take positions when major indices like the S&P 500 and NASDAQ are in confirmed uptrends. During market corrections, focus on building watchlists rather than taking new positions.
- S&P 500 is above its 50-day moving average
- NASDAQ is above its 21-day exponential moving average
- Market showing higher highs and higher lows
- Distribution day count low (fewer than 5 in the past 25 days)
Essential Takeaways: Mastering Screening for Stocks Breaking Out
Green Line Breakouts to all-time highs provide the most reliable signals when accompanied by 50%+ volume increase, strong closing range above 70%, and solid fundamentals with 25%+ earnings growth
Consolidation pivot stocks breaking out offer early entry opportunities with 2–5% risk by identifying stocks consolidating 1–2 days above 10-day and 21-day moving averages after 15–25% prior advances
Traditional base patterns like cup and handle require 7+ weeks of consolidation with declining volume, then explosive stocks breaking out on volume surges of 50%+ above average
Pocket pivots and high-volume institutional buying days signal early accumulation when volume on one up day exceeds all down days in the previous 10 trading sessions, which is often a prelude to stocks breaking out
Moving average alignment screens identify stocks breaking out in proper uptrends with price above 10-day, 10-day above 21-day, 21-day above 50-day, and 50-day above rising 200-day moving average
Universal filters must include minimum liquidity requirements of $12.50 price, $1B market cap, $20M average dollar volume, plus a relative strength rating above 85 for all stocks breaking out
Combine fundamental criteria requiring 25%+ quarterly EPS and sales growth with technical breakout signals to identify stocks breaking out with both the power and momentum to sustain major advances
Only run breakout screens and take positions during confirmed market uptrends when major indices are above key moving averages. Remember: 75% of stocks breaking out follow the overall market direction
Use “ANY” groups in your screens to capture multiple stocks breaking out types simultaneously while maintaining tight “ALL” groups for quality filters and risk management criteria
Always confirm screen results visually on charts to validate pattern structure, volume behavior, and proper entry points before taking positions in stocks breaking out


