Why screening on down days reveals strong stocks
When the market takes a hit, most stocks follow the trend and drop too, but some do the opposite – they go up or hold steady. These are clues quietly revealing strong stocks, and they’re the early signs of the next market leaders.
When a stock rises, or even stays flat, while the market’s falling, it’s showing relative strength, meaning its performance is stronger relative to the general market. Think of it like a strong swimmer moving upstream while everyone else is getting pulled downstream.
Usually, this means there aren’t many people trying to sell it, and that’s a sign of strength worth noticing.
Most people look for strong stocks when the market’s already doing well, but that can be misleading. Everything looks good in a bull run – The real test is during a market dip.
On those red days, the strong stocks are the ones that don’t fall, and they might even gain. That’s why screening during down days can help you spot the winners early before the crowd catches on.
What is relative strength in stocks?
Relative strength (RS) is a key tool traders and investors use to figure out how a stock is doing compared to the overall market or a specific index like the S&P 500. It helps answer one simple question: Is this stock doing better or worse than everything else right now?
If a stock is outperforming the market, either going up more when things are good, or going down less when things are bad, that’s a sign of strong relative strength. On the flip side, if a stock lags behind or drops harder than the market, it’s showing weak relative strength.
Strong Relative Strength: If a stock or sector shows strong relative strength, it is outperforming the market.
- If the market rises by 10% and a stock rises by 20%, that stock has strong relative strength.
- If the market declines by 10% and a stock only declines by 5%, that stock is also showing good relative strength because it is falling less than the market.
How relative strength identifies strong stocks
When you’re trading individual stocks, spotting momentum early is key. Stocks with strong relative strength often become leaders, especially during corrections or weak market days.
Relative strength is one of the most powerful tools in a trader’s toolkit. It helps you stay aligned with the market’s real momentum and focus on where the money is flowing.
During market pullbacks, institutional investors become more selective and hold onto their best ideas. They tend to add to their highest-conviction names, and those stocks often show subtle signs of strength.
Stock up when the
market is down
Higher lows while the market makes lower lows
New high while the market makes a lower high
Strong daily close when the market finishes low
Outperforming peers in the same sector
Tight inside day while the market breaks down
Relative strength helps you detect that quiet accumulation. It gives you an edge by highlighting the stocks institutions are betting on before they move big.
By focusing on relative strength, you can avoid weak setups, stay in sync with market leaders, and boost your chances of finding superperformance stocks.
Find strong stocks on down days
When a stock closes higher while the overall market or its peers are down, it indicates that there is strong buying interest that outweighs general selling pressure. This is often a clue that institutions are actively accumulating shares, which sets the stage for future price advances.
One of the simplest and most powerful screeners you can run is for stocks that are green on red days. If a stock is climbing while the indexes are dropping, it’s likely under quiet accumulation.
Stocks that resist market declines are often the first to rebound when market conditions improve. Stocks that end the day with gains on days when the overall market is declining is an indicator that these stocks are poised to become market leaders.

Stocks that stay strong on down days show resilience and demand, even in choppy or corrective markets. Once the market finds its footing, these names usually recover faster and outperform.
These strong stocks often attract consistent buying that drives clean breakouts and lasting rallies. Spotting them early gives traders a real edge in identifying future market leaders.
Relative strength line at new highs uncovers strong stocks
The relative strength (RS) line shows how a stock is performing compared to the overall market. Just like we track price breakouts, it’s smart to watch for RS lines making new highs – often a sign of quiet strength.
Relative Strength is a leading indicator that corresponds directly to the price action of a stock. When an individual stock is outperforming the market, the RS Line points upward.
When the RS line breaks into new high territory, that’s a big deal. It means the stock is showing leadership potential, and there’s a good chance institutions are already buying in.
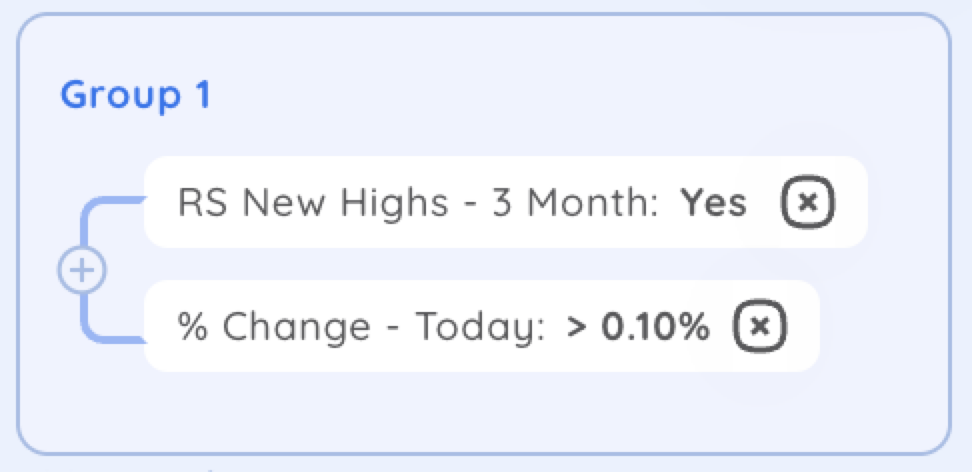
Stocks with Relative Strength Lines at new highs are often leaders in their sectors or industries. New highs in the RS line suggest that the stock is in strong demand, often driven by institutional buying.
Stocks with similar breakout patterns, those with RS lines making new highs, are more likely to be strong performers. Stocks with consistent RS strength are more likely to sustain advances, making them ideal candidates to become the next market leader.
Strong stocks have more relative strength days
Relative Strength Days, are days in which a stock is showing relative strength compared to the broader market. Analyze a stock’s daily performance to consider how the price moved in relation to the action of the index.
Tracking RS days helps confirm whether a stock’s strength is just a short-term blip or part of a longer trend. It’s a great way to find names that are consistently leading, not just catching a quick bounce.
Counting RS days allows traders to observe how often a stock closes relative to the market or its peers. In markets with mixed signals or increased volatility, counting RS days helps traders focus on stocks that are resilient and outperforming.

Stocks that exhibit RS Days over 60% of the time during market corrections are potential leadership stocks you want to focus on when the market turns. This “OR Group” is part of a Screener Preset that looks for stocks exhibiting RS Days over 60% of the time.
Counting RS days helps traders zero in on consistent outperformers and provides an objective measure of strength. Stocks that show a high number of RS days are often poised for significant gains and display the qualities of future superperformance stocks.
Oops reversals show strong stocks being accumulated
An Oops Reversal is a powerful chart pattern that signals a potential market bottom. It occurs when a stock gaps down at the open, only to reverse higher by the close – a sign that buyers are stepping in with conviction.
The pattern starts with a gap down below the prior day’s low. Then, during the trading session, the price climbs back into the previous day’s range and eventually closes above the prior day’s close.
This type of reversal stands out because it flips negative sentiment into strength in a single day. What looks like a breakdown in the morning turns into a bullish signal by the close, often catching traders off guard.
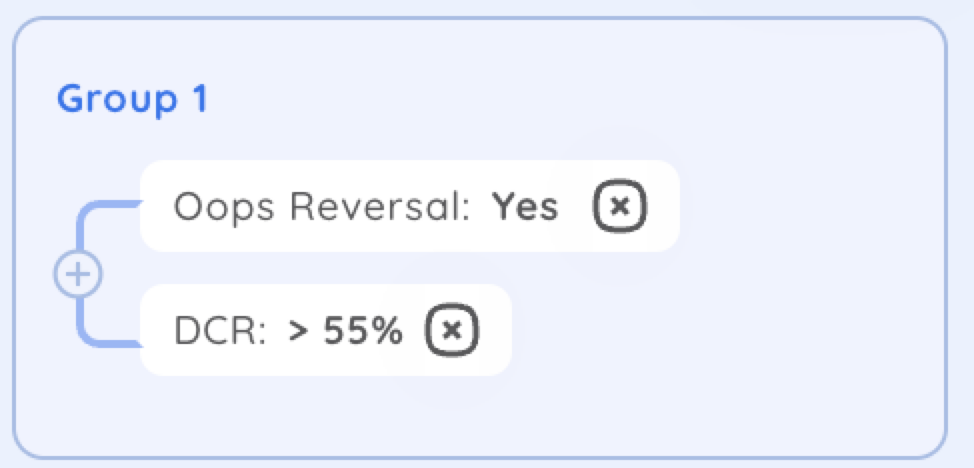
To build a screener for this setup, use the Oops Reversal technical pattern. Bonus points if the move happens after a prolonged downtrend or within a tight consolidation zone.
Oops Reversals can mark the start of bigger moves, especially when followed by continued strength. By identifying these patterns early, you can position yourself near the bottom with a clear stop level just below the reversal day’s low.
Strong stocks open at their lows
The open = low pattern happens when a stock opens and never trades below that opening price for the rest of the day. It signals strong buying right out of the gate, even when the broader market is weak.
This setup shows that buyers stepped in early and kept control all day. It’s a clear sign of demand, especially powerful when the market is trending lower.
You can screen for this pattern by filtering for stocks where the opening price equals the day’s low by using the preset technical pattern. It’s even more meaningful when paired with high volume or a green close.
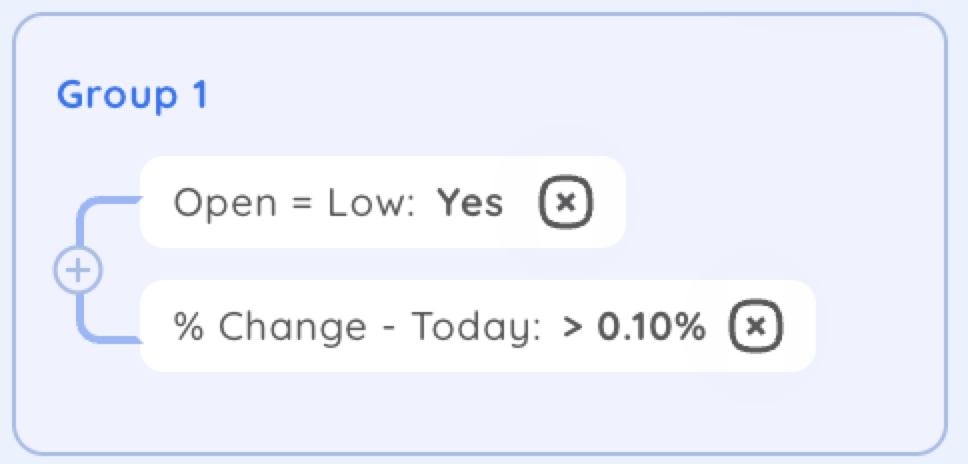
On down days, stocks with the open = low pattern often act like safe havens. They attract money while the rest of the market sells off – a strong sign of relative strength.
This pattern also gives traders a clear risk level since the low of the day is already defined. When combined with other bullish signs, like strong fundamentals or technical indicators, it can lead to high-probability setups.
Key takeaways for finding strong stocks on down days
Strong stocks don’t wait for perfect market conditions to show strength — they shine when things are messy. That’s why screening on down days gives you a real edge.
Strong stocks stand out when the market drops. They either hold steady or move higher while everything else is selling off.
Relative strength is your edge. It helps you zero in on stocks with real demand, often backed by institutional buying.
Down days reveal true leadership. The best time to screen is when the market is under pressure, not when everything is going up.
Use simple, effective patterns. Look for setups like green stocks on red days, open = low candles, RS lines at new highs, RS day counts, and oops reversals.
Build a watchlist of quiet leaders. These are the names likely to lead the next rally — and you’ll already be a step ahead.
You’re looking for stocks that refuse to break down. By using these patterns, you can build a watchlist filled with future leaders.
So next time the market’s in the red, don’t sit it out. Screen, study, and take notes. That’s when the strongest stocks start to reveal themselves


