Last Updated:
September 22, 2025
What Is Multiple Timeframe Technical Analysis?
Successful trading requires more than just spotting a chart pattern. Timing, trend alignment, and context across timeframes can make or break a trade.
Multiple timeframe technical analysis is the practice of looking at the same stock across different chart periods to get the full picture. Instead of relying on just one chart, you zoom out to see the bigger trend and then zoom in for precise entries and exits.
For example, a weekly chart shows you the overall direction of a stock—whether it’s trending higher, stuck in a base, or losing steam. Then, a daily chart reveals how that trend is unfolding in real time. Finally, intraday charts like the 15-minute or 30-minute help you nail the exact moment to buy or sell.
Why Multiple Timeframe Analysis Works for Traders
The main reason traders use multiple timeframes is clarity. Each timeframe serves a purpose, and when they line up, your odds of success go way up.
- Big picture clarity: The higher timeframe shows the dominant trend. If the weekly chart is in an uptrend, you know the wind is at your back.
- Better timing: Shorter timeframes help you spot clean entries, like pullbacks or breakouts, without chasing.
- Stronger conviction: If a breakout looks good on the daily but the weekly is flat or weak, you’ll know to hold off.
By stacking timeframes, you confirm the trend and avoid being fooled by short-term noise.
How Multiple Time Frames Reveal Ideal Stock Buy Points
Buying at the right time is just as important as picking the right stock. Multiple timeframes let you spot setups early on the bigger chart, then fine-tune your entries on the smaller ones.
Start with the longer trend.
Look at the weekly or monthly chart first. You want to identify classic bases like a cup-with-handle, a flat base, or a reversal after a long decline. These patterns show where big institutions may be stepping in.
Drop down to the daily chart.
The daily chart helps you confirm the base is valid. Look for rising moving averages (like the 20-day and 50-day), tight consolidations, and low-volume pullbacks. This tells you buyers are quietly building positions before the next move up.
Fine-tune entry with the intraday charts.
Once the setup is there, use the 15-minute or 30-minute chart to zoom in. Watch for higher lows, strong price action, and intraday support areas. Many traders also use short-term moving averages as a trend filter. This gives you the confidence to pull the trigger when buyers truly take control.
How Multiple Time Frames Show the Right Time to Sell Stocks
Just like entries, exits improve when you use multiple timeframes. You don’t want to sell too early and miss the bigger move, but you also don’t want to hold through a sharp reversal.
- Take partial profits intraday: If a stock hits resistance on a shorter timeframe, trim some. For example, sell a third at a daily resistance level.
- Use intraday charts for stops: Trail a stop under the most recent swing low so you lock in gains without giving back too much.
- Let the longer trend ride: If the stock keeps making higher highs and holding key moving averages on the weekly or daily, let part of your position run.
Always try to be in a position of strength as early as possible by scaling out into strength using the shorter timeframe. Then use the longer timeframe to trail stops and let the longer trend develop.
Trend Alignment: The Secret to Higher Probability Trades
The biggest edge in multiple timeframe analysis comes from trend alignment. That’s when the weekly, daily, and intraday charts all point in the same direction.
- Weekly: Clear uptrend with higher highs.
- Daily: Strong structure with rising moving averages.
- Intraday: Breakout with momentum and support.
When all three align, you’re not fighting the market – you’re trading with it. That’s when you get the high-probability setups that every trader looks for.
What Are Mini Charts?
Mini charts are a feature in Deepvue that let you view multiple charts at once, across different timeframes. Instead of flipping back and forth, you can see the weekly, daily, and intraday charts for a stock side by side.
With mini charts, you can:
- Scan an entire watchlist quickly.
- Sort stocks by custom data or metrics.
- Spot trend alignment without clicking through dozens of tabs.
It’s like having multiple screens worth of analysis on one, saving you time and keeping you focused.
Technical Analysis of Multiple Timeframes With Deepvue’s Mini Charts
Whether you’re a swing trader, day trader, or longer-term trend follower, you can set up mini charts to match your trading strategy.
- Swing traders: Pair weekly + daily charts to see the base pattern and confirm breakouts.
- Day traders: Use daily + 15-minute charts to time intraday moves in sync with the bigger trend.
- Trend followers: Track weekly + daily + 65-minute charts to catch major runs without losing sight of short-term momentum.
Adjust the timeframes to help you spot when buyers step in, avoid false breakouts, and manage risk with tighter stops. You’ll know not just what the stock is doing now, but how it fits into the bigger picture.
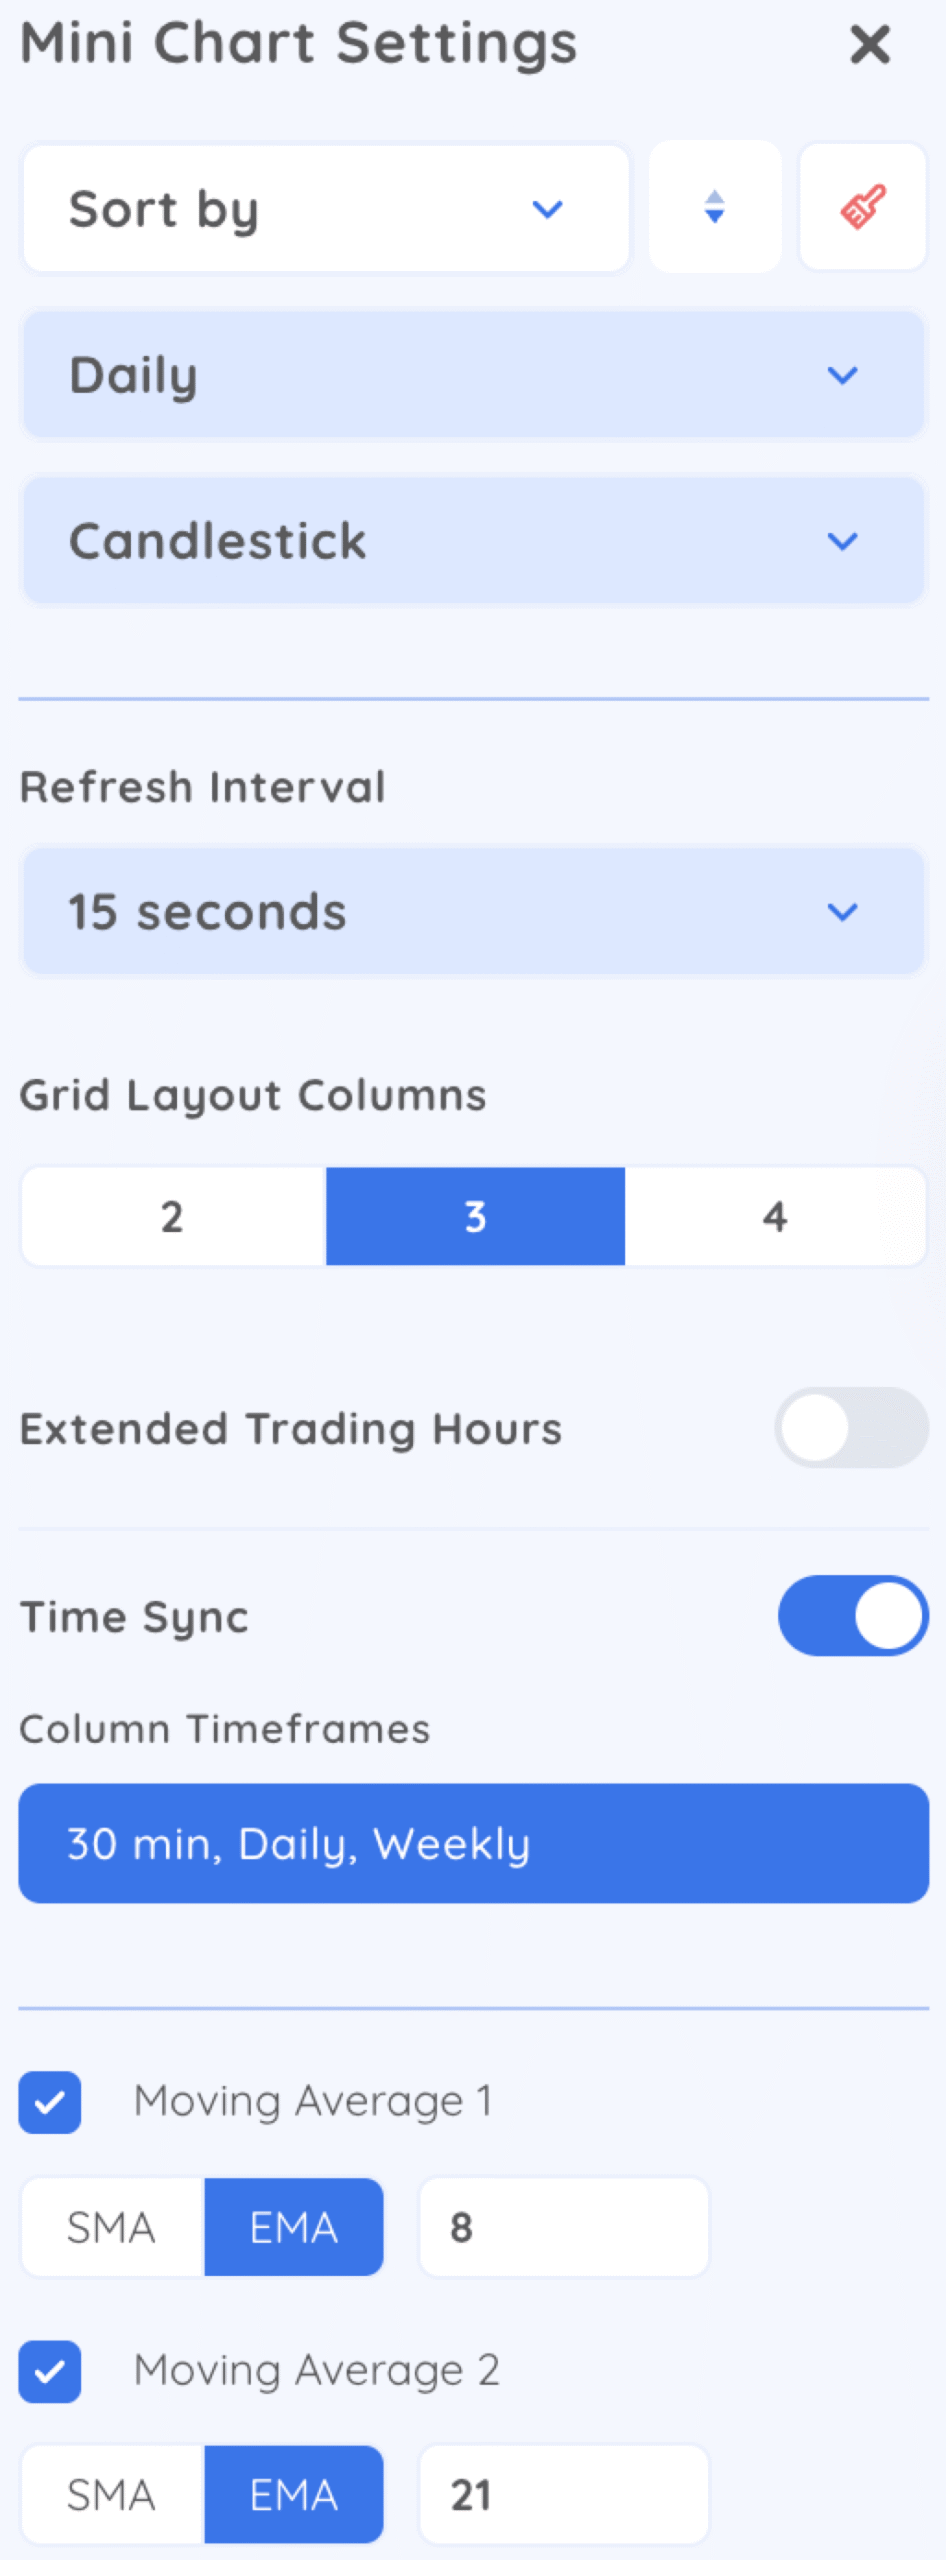
In the settings, select how many columns, column timeframes, and two moving averages.
Case Study 1: Weekly, Daily, 65-Minute
Trend traders often lean on the daily chart as their main guide. The weekly chart confirms the broader trend, while something like a 65-minute chart helps fine-tune entries.
Take TSLA as an example. On the weekly chart, the stock began forming a tight consolidation – a clue that big players might be quietly accumulating shares. On the daily chart, it showed traits of a classic Volatility Contraction Pattern (VCP), a bullish setup where price tightens before expanding higher.
When traders zoomed into the 65-minute chart, the picture became even clearer. A gap-up signaled fresh momentum and provided a low-risk entry point. Those who acted on that alignment captured a quick 25% run, showing how layering timeframes can uncover powerful trades.
Case Study 2: Daily, 30-Minute, 3-Minute
Short-term swing traders and active day traders often focus on intraday charts for precision, but they still anchor their trades to the daily chart. A strong setup on the daily can then be dialed in with two intraday timeframes, like the 30-minute and the 3-minute charts.
With PLTR, the daily chart showed the stock forming higher lows up the right side of a base, creating a pivot area to watch. On the 30-minute chart, traders spotted an intraday shakeout, where weak hands were forced out before the real move.
Dropping further to the 3-minute chart, a clean gap-and-go setup unfolded, offering an explosive entry for day traders looking to catch momentum early. By stacking these three timeframes, traders avoided false starts and timed their entries with precision.
Case Study 3: Monthly, Weekly, Daily
Longer-term traders and investors usually rely on the weekly chart to guide their decisions. But pairing it with the monthly chart provides even more perspective on where a stock sits in its lifecycle. The daily chart then helps fine-tune when to step in.
That’s exactly what happened with BE. On the daily timeframe, the stock showed a breakaway gap, hinting that demand had suddenly surged. The weekly chart revealed this move was breaking out of a cup-and-handle pattern, one of the strongest bases in technical analysis.
Finally, the monthly chart showed something even more compelling: BE was on the verge of breaking out of a 6-year base. For position traders, that kind of alignment across three timeframes signals not just a trade, but potentially the start of a much larger trend.
Final thoughts: Quickly Analyze Multiple Timeframes with Mini Charts
Successful trading isn’t just about spotting a pattern on one chart – it’s about seeing how that setup fits into the bigger picture. That’s why multiple timeframe analysis is so powerful.
The weekly chart shows you the dominant trend, the daily chart confirms if that trend is healthy, and the intraday chart helps you time your entry and exit down to the minute.
When all three timeframes align, your chances of success go way up. You’re no longer guessing or chasing moves – you’re trading in sync with the market.
Deepvue’s mini charts make this process faster and easier. Instead of jumping between tabs, you can view multiple timeframes for every stock in your watchlist at once. That means you’ll spot breakout setups sooner, avoid false signals, and manage your trades with more confidence.
Whether you’re swing trading, day trading, or following longer-term trends, mini charts give you the clarity to act decisively. Combine that with solid risk management, and you’ll have a simple but powerful edge in the market.


