Last Updated:
June 14, 2025
What is stock market breadth?
Stock market breadth provides a wide lens, showing the overall participation of individual stocks within the market. It helps you gain a better understanding of the real strength or weakness behind big index moves.
If most stocks are moving higher, that’s a good sign
if only a small group is leading, there may be trouble ahead.
Market breadth gives you a wide-angle view of market strength and helps explain what’s really happening behind major index moves.
Breadth helps traders and investors:
- Confirm if a trend is real or likely to fail
- Spot early signs of a reversal
- Gauge market health beyond the headlines
How market breadth reveals real market strength
Let’s say the S&P 500 is rising steadily. On the surface, that looks bullish. But with a closer look, what if only a few tech giants like Apple, Microsoft, and Nvidia are doing all the heavy lifting?
In that case, you’re looking at a narrow rally. Breadth is weak because the majority of stocks aren’t participating. This kind of move is more fragile and can reverse quickly if those few leaders falter.
Now, imagine a different scenario. Maybe the index is flat, or even slightly down. But under the hood, dozens or even hundreds of stocks are quietly making new highs. That’s a sign of strength building beneath the surface, and often, it leads to a broader rally.
This is where breadth becomes powerful. It highlights when the market is in synch and working in harmony, as well as divergences when the index tells one story, but individual stocks tell another.
By watching breadth, you’re not just reacting to what the market looks like – you’re anticipating where it might go next. That’s a huge edge for any trader or investor.
How market breadth reveals real market strength
Market breadth isn’t just a single number – it’s a collection of tools that help you see the real story behind price moves. These tools give you different angles to answer one key question: Are most stocks moving with the market, or is the rally just an illusion?
When multiple stocks across various sectors are participating in a trend, it shows that the move is broad-based and likely more sustainable. But when just a few names are driving all the gains, the trend may be weak and short-lived.
Here are some of the most effective tools traders use to analyze market breadth:
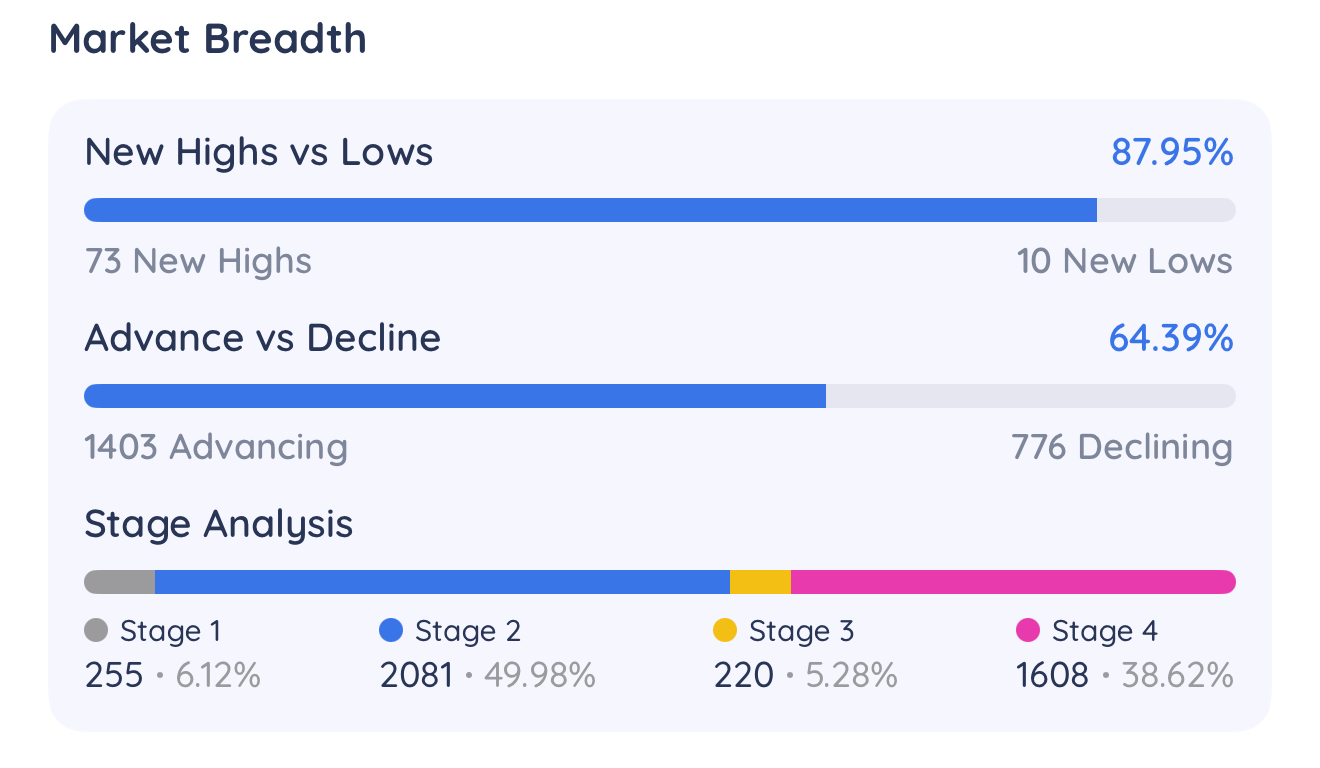
- New Highs vs. New Lows: Compares how many stocks are hitting new 52-week highs against new lows.
- Advancers vs. Decliners: Tracks how many stocks are rising versus falling each day.
- Stage Analysis: Based on Stan Weinstein’s Stage Analysis, shows how many stocks are in key phases like uptrends or downtrends.
- Sector Rotation: Reveals where money is flowing – into growth, value, defensive, or cyclical sectors
Why every trader should care about market breadth
When you’re trading the markets, keeping an eye on market breadth is essential. It shows you whether a trend is built on solid ground or if it’s just a few big names pulling all the weight.
When many stocks are rising together, that’s strong breadth. It means there’s broad-based optimism and likely a healthy uptrend.
But when only a few names are driving the market while others lag, that’s weak breadth. It signals a fragile rally that could reverse quickly.
Breadth also helps you catch divergences – those moments when the index behaves differently than the individual stocks. These are often early warning signs before a change in momentum.
Paying attention to breadth gives you the edge to act early. You can adjust your position sizes, manage risk effectively, or shift capital to stronger sectors.
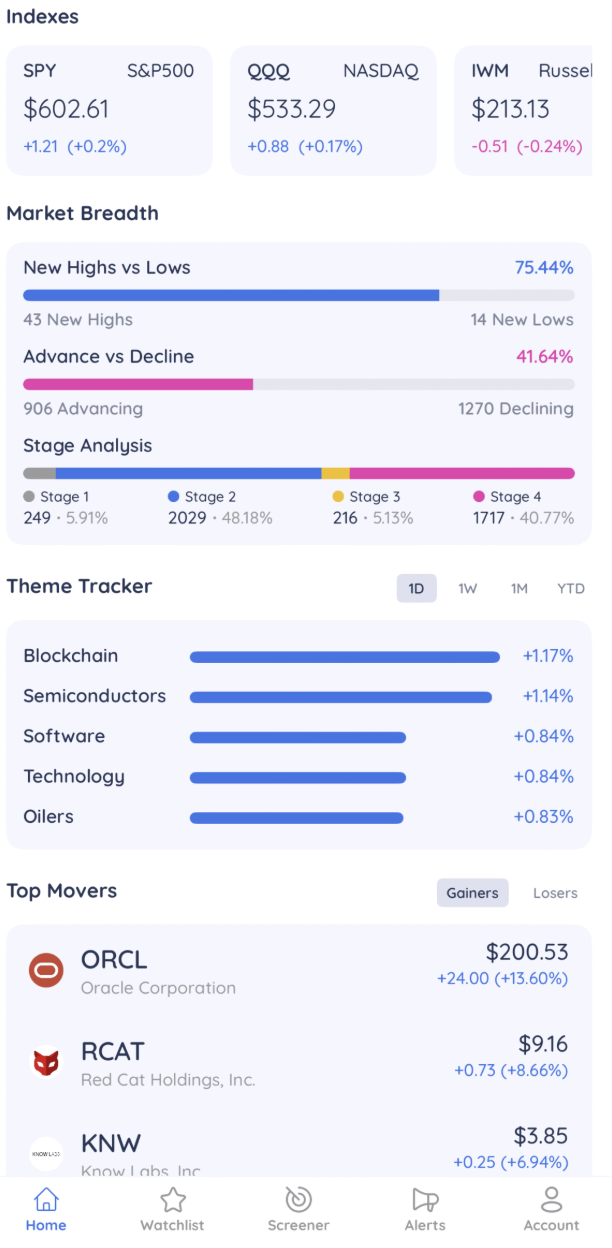
How Deepvue’s home view shows market breadth on one screen
Deepvue’s home screen combines many market breadth tools into one simple-to-read view.
Here you can track:
Major Indices
New Highs vs. New Lows
Advancers vs. Decliners
Stage Analysis
Sector Rotation
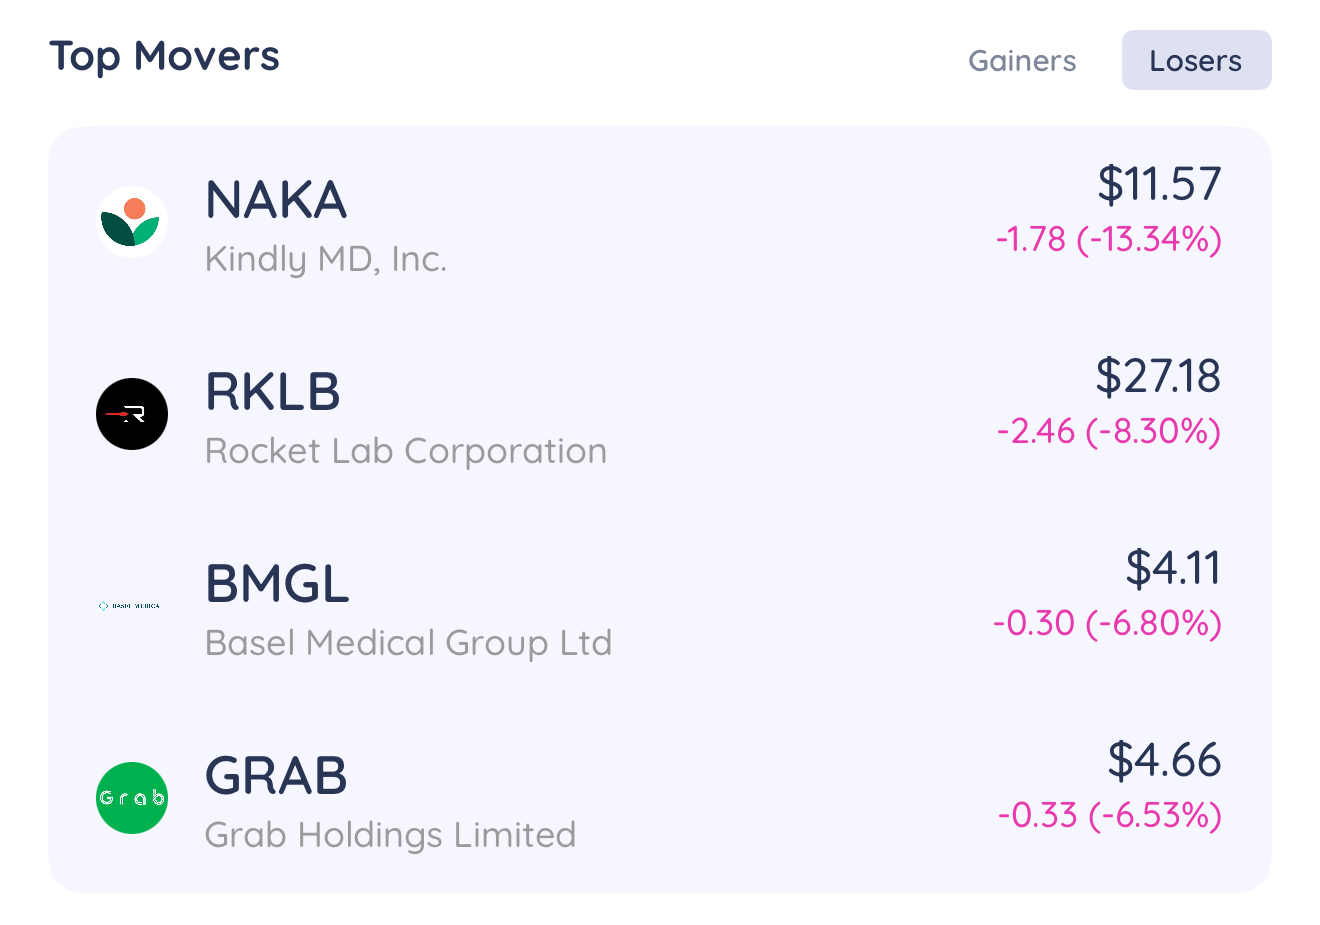
Top Movers
Why tracking major indices keeps you aligned
Tracking major indices is essential for traders because it offers a quick snapshot of the overall market’s direction and sentiment. Indices like the S&P 500, Nasdaq, and Russell 2,000 help traders understand if their trades are aligned with broader trends.
Indices guide sector focus by highlighting which areas of the market are leading or lagging. For example, strong Nasdaq performance often signals strength in tech stocks, while strength in the S&P 500 can signal strength in more cyclical stocks.
They also help traders spot divergences when index movement doesn’t match individual stock participation. This insight is crucial for managing risk and changing portfolio allocations.
Indices influence investor psychology and drive large capital flows, especially from institutional players. By following them, traders stay more in tune and in sync with market momentum.
How to use powerful market breadth indicators
Indicators like New Highs vs. New Lows reveal whether that strength is real or just a few big names propping up the market. A surge in new highs confirms broad participation, while a rise in new lows signals growing weakness that traders shouldn’t ignore.
Advancers vs. Decliners helps you spot early trend shifts by showing many stocks are moving up versus down each day. If advancers outpace decliners while the index is rising, you are in a healthy uptrend. But if the index climbs while decliners outpace advancers, it’s often a red flag that a correction may be around the corner.
By breaking stocks into Stan Weinstein’s four stages – Basing, Advancing, Topping, and Declining – you can see where most stocks or sectors stand in the bigger picture. If the majority are in a Stage 2 Uptrend, that supports a bullish outlook. But a shift toward more stocks in a Stage 3 Topping phase or Stage 4 Decline suggests a market under pressure, even if headline indices look calm.
Together, these tools help traders cut through noise. They highlight true market strength or weakness, improve entry and exit timing, and help manage risk more effectively.
Ignoring them means you might miss critical divergences or reversals that could cost you. Using them gives you an edge in aligning with the market’s real direction.
How the theme tracker highlights strength by group
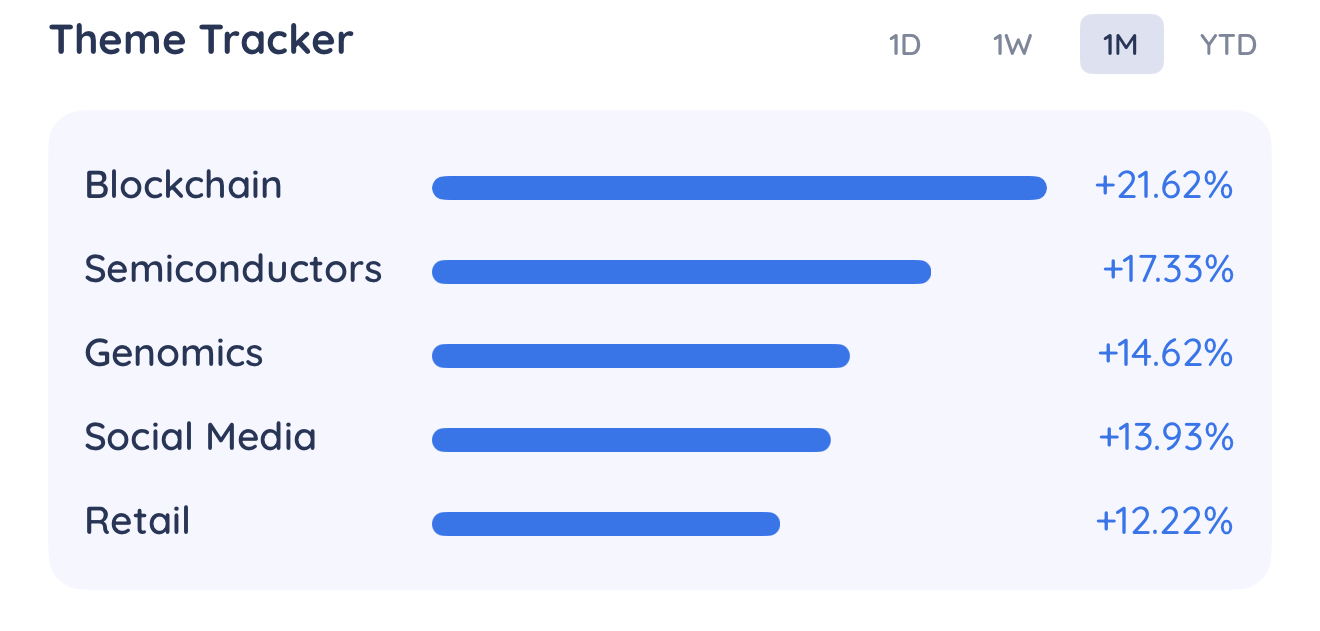
The Theme Tracker helps traders spot broad market strength by identifying which stock market themes, like AI, semiconductors, energy, or software, are leading or lagging. Instead of digging through endless watchlists, traders can zoom out and see which themes have strong group momentum, offering a clearer picture of where capital is flowing.
This top-down view enhances market breadth analysis by showing participation across sectors and industries.
Each theme reflects a curated group of stocks, updated regularly by Deepvue’s team to match current market conditions. Because over 50% of a stock’s movement is tied to its industry and sector, tracking theme strength gives traders an edge.
Compare performance across multiple timeframes – daily, weekly, monthly, and year-to-date – so you can detect trend changes as they happen to help identify market rotation. By focusing on the strongest themes and drilling down to leading stocks within them, traders can align their strategies with what’s really driving the market.
What top movers reveal about real-time sentiment
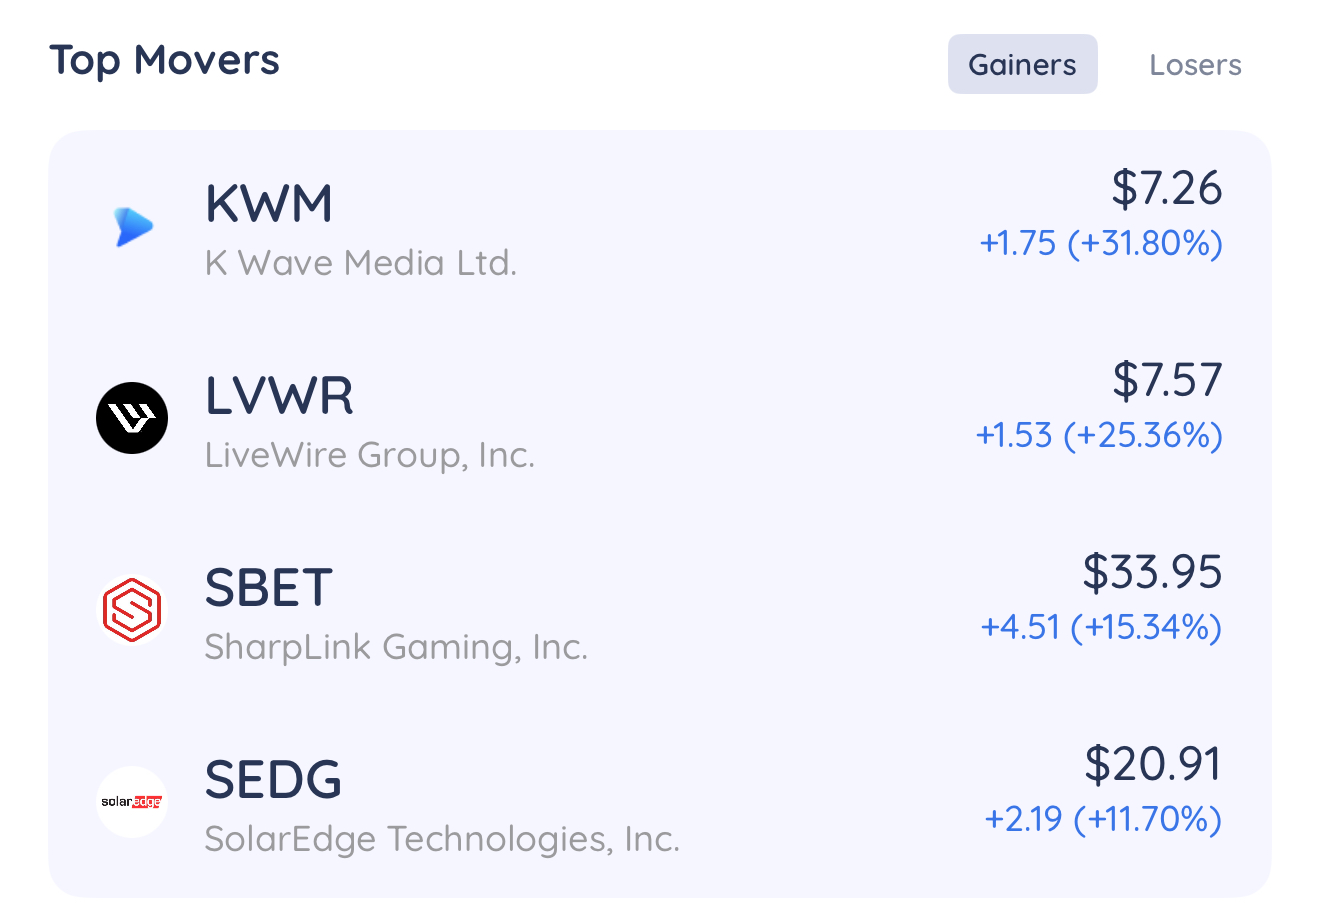
Watching top gainers and losers gives you a snapshot of real-time market strength or weakness.
If the day’s biggest gainers span multiple sectors and show strong price moves, it points to broad bullish participation. But when the gains are concentrated in just a few names, especially mega-cap stocks, the rally may lack depth and could be vulnerable to reversal.
Losers tell a similar story from the other side of the trend. A wide list of declining stocks across various industries signals broad selling pressure and weak breadth, often pointing to bearish sentiment.
Tracking top movers also reveals rotation between sectors. For example, if tech stocks dominate the gainers list while consumer staples lead the losers, it suggests a shift in investor focus. These sector rotations can indicate where momentum is building or fading, and help traders align their strategies with the market’s flow.
Final thoughts: why market breadth gives you a real edge
Market breadth is one of the most valuable tools traders can use to look beyond the headlines and understand what’s really happening in the market. It’s not enough to know whether the S&P 500 or Nasdaq is up or down – you need to know how many stocks are moving in the same direction and which areas of the market are gaining or losing momentum.
Whether you’re swing trading, investing longer term, or managing risk on a daily basis, paying attention to breadth helps you:
- Confirm the strength of a trend
- Spot early warning signs of reversals
- Identify rotation into (or out of) sectors and themes
Deepvue brings all these insights into one view, making it easier than ever to stay in tune with the market’s true direction.


