Last Updated:
August 29, 2025
How a Stage Analysis Screener Can Help Discover Trending Stocks
Stage Analysis is a classic trading strategy created by Stan Weinstein in the 1960s. After losing money during a market crash, even while holding fundamentally strong stocks, Stan realized that timing was everything.
After digging into thousands of stock charts, he discovered that most stocks follow a simple cycle: they build a base, trend upward, top out, fall, and then start the cycle again.
This method helps you understand where a stock is in its journey so you can make better trades. You don’t need complicated indicators – just price, volume, and a few moving averages.
The Stan Weinstein Stage Analysis Screener takes the core of Stan’s system – price, volume, and moving averages like the 30-week MA – and scans thousands of stocks for you. It shows you, in real time, which stocks are entering key phases.
Whether you’re tracking stocks building a Stage 1 base, breaking out into Stage 2, topping in Stage 3, or trending down in Stage 4, Deepvue’s stage analysis screener helps you quickly spot where each stock is in its cycle.”
The Four Stages of Price Action Explained
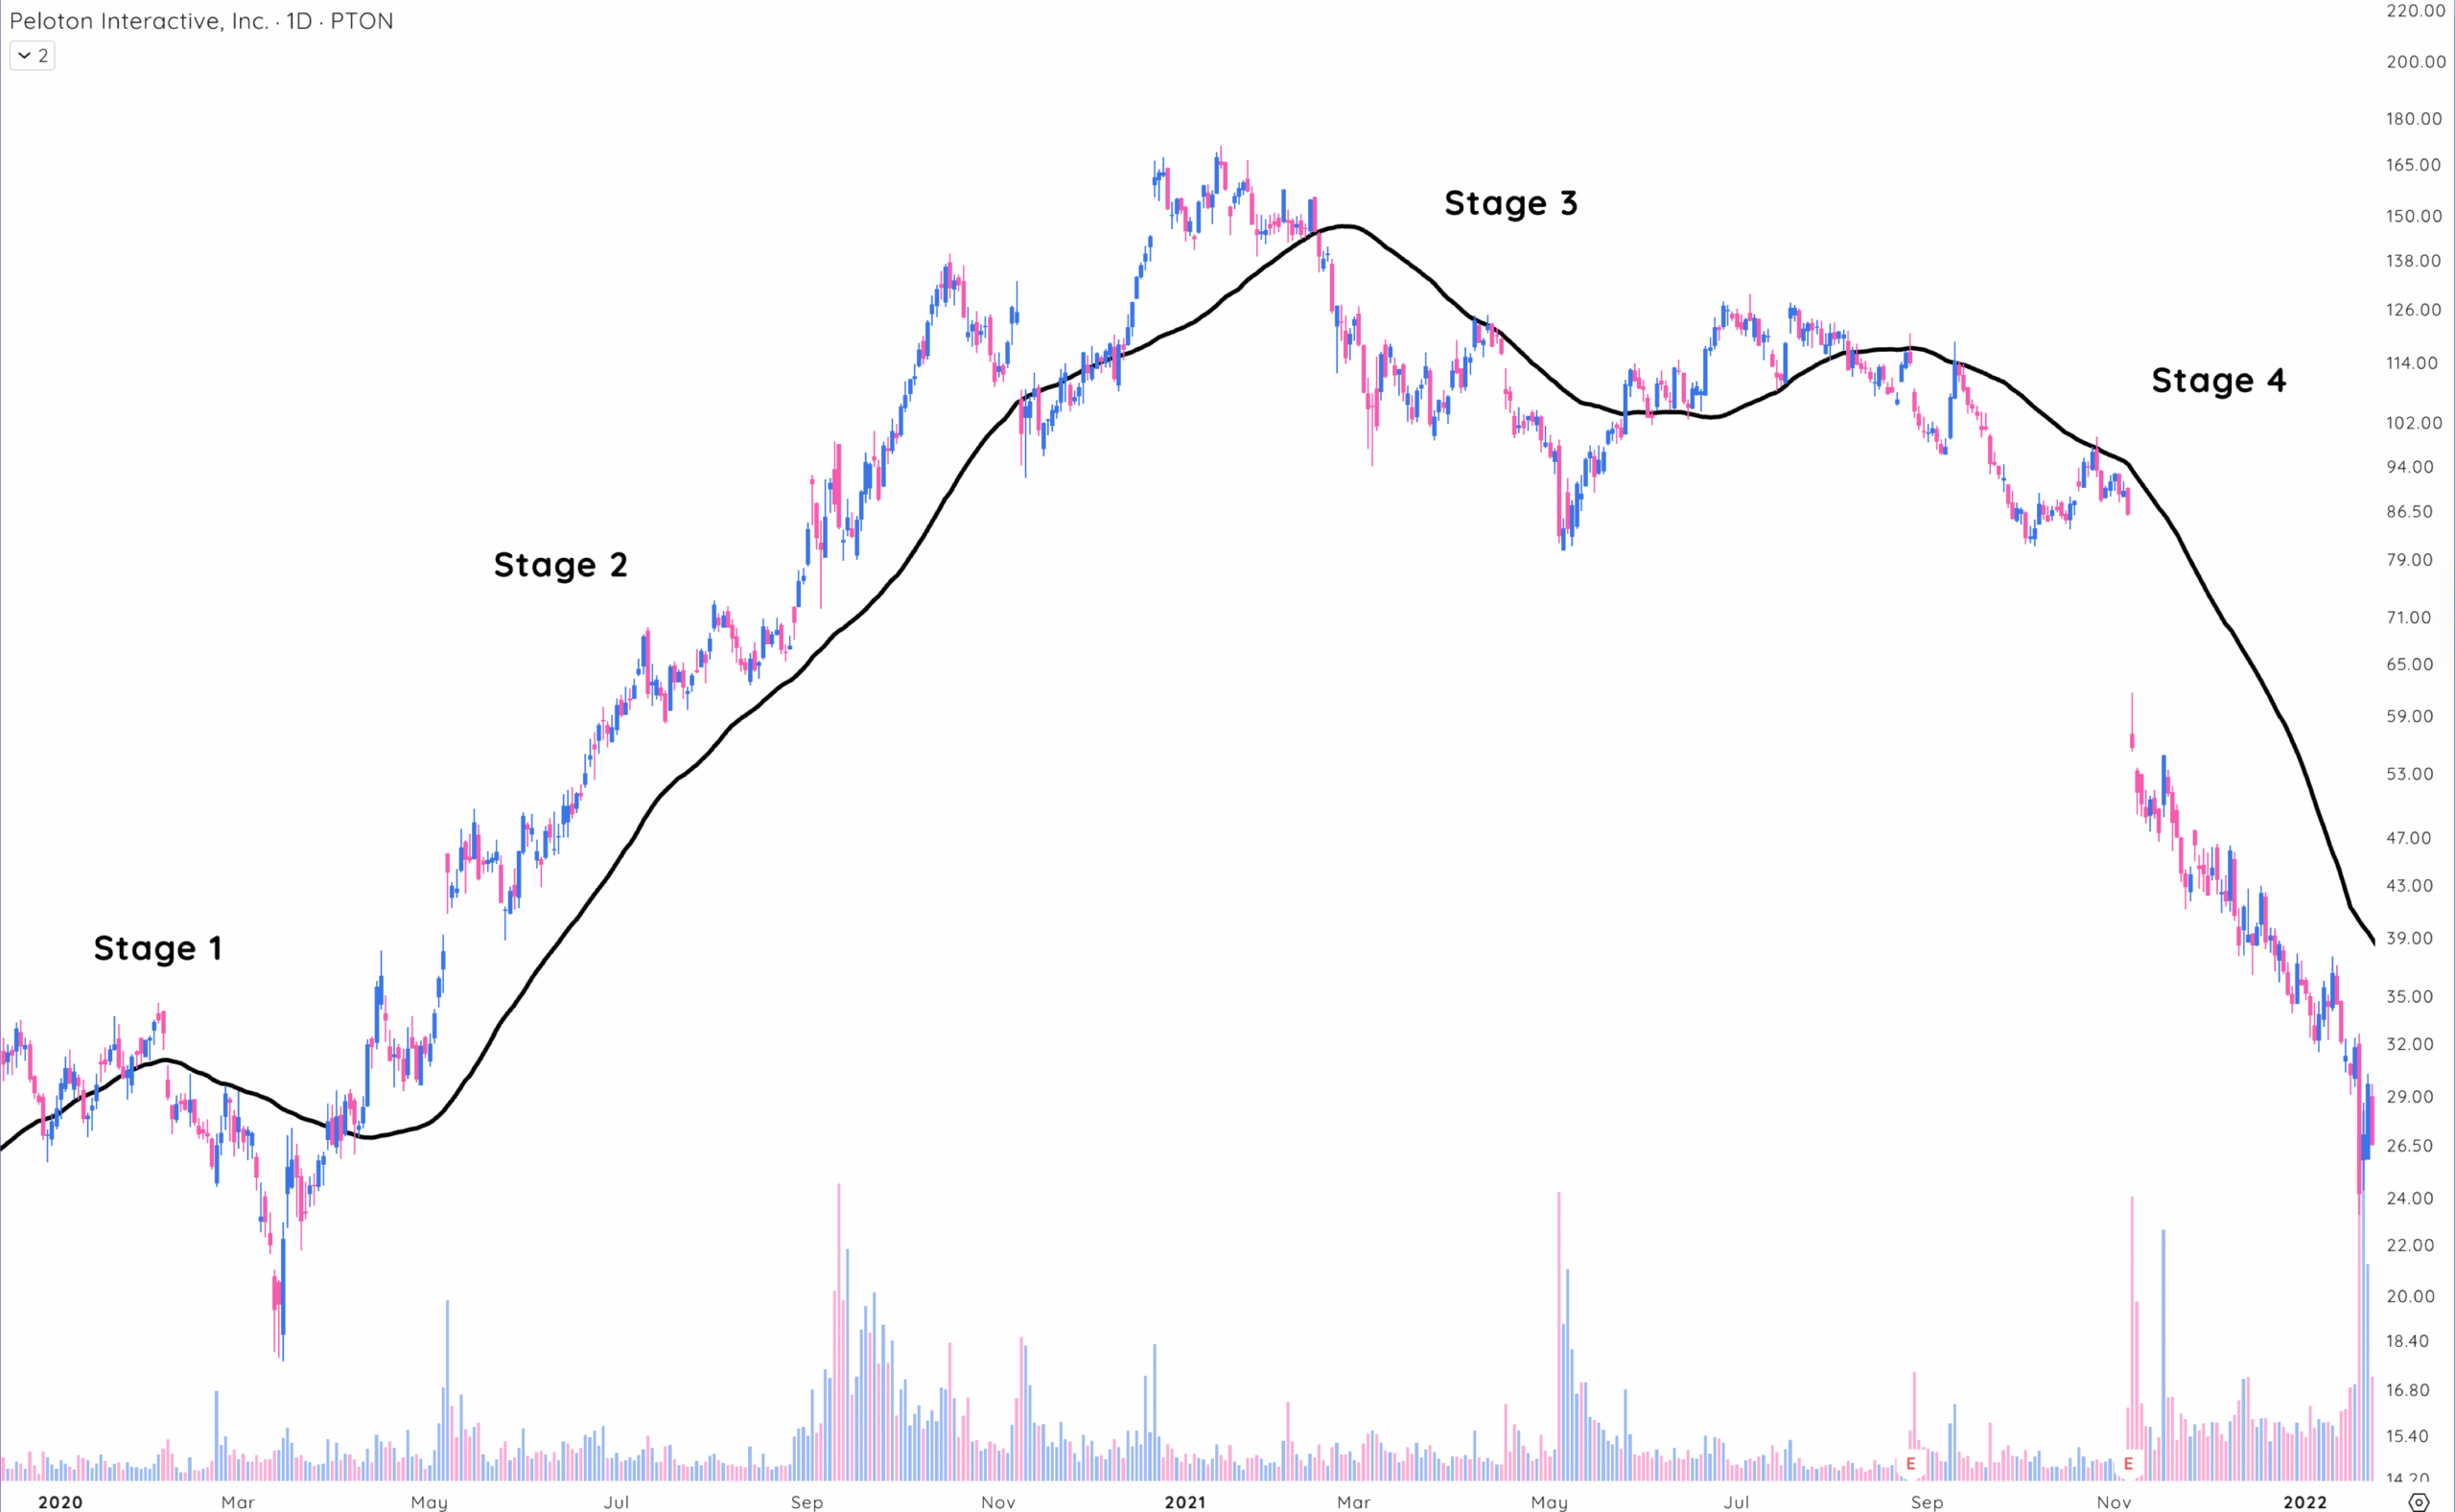
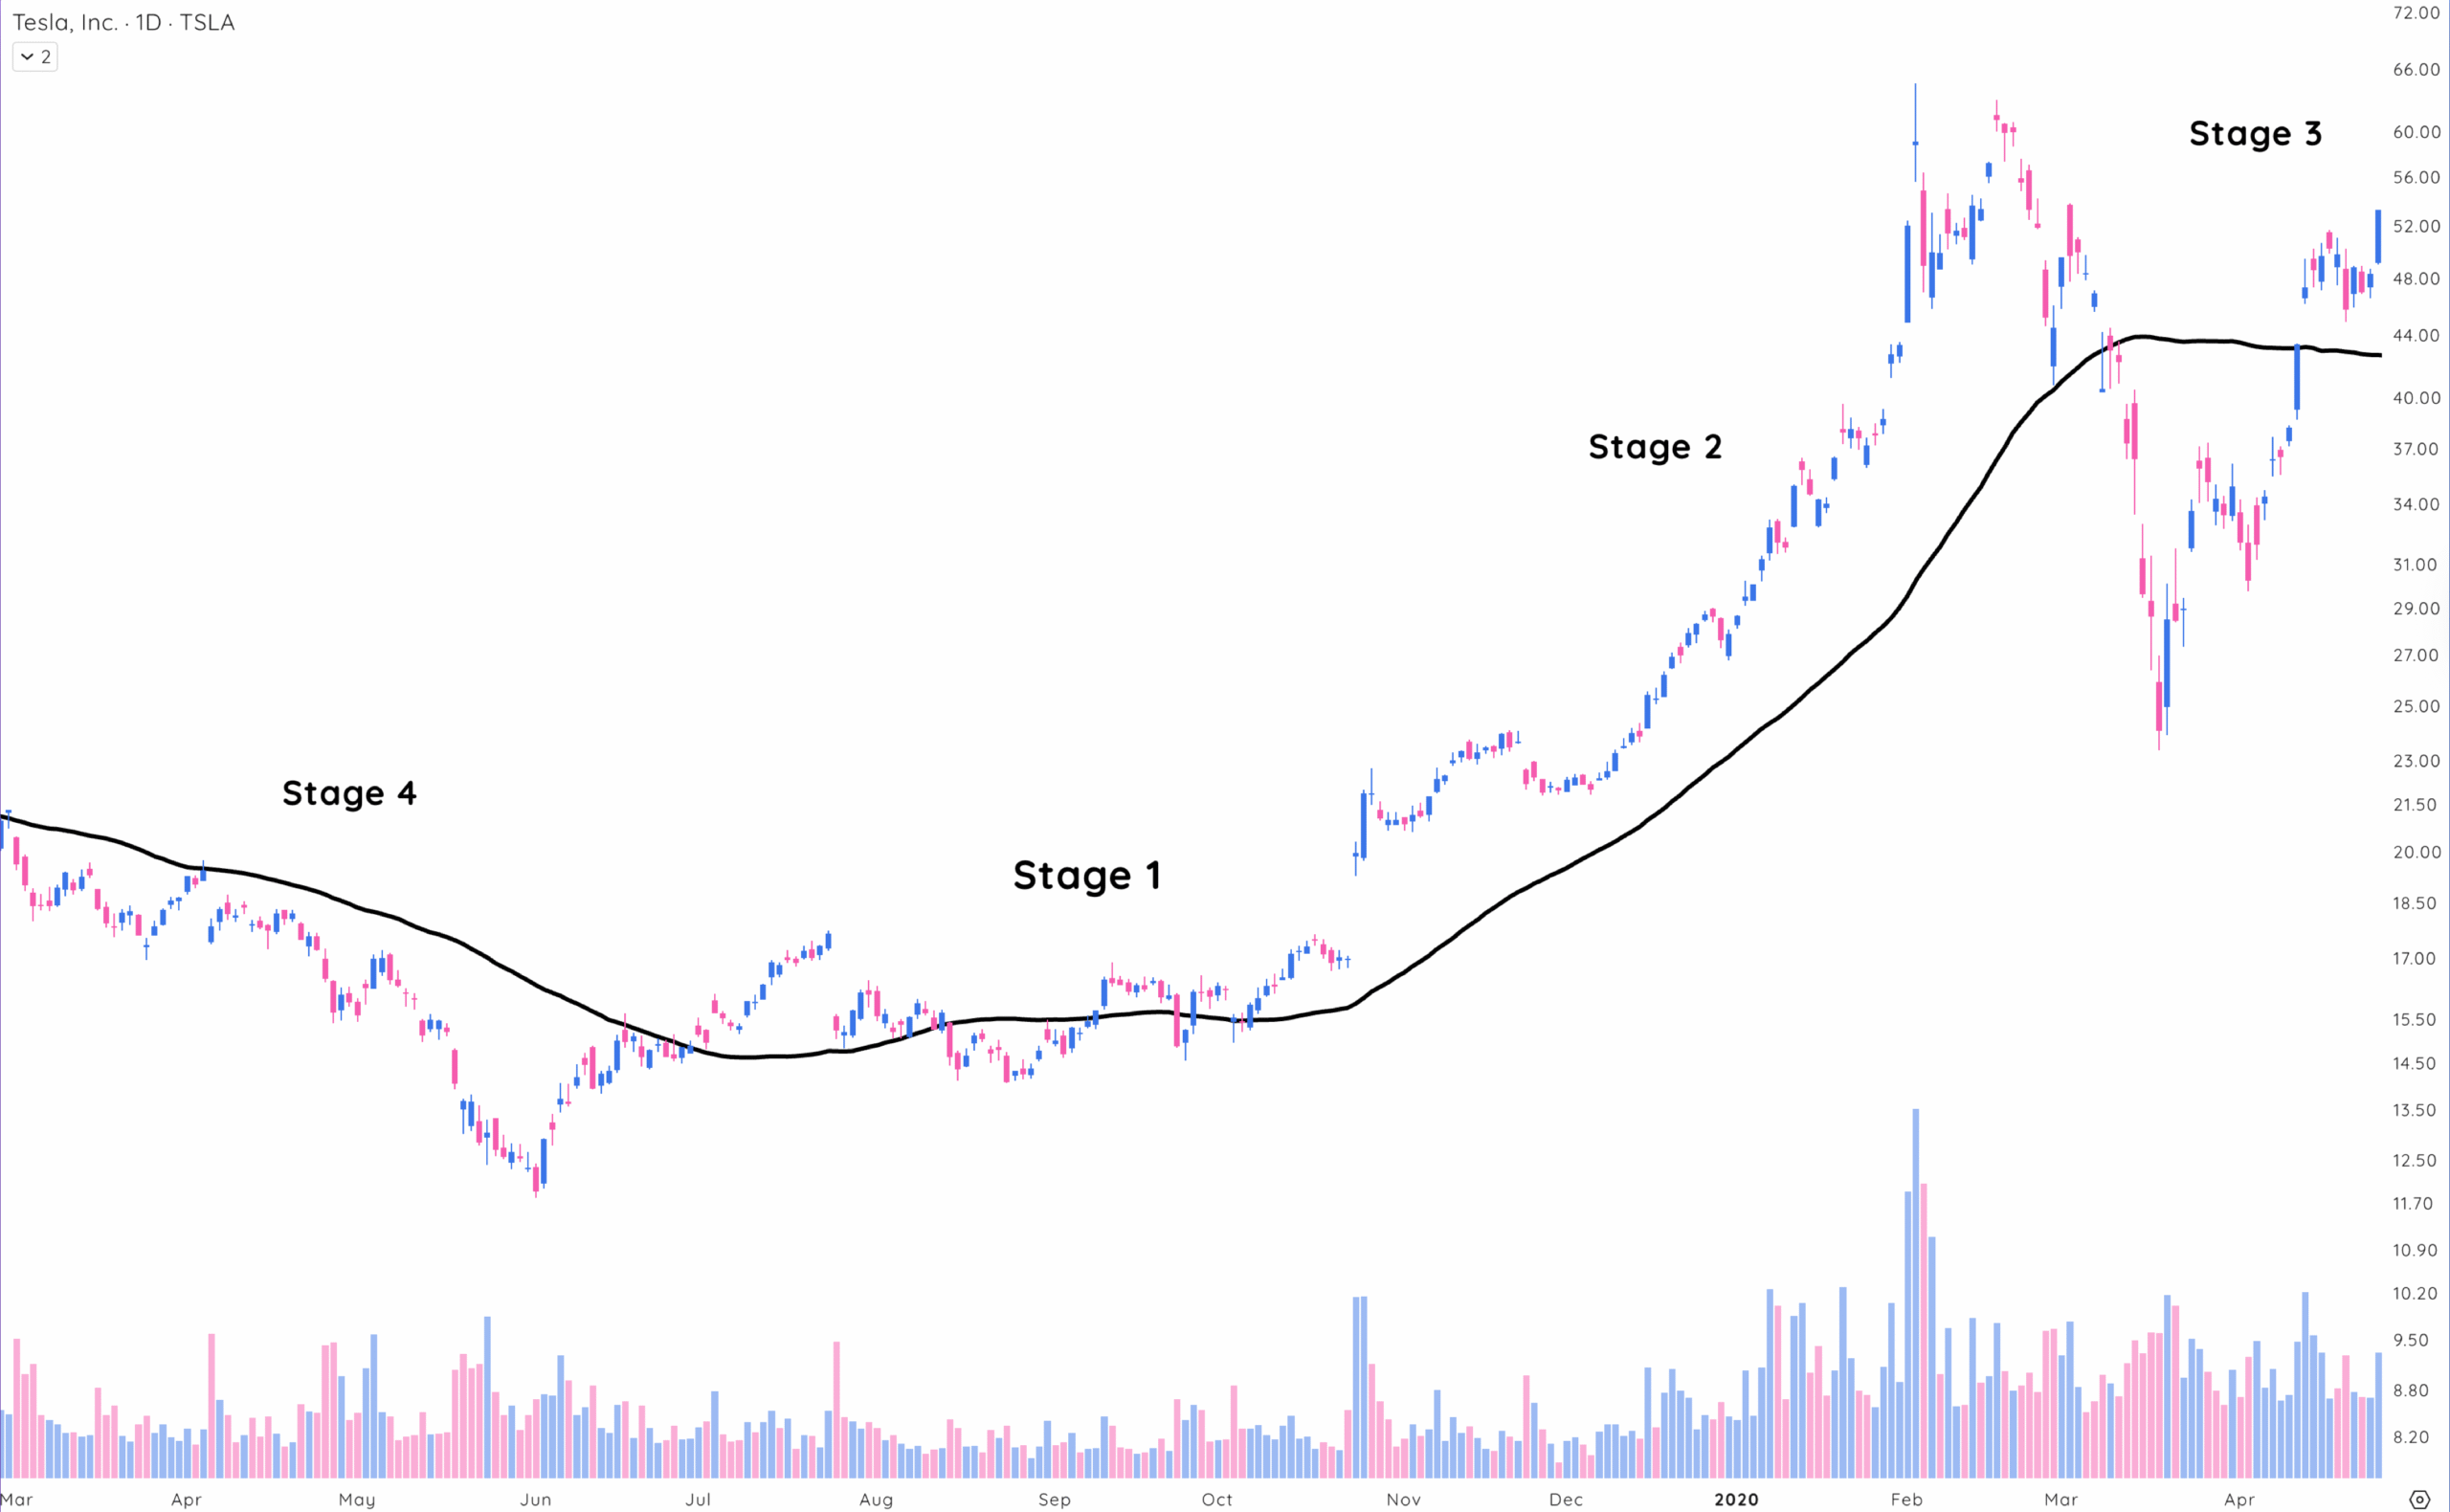
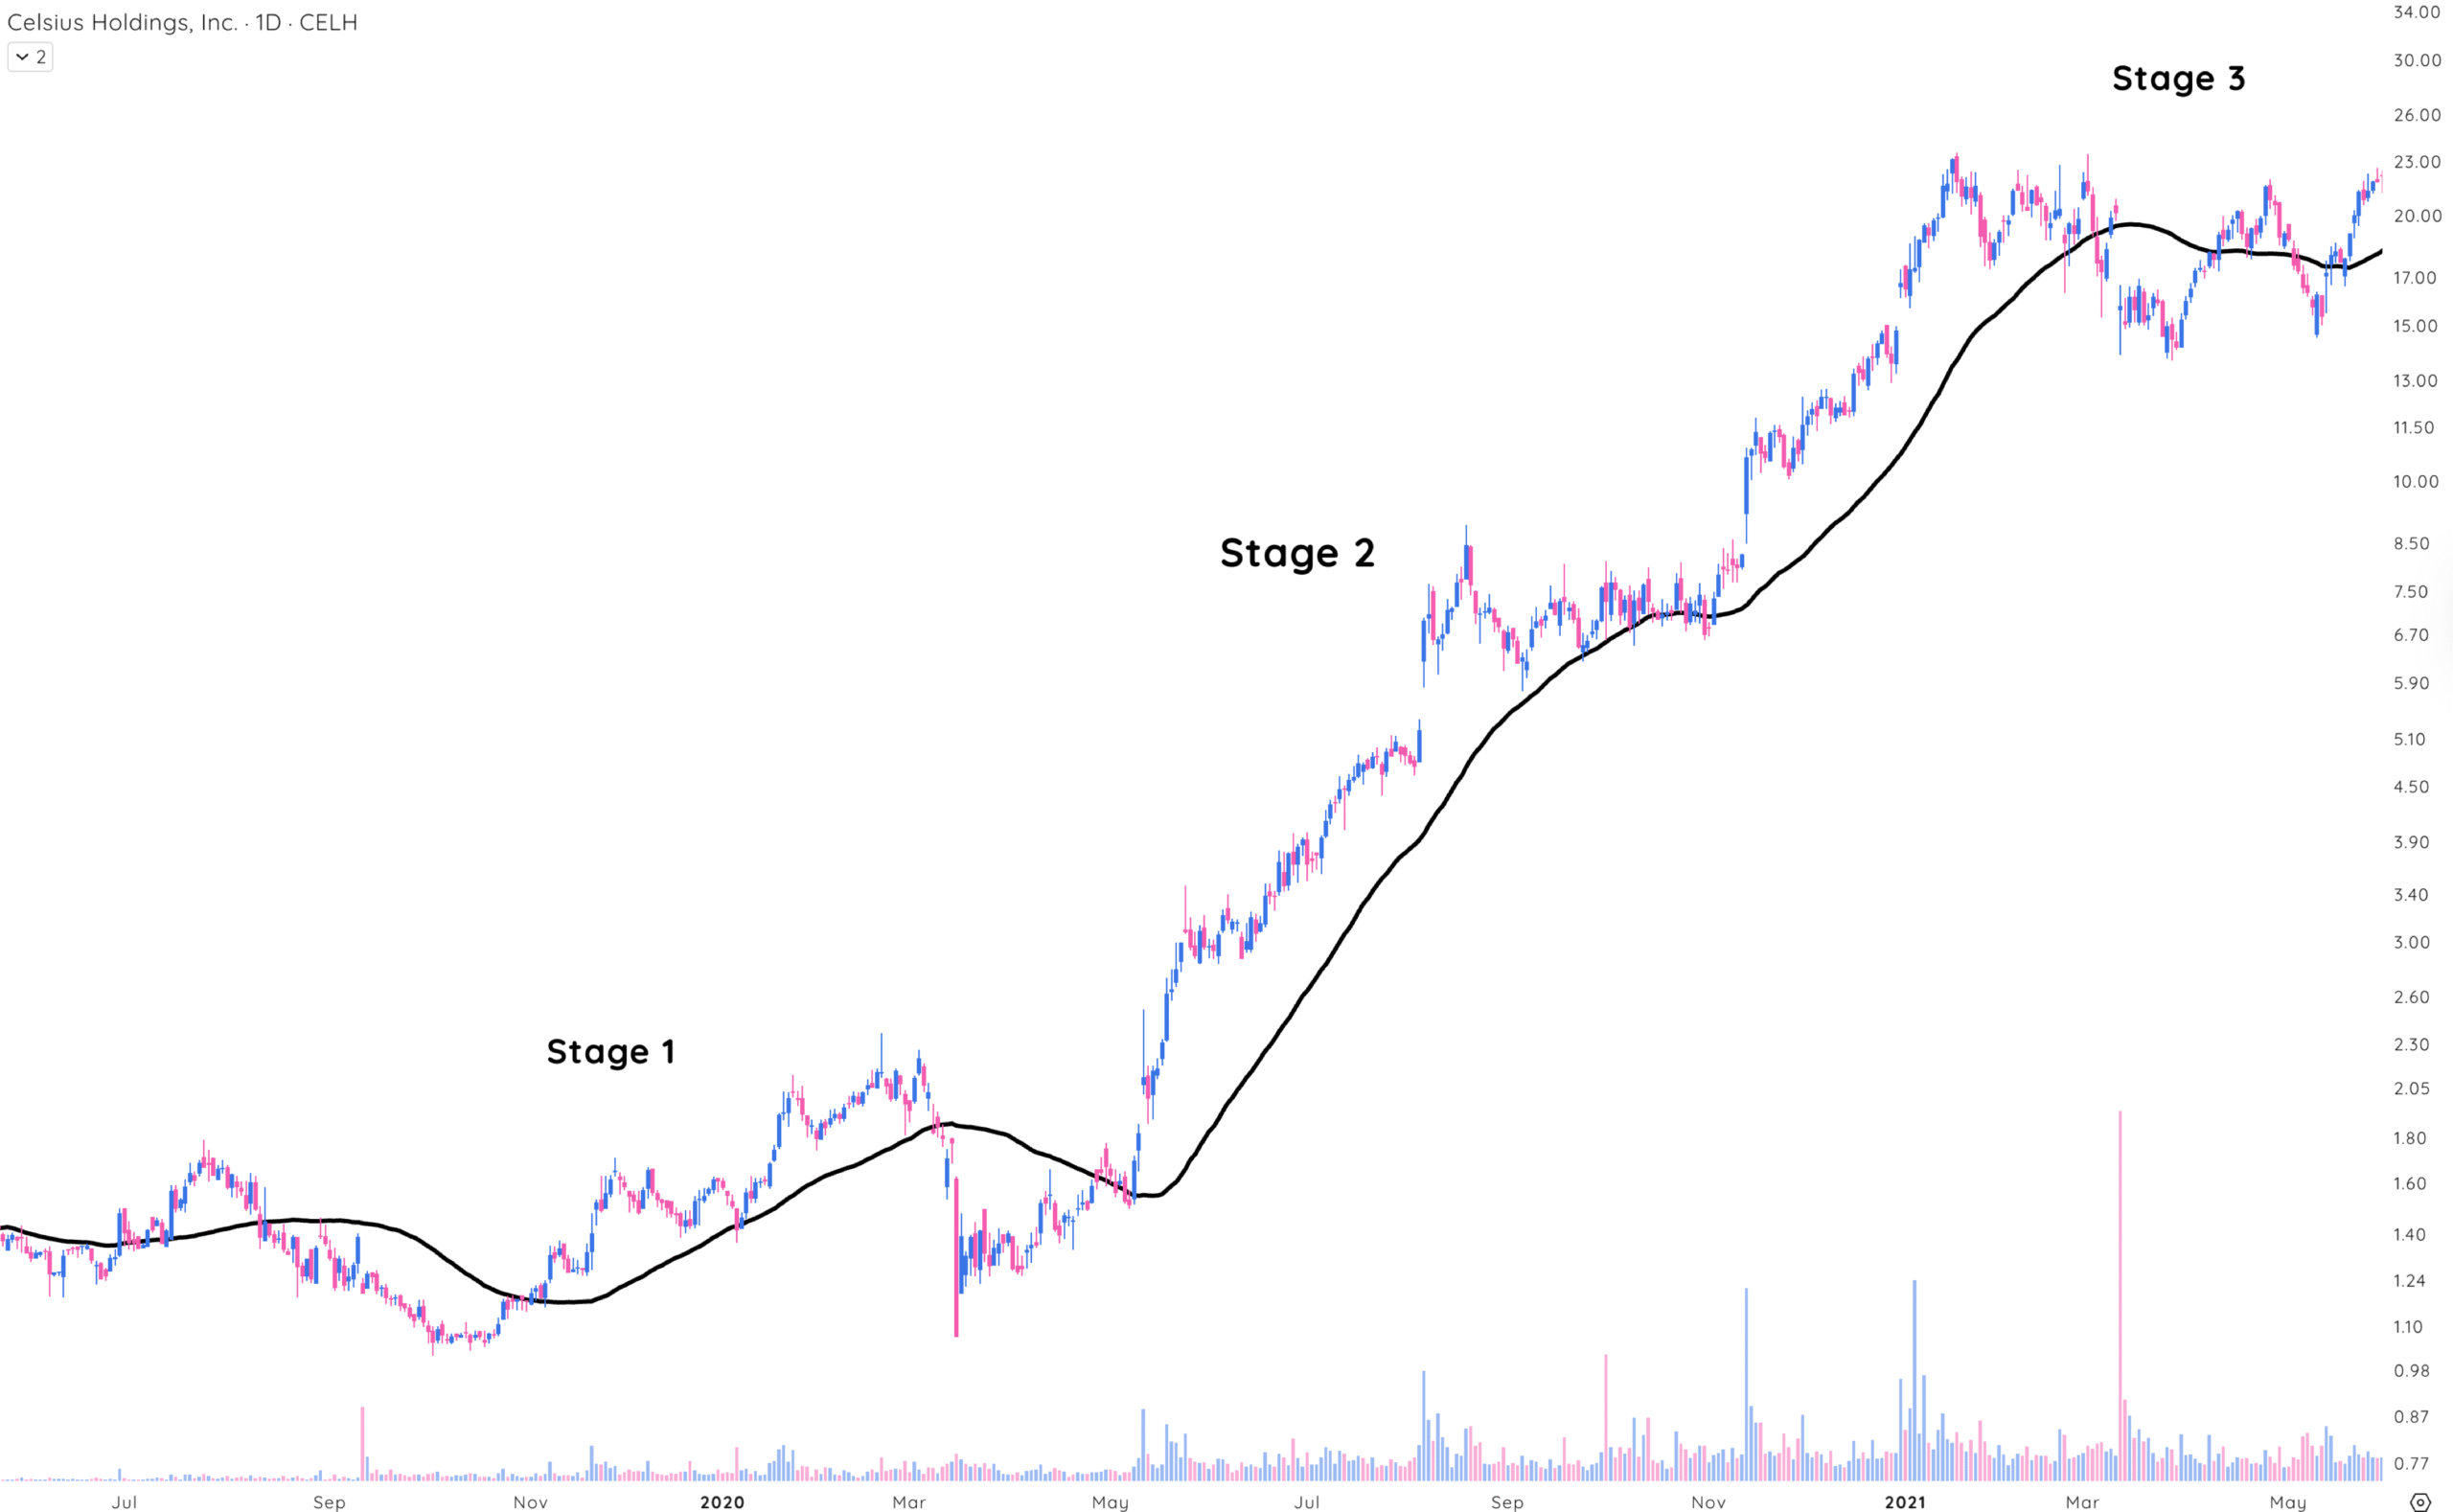
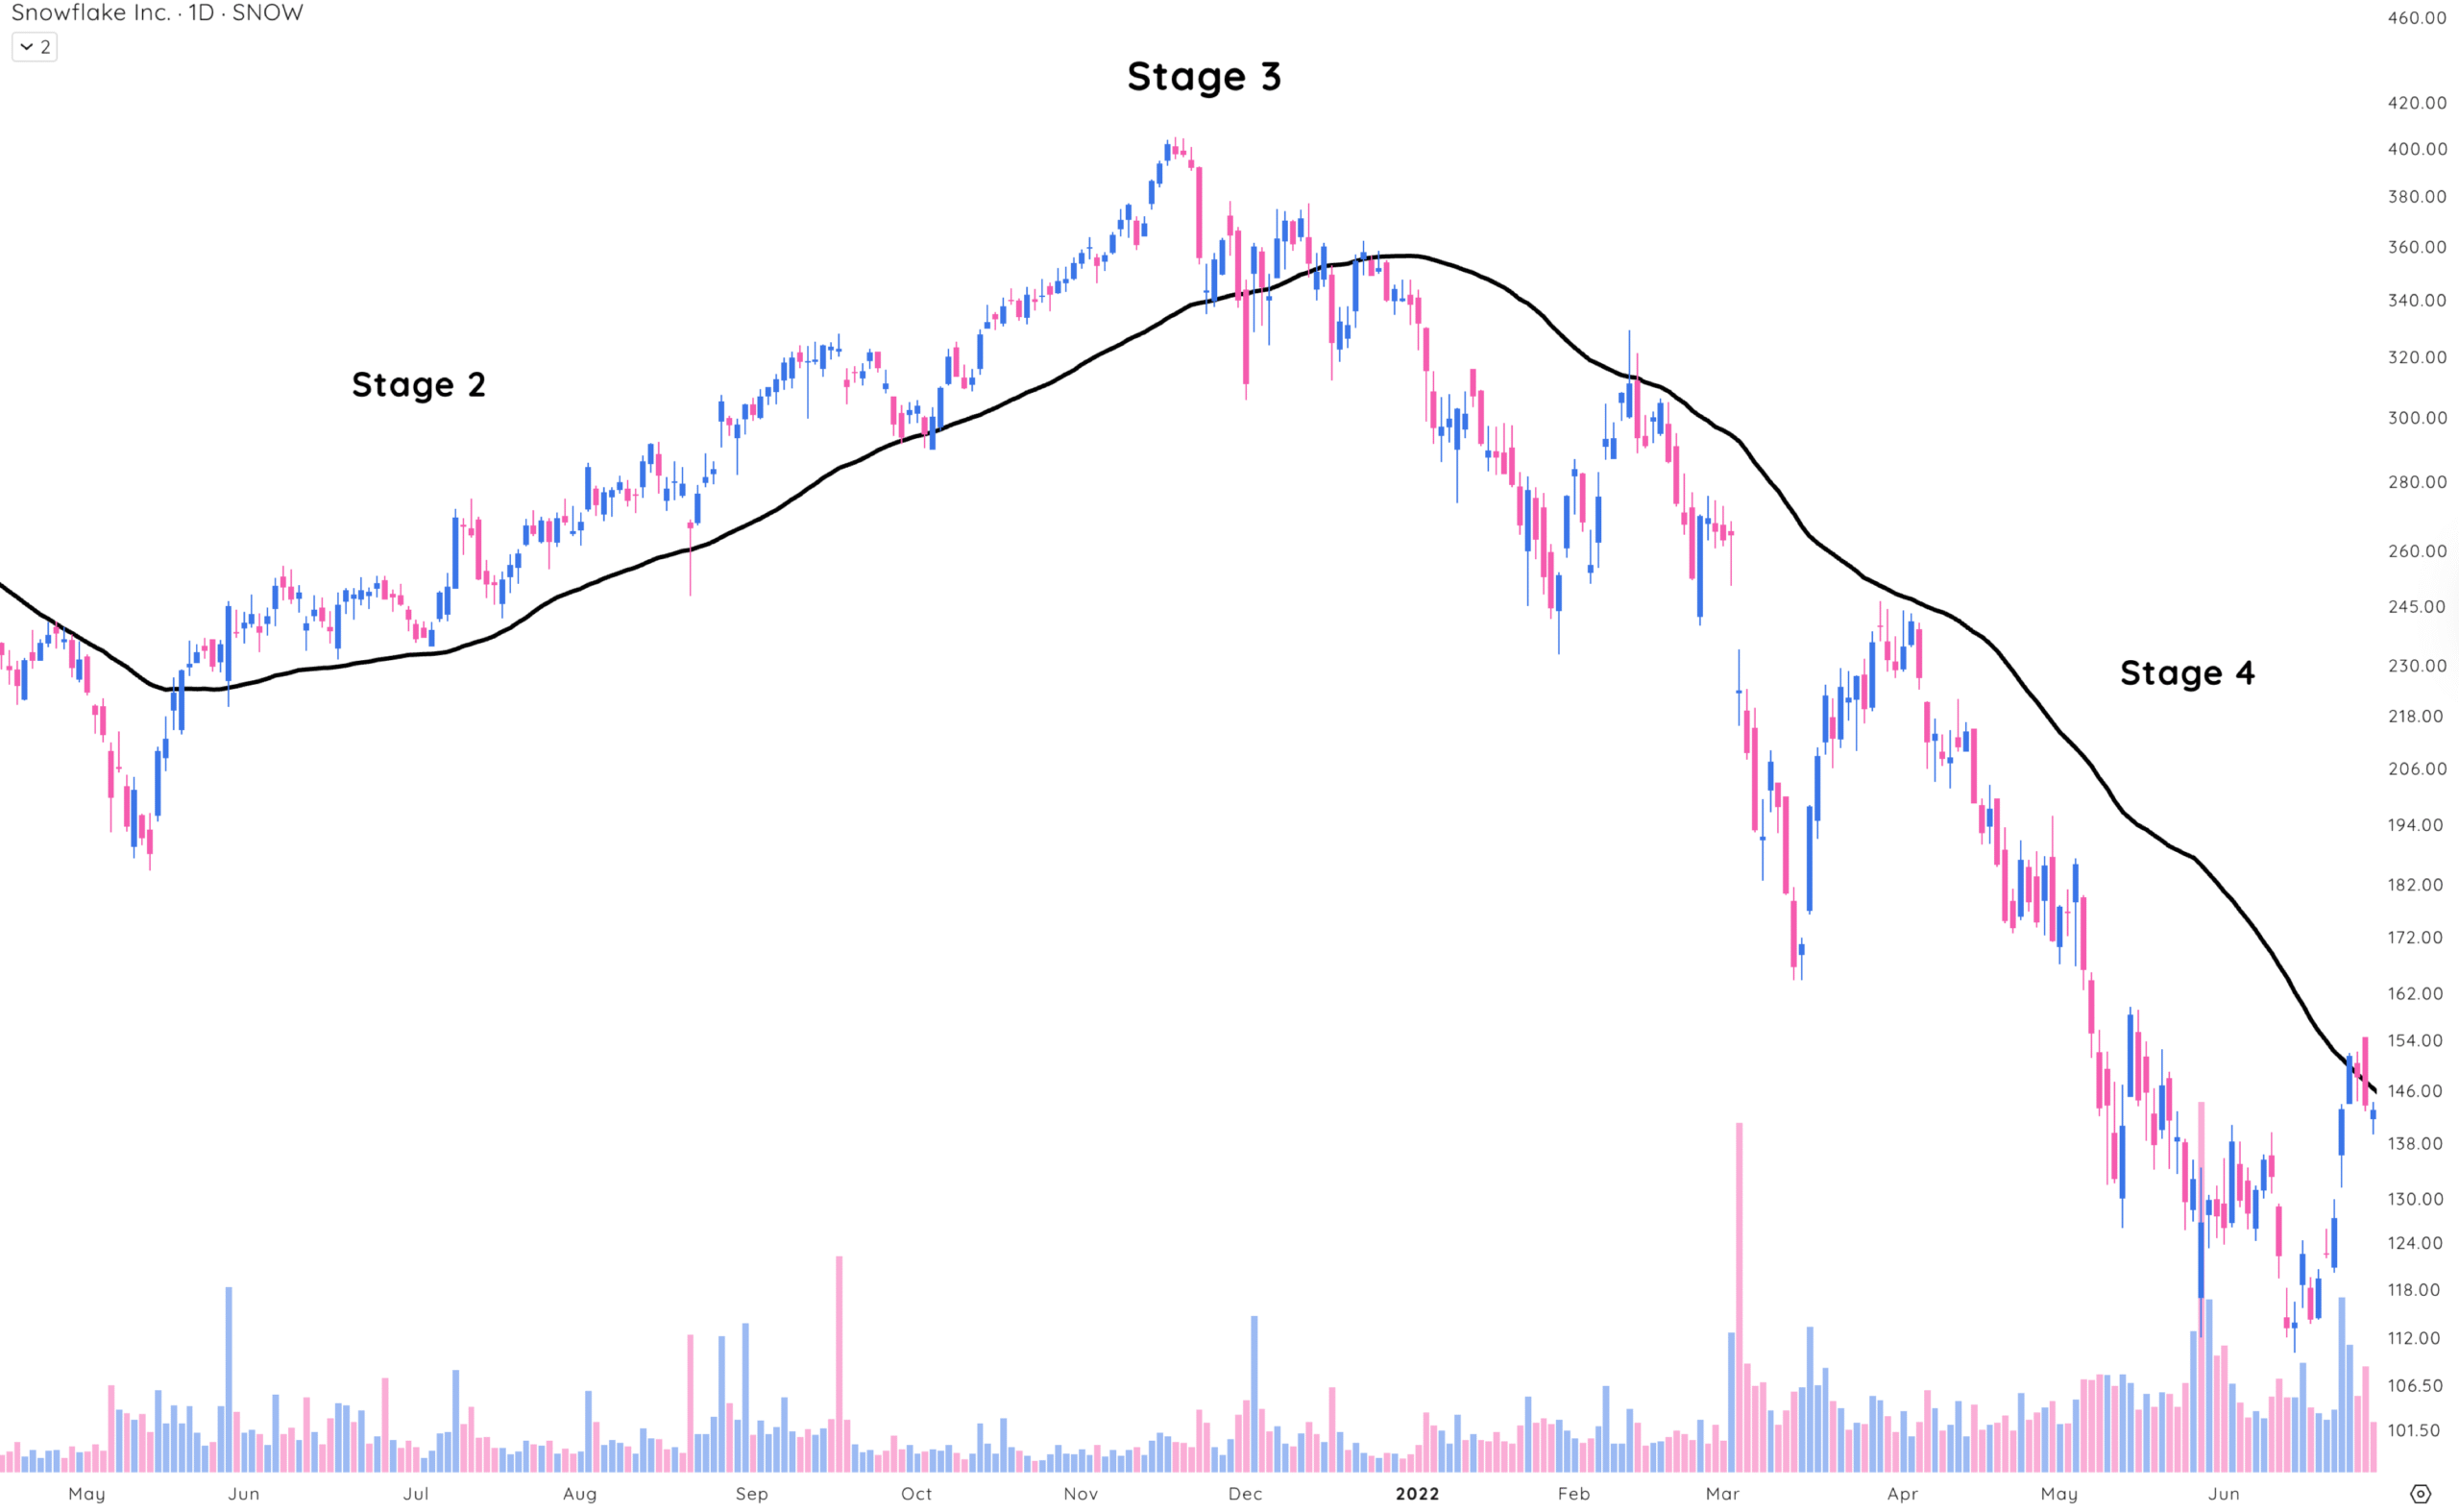
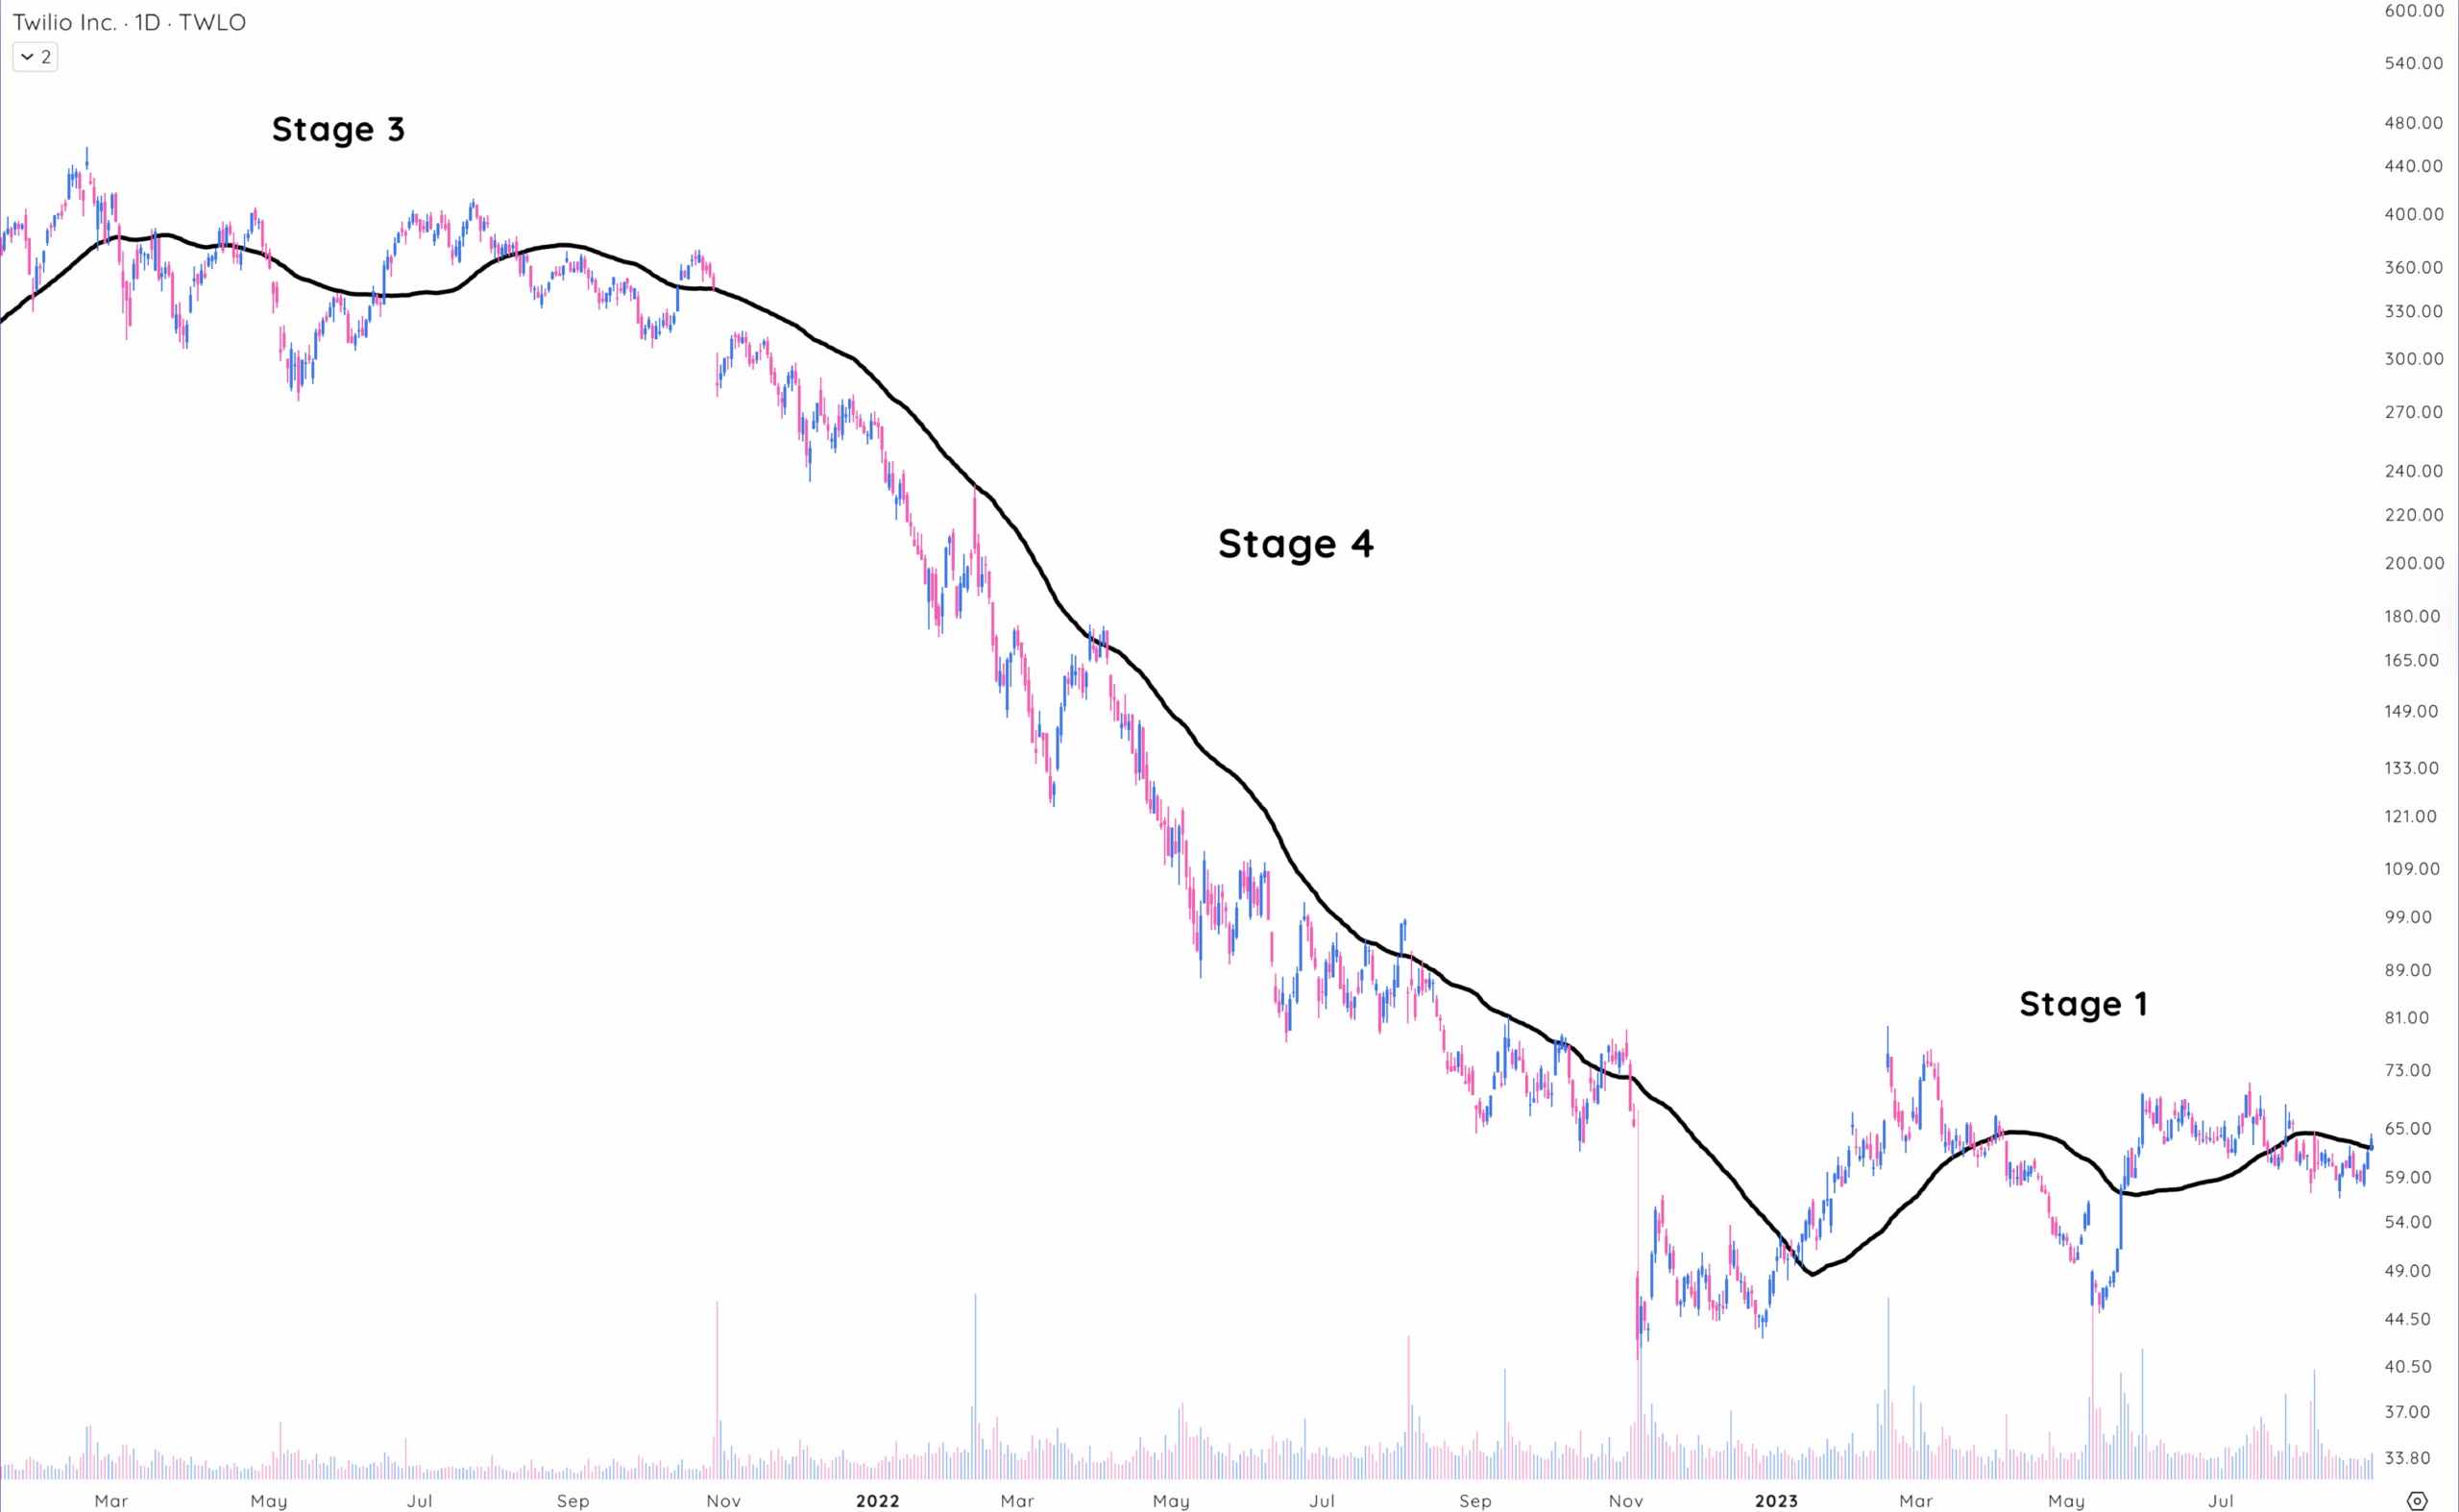
During his research, Stan Weinstein identified four clear phases that appear in every market cycle. The graphic below gives a simple overview of Stan Weinstein’s Stage Analysis Screener, where price action gets divided into four distinct stages.
- Stage 1: Basing Area
- Stage 2: Defined Uptrend above the rising 30-week Moving Average
- Stage 3: Topping Phase
- Stage 4: Defined Downtrend below the declining 30-week Moving Average
Stan’s original approach used weekly charts alongside the 30-week moving average. This MA roughly lines up with the 150-day simple moving average. As markets evolved, he updated his method – now placing more weight on the 50-day moving average as a key signal for any stock.
The main goal? To help traders identify the best entry and exit points by watching how the price behaves around key moving averages.
Stage 1: The Basing Area
Stage 1 kicks off after a stock’s downtrend starts losing steam. The sharp drops slow down, and prices begin to move sideways instead of falling further.
You’ll notice the 30-week, or 50-day, moving average flattening out, which shows that neither buyers nor sellers have the upper hand. This phase can stretch on for months, or even years, making it feel like the stock is stuck in neutral.
That’s why many traders avoid this stage altogether. It seems like “dead money,” where nothing exciting is happening. But under the surface, important groundwork is being laid.
During this time, weak hands are shaken out, and stronger, long-term investors quietly start building positions. Think of it like a storm passing and the skies finally settling calm.
The key here is to watch for signs of life. If the stock starts climbing above the 30-week or 50-day moving averages, that’s a big clue that momentum may be shifting. Volume may also start to increase slightly on up days.
These early signals often hint that a breakout into Stage 2 could be right around the corner. So while Stage 1 might look boring, smart traders keep it on their radar. It’s where the next big trend quietly begins to take shape.
Stage 2: The Advance Phase
This is the phase most traders dream about. In Stage 2, the stock breaks out of its base with strength, usually on heavy volume, and starts climbing consistently.
The 30-week, or 50-day, moving average turns upward, and the price stays above it most of the time.
Healthy pullbacks are normal here, but they’re usually followed by strong rebounds. That’s because institutions are often stepping in now, buying aggressively and pushing the price higher.
Stage 2 is your prime buying window. It’s when momentum is on your side and breakouts tend to follow through.
As long as the trend remains strong and the stock holds above key support levels, it pays to stay with the move, but don’t get complacent. Start paying attention to volume shifts or weakening rallies – they’re often the first signs that the trend is running out of steam.
Stage 3: Topping Formation
In Stage 3, the party starts to slow down and momentum fades. Price action becomes choppy and less predictable.
You’ll see more failed breakouts and deeper pullbacks. Volume patterns also start to shift – selling picks up on down days, while buying dries up on the rallies.
This phase often traps traders. The stock might still look strong on the surface, but underneath, supply is building.
Institutional investors may be quietly selling into strength, distributing shares while retail buyers are still chasing the trend. If you’ve ridden the stock up through Stage 2, this is the time to get cautious.
You might start taking profits or tightening your stop losses. Holding on too long here can turn a big win into a painful round trip.
A breakdown from Stage 3 often marks the beginning of a much steeper decline.
Stage 4: Decline
This is where things get ugly. Stage 4 is the downtrend phase – basically the opposite of Stage 2.
The stock breaks below key support levels, and moving averages start sloping downward. Rallies don’t last long and often get sold into quickly.
It’s tempting to think the stock is a bargain here because it’s “off the highs.” But buying during Stage 4 is like trying to catch a falling knife.
Even stocks that look cheap can drop another 30%, 50%, or more. And they often do. This is the stage where portfolios take the biggest hits, especially if traders refuse to cut losses or keep averaging down.
The best move? Step aside. Wait for signs that a new stage 1 base is forming, or play the short side of the trade.
How to Use the Stan Weinstein Stage Analysis Screener
.Deepvue’s Stage Analysis Screener makes it easy to spot stocks at any stage of the market cycle, whether you’re a momentum trader, a value investor, or somewhere in between. All you have to do is plug the stage you’re targeting into your screener, and it’ll filter stocks accordingly.
Screen for Stage 1 stocks if you’re looking for early signs of a turnaround. These stocks have typically gone through a big decline and are now forming new basing patterns. They’re not in an uptrend yet, but they’ve stopped falling, and that’s the first clue that a breakout could be coming.
Screen for Stage 2 stocks when you want to catch stocks already in confirmed uptrends. This is the sweet spot for most growth and momentum traders. These stocks have broken out of their bases and are now making higher highs and higher lows.
Screen for Stage 3 stocks if you’re hunting for potential short setups or want to avoid buying into exhaustion. These stocks have had a strong run but are now forming topping patterns. The uptrend is slowing, and distribution may be starting.
Screen for Stage 4 stocks to find stocks in confirmed downtrends. These are typically trending lower with consistent selling pressure. You can use these for short setups or just to make sure you avoid buying into a falling knife.
No matter what type of trader you are, it’s crucial to make sure the stock’s current stage matches your strategy. Using the stage analysis screener helps you stay aligned with the broader trend, so you’re not fighting the market.

Key Takeaways: Using the Stage Analysis Screener
Key takeaways: using the stage analysis screener
Using Stan Weinstein’s Stage Analysis Screener can help you stay on the right side of the market by identifying where each stock is in its trend cycle. Whether you’re looking to buy strength, spot reversals early, or avoid costly mistakes, this tool gives you a clear visual roadmap.
Here are the key points to remember:
- Every stock moves through four stages: basing, uptrend, topping, and downtrend. Knowing the current stage helps you align your trades with the trend—not against it.
- Stage 1 is the setup – a stock moves sideways after a big decline and starts forming a base.
- Stage 2 is your opportunity – the stock breaks out and trends upward, offering the best risk/reward for momentum traders.
- Stage 3 is the warning sign – price gets choppy, momentum fades, and distribution often begins.
- Stage 4 is the danger zone – the trend breaks down and losses can compound quickly if you’re not careful.
The stage analysis screener simplifies your process by showing which stocks are in each stage so you can focus on setups that fit your strategy.


