Last Updated:
September 5, 2025
What is a Momentum Stock?
In the fast-paced world of trading, momentum stocks are a go-to for investors chasing strong price moves. But what does that actually mean?
A momentum stock is one that shows a steady price movement in one direction, either up or down, over a period of time. These moves are usually driven by major catalysts like strong earnings reports, big product launches, or positive market news.
When momentum is bullish, prices keep climbing as more traders pile in. When it’s bearish, the stock can keep falling for the same reason – traders reacting to the trend.
Think of momentum stocks as the “hot” stocks of the current market cycle. They gain speed as more people notice them, like a snowball rolling downhill, or uphill in this case.
Momentum stocks are exactly what they sound like – They move quickly. To look for stocks that will quickly advance, we can look at two different calculations:
- Average True Range (ATR)
- Average Daily Range (ADR)
By looking at ATR and ADR, we can get a better understanding of how quickly (or slowly) the stock will move.
Why Trade Momentum Stocks?
Momentum trading is built on a simple idea: stocks that are already moving are likely to keep moving. Traders try to catch these moves early and ride the wave.
When you are looking to achieve superperformance, trading stocks with high ATR or ADR will move higher than their lower ATR or ADR peers.
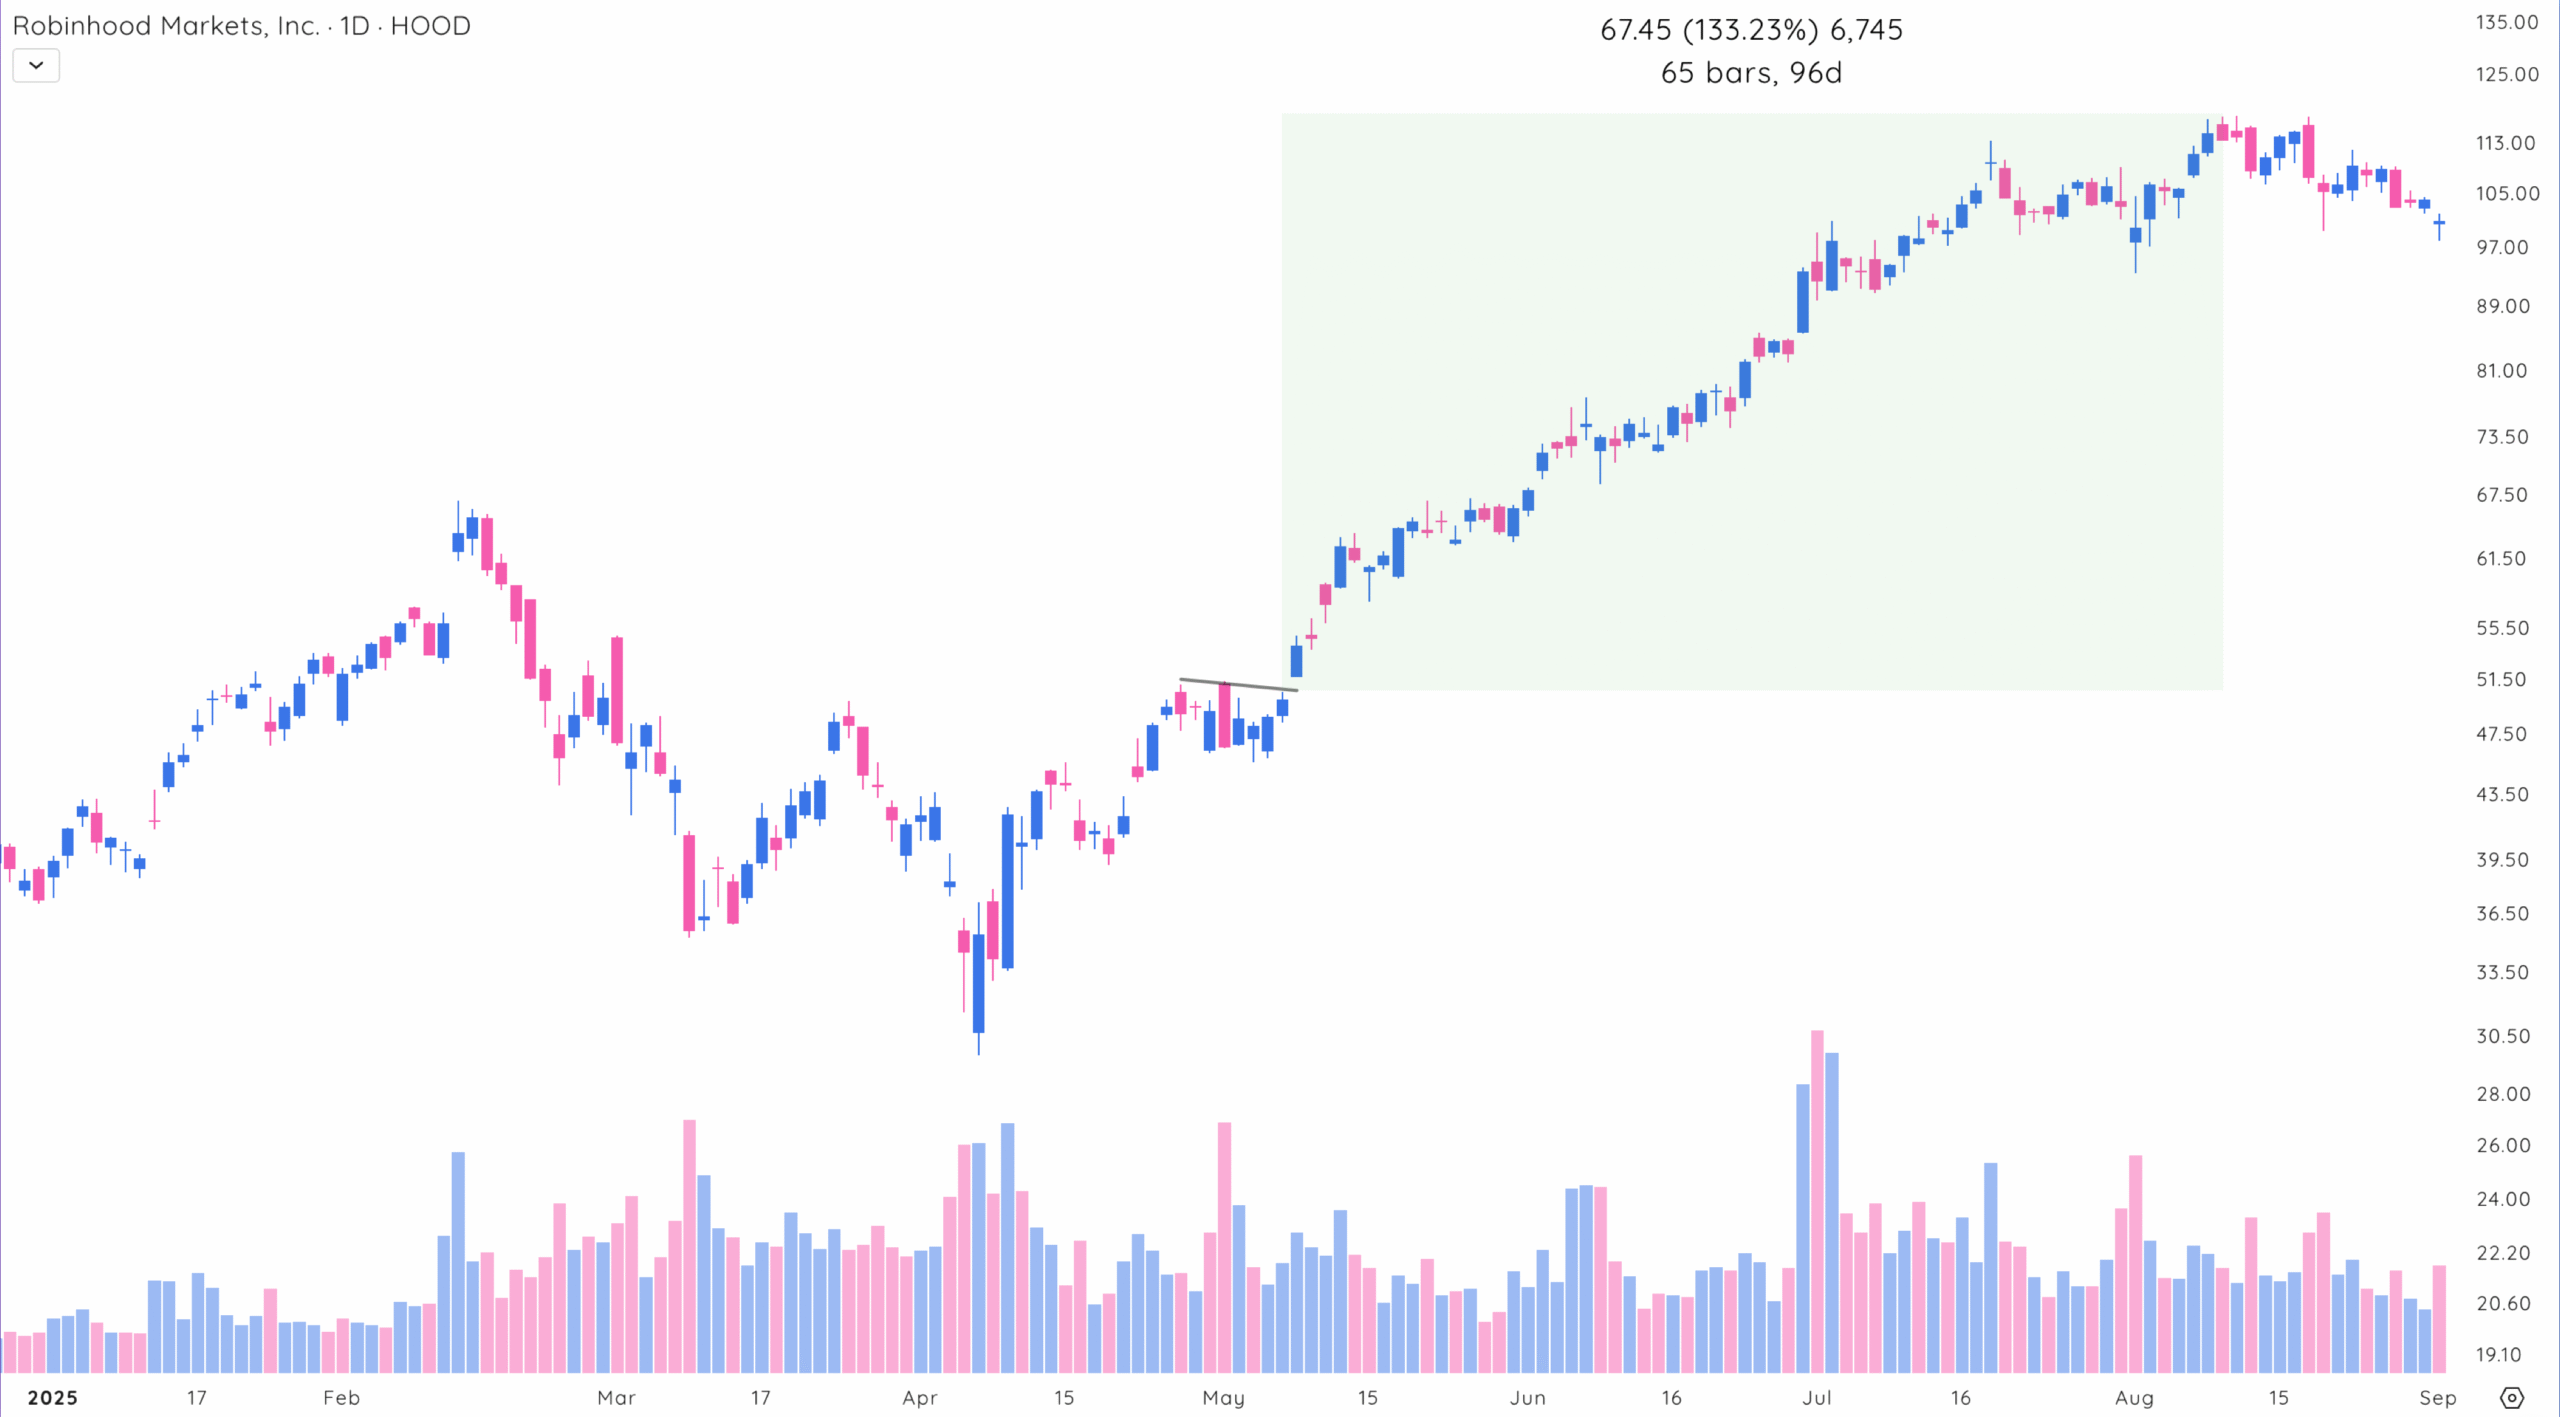
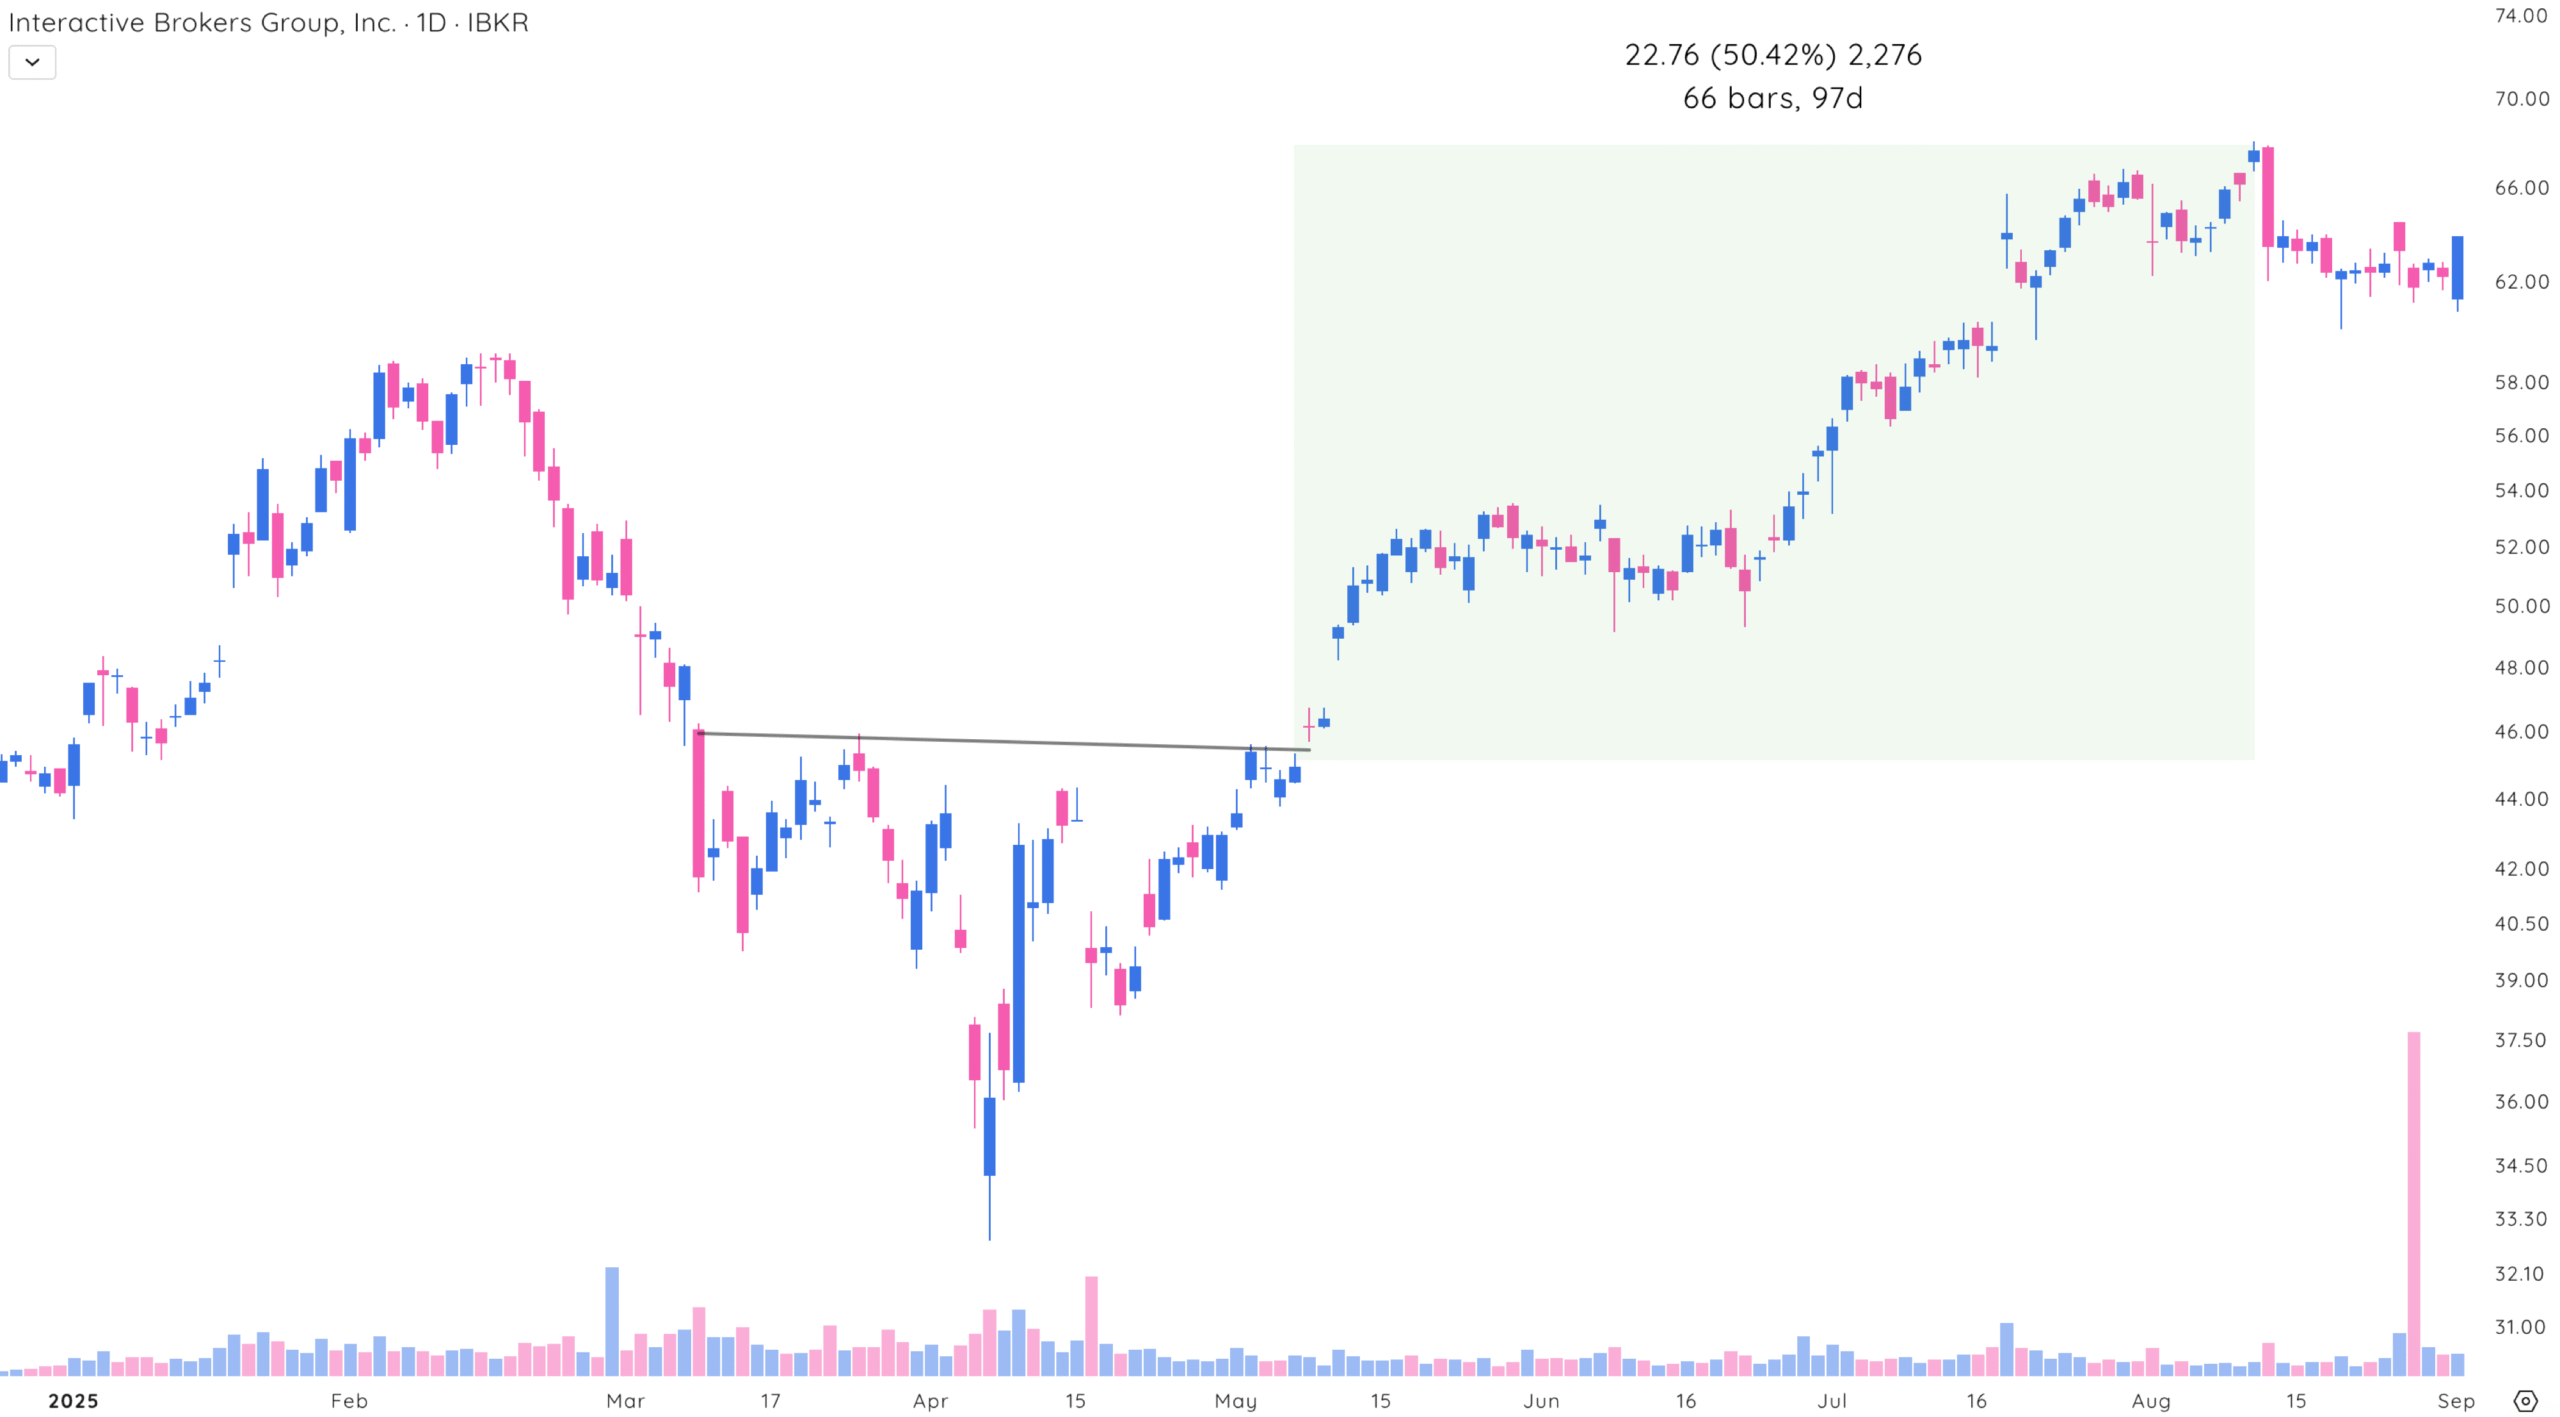
Let’s take a look at two similar stocks that are both brokerage accounts and compare their most recent moves.
HOOD, with an average ATR over 5% moved over 130% after a traditional base breakout.
In the same timespan, IBKR moved only 50% as it had an average ATR of around 3%.
The takeaway? Higher ATR often means bigger price moves.
Why High ATR Stocks Move Faster
The Average True Range (ATR) is a popular tool that helps traders measure a stock’s volatility. If you’re trading momentum, ATR is one of the most useful indicators you can have in your toolkit.
ATR is based on something called the true range. For each trading day, it looks at three values and uses the largest one:
- The difference between the current high and the current low.
- The absolute value of the current high minus the previous close.
- The absolute value of the current low minus the previous close.
This gives traders a clearer sense of the day’s actual price movement, especially if there were gaps between the previous day’s close and today’s open.
Once the true range is calculated for each day, ATR takes an average to smooth out the numbers. This average helps you see the stock’s typical volatility without being thrown off by random price spikes.
Keep in mind: ATR doesn’t tell you which direction a stock will move, but it gives you a solid idea of how far it might move. But when you’re trading momentum, knowing the size of the move is just as important as knowing where it might go.
How High ADR Stocks Show Momentum
While ATR looks at a stock’s total volatility (including gaps between sessions), ADR focuses on what happens within the intraday range – how much a stock typically moves from its daily high to its low.
High ADR stocks are those with large daily price swings. When a stock has a wide range between its daily high and low, it means there’s strong price volatility.
ADR is simple to calculate and even easier to understand. Here’s how it works:
- Find the daily range: Subtract the day’s low from the high (High – Low).
- Average the range: Add up the daily ranges over a set period and divide by the number of days.
A high ADR means the stock has strong intraday movement. That can be great for momentum trades, but it also means more risk. Here’s what you can do with that info:
- Identify active stocks that are worth watching
- Set realistic profit targets based on average price movement
- Place smarter stop-loss levels to manage risk without getting stopped out too early
Screening for High ATR Stocks
Using Deepvue, you can easily screen for high ATR stocks by setting filters based on percentage or dollar value.
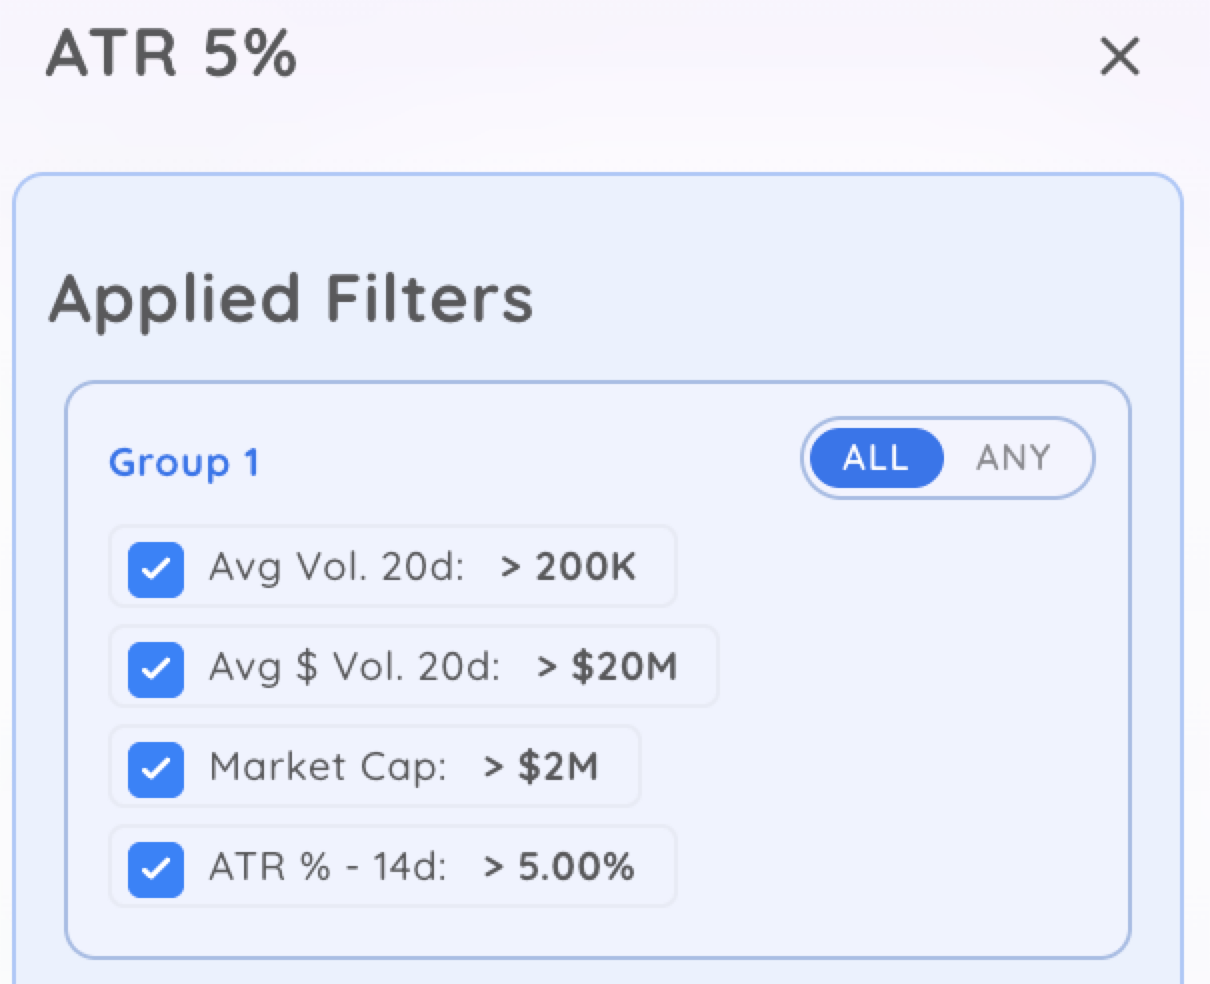
Add an ATR% filter along with basic liquidity criteria. This helps you zero in on fast-moving, tradable stocks.
Screening for High ADR Stocks
You can also screen for high ADR stocks using the same method. Just layer ADR on top of your existing screeners.
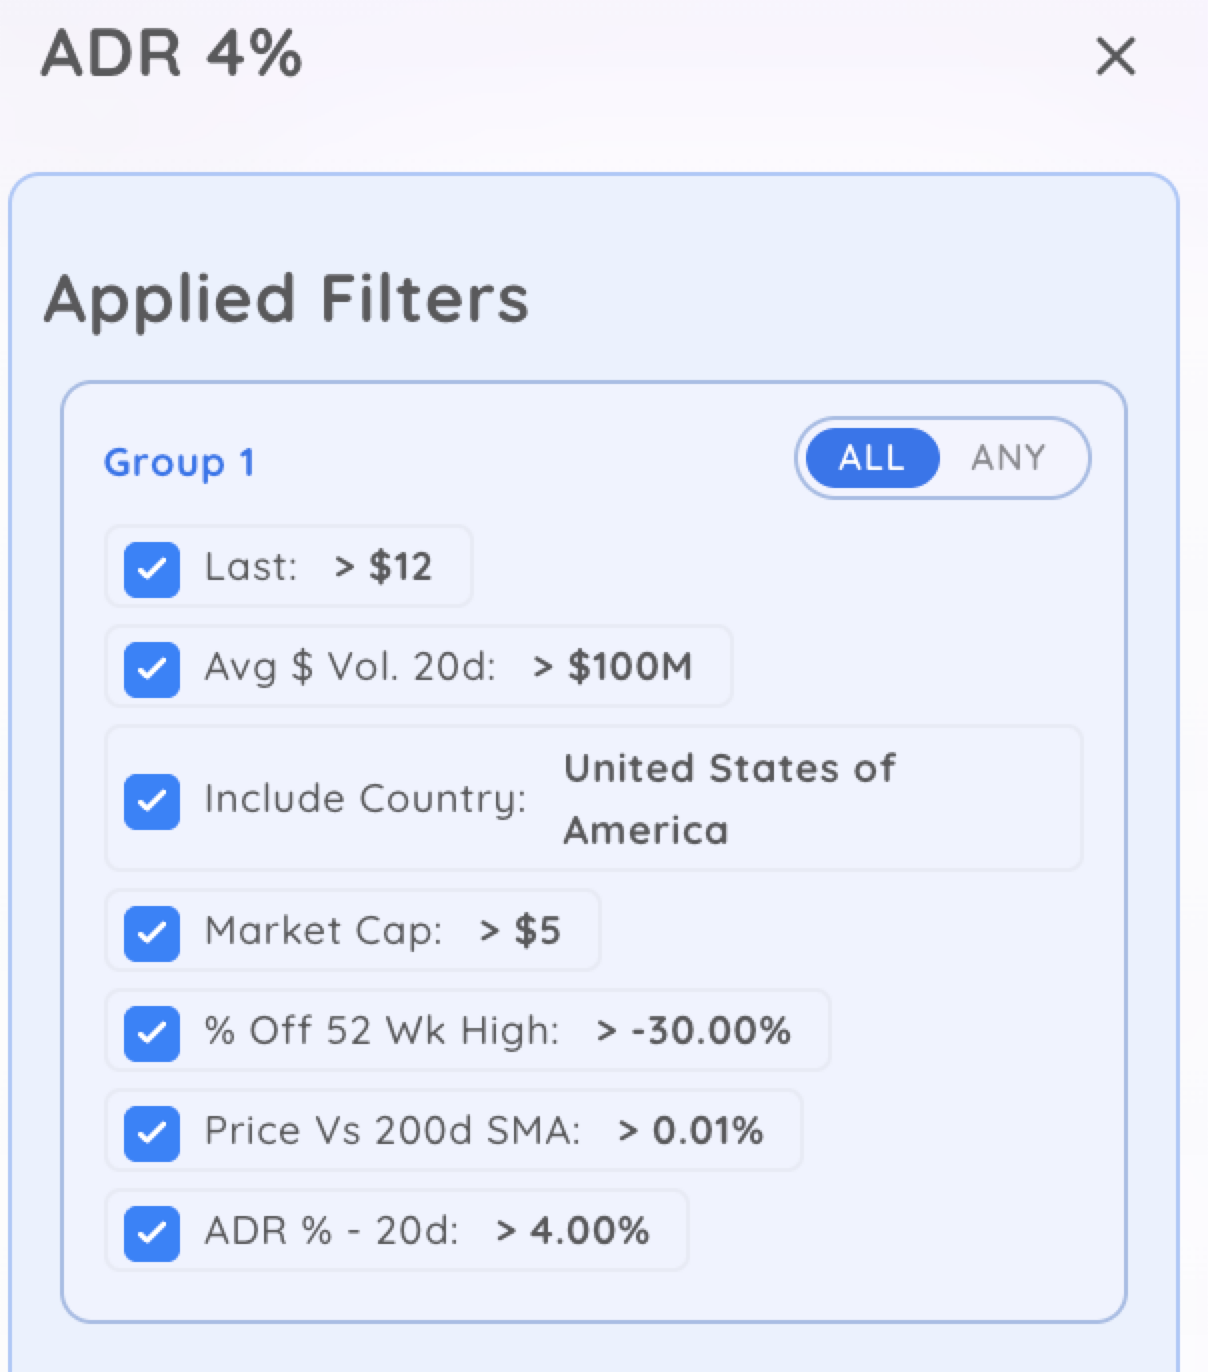
Looking for stocks in strong uptrends? Add an ADR filter to find the ones making bigger moves during the day.
Risks of Using ATR and ADR in Momentum Trading
Momentum trading can be exciting and rewarding, especially when using tools like Average True Range (ATR) and Average Daily Range (ADR) to spot opportunities. But with big price moves come big risks—and relying too much on these tools without understanding their limits can lead to costly mistakes.
Here are the key risks to keep in mind:
1. Volatility cuts both ways
High ATR or ADR values tell you a stock moves a lot, which is great for profit potential, but also means bigger losses if the trade goes against you. A stock might normally move $5 a day, but unexpected news could trigger a $10 drop that blows past your stop-loss.
Remember, ATR and ADR are based on past data. They won’t protect you from sudden price spikes or news-driven moves.
2. False breakouts are common
Momentum traders often chase breakouts, but not every breakout holds. A stock with a high ADR might push past resistance, only to reverse quickly and trap you in a bad position.
Use ATR and ADR to guide your setup, but confirm trades with other aspects of your trading strategy before jumping in.
3. Over-relying on indicators
ATR and ADR are helpful, but they don’t tell the full story. Some traders set stop-losses or profit targets based only on these metrics, ignoring market conditions, upcoming earnings, or technical patterns.
Treat ATR and ADR as part of a bigger picture. They measure volatility, not direction or momentum strength.
4. Chasing the wrong trades
Just because a stock has a high ADR doesn’t mean it’s a good trade. Jumping into volatile stocks late in a move often leads to buying the top or selling the bottom. And overtrading every “hot” stock can rack up fees and frustration.
Look for strong trends backed by real catalysts, not just big daily moves.
5. External market shocks
ATR and ADR can’t predict the impact of interest rate changes, geopolitical news, or market-wide selloffs. A perfectly set trade can still go south fast when the broader market shifts.
Always factor in the bigger picture – watch news and macro conditions alongside your technical setups.
6. Emotional decision-making
Momentum trading is fast-paced. Big swings can mess with your emotions, leading to early exits, revenge trades, or holding losers too long. ATR and ADR won’t help if you can’t stick to your plan.
Set clear rules based on your analysis and follow them. The data only works if you stay disciplined.
Final Thoughts: Maximize Returns With High ATR and ADR Stocks
Momentum stocks can offer big opportunities if you know how to spot and manage them. Using tools like ATR and ADR gives you a clearer picture of how fast a stock can move, helping you make better decisions.
But remember—they’re just part of the puzzle. Combine them with a sound trading plan, solid risk management, and a calm mindset. That’s how you stay in the game long enough to catch the big winners.
If you’re just getting started, practice using ATR and ADR to trade slower-moving stocks before trading more volatile stocks. Get comfortable identifying setups before risking big money.
Over time, you’ll get a feel for which moves have real strength and which ones are just noise. And most importantly, don’t chase every flashy stock.
The best momentum trades usually come from clear setups, real catalysts, and clean technical patterns. Patience pays.
So the next time you see a stock moving fast, check the ATR and ADR. It might just help you decide if it’s worth the ride or if it’s better to wait for the next wave.


