What are stock candlestick patterns?
Candlestick patterns are visual signals that show how price moves during a specific period, whether that’s one day, one week, or 15 minutes. Each candlestick represents four key pieces of data: where the price opened, where it closed, and the highest and lowest points it reached during that time.
But candlesticks aren’t just numbers in a box – they’re like snapshots of market psychology. They show you how buyers and sellers reacted in real time.
With just a glance, you can figure out whether the market is strong, weak, or uncertain.
- The body shows the difference between the opening and closing prices. A blue body means the price went up; a pink one means it went down.
- The wicks and shadows show the highest and lowest prices during the period.
- A long wick on top might mean buyers tried to push the price higher, but sellers took over and drove it back down.
- A long shadow on the bottom could signal strong buying pressure after sellers pushed the price lower.
These clues help you read the emotional tug-of-war happening behind the scenes, like fear, greed, hesitation, or conviction.
As you study more, you’ll start recognizing specific candlestick patterns that hint at future price movement. These patterns, like the hammer, engulfing, or kicker, can signal potential breakouts, reversals, continued strength, or periods of indecision.
Once you know how to spot these, you can anticipate market moves instead of reacting late. That means stronger entries, better exits, and more confidence in your trading strategy.
Why candlestick patterns matter in trading
If you’re serious about trading, learning candlestick patterns is essential. These patterns go beyond just reading a chart – they give you a front-row seat to the tug-of-war between supply and demand.
Every candlestick tells a short story about what happened during a specific time period: who had control, who lost it, and whether momentum might be shifting. When several candlesticks form certain patterns, they can reveal powerful clues about where the price could head next.
Take the hammer candlestick, for example. This single candlestick shows that sellers tried to push the price down, but buyers stepped in and pushed it back up, signaling a potential reversal from bearish to bullish. Or the bullish engulfing candlestick pattern, which shows buyers overpowering sellers after a downtrend, often hinting at a strong upward move.
These candlestick patterns give you:
- Clear entry signals: They help you decide when to jump in, so you’re not guessing or chasing.
- Early warning signs of reversals: You can get out of bad trades before they turn worse.
- Better risk management: By placing smarter stop-loss levels and understanding the context of each move, you can protect your capital more effectively.
Candlestick patterns help you trade with your eyes open. They speed up your analysis, sharpen your decision-making, and give you the confidence to act when the market gets volatile.
They’re not magic, but they’re a huge edge when used with discipline and context.
Understanding engulfing patterns
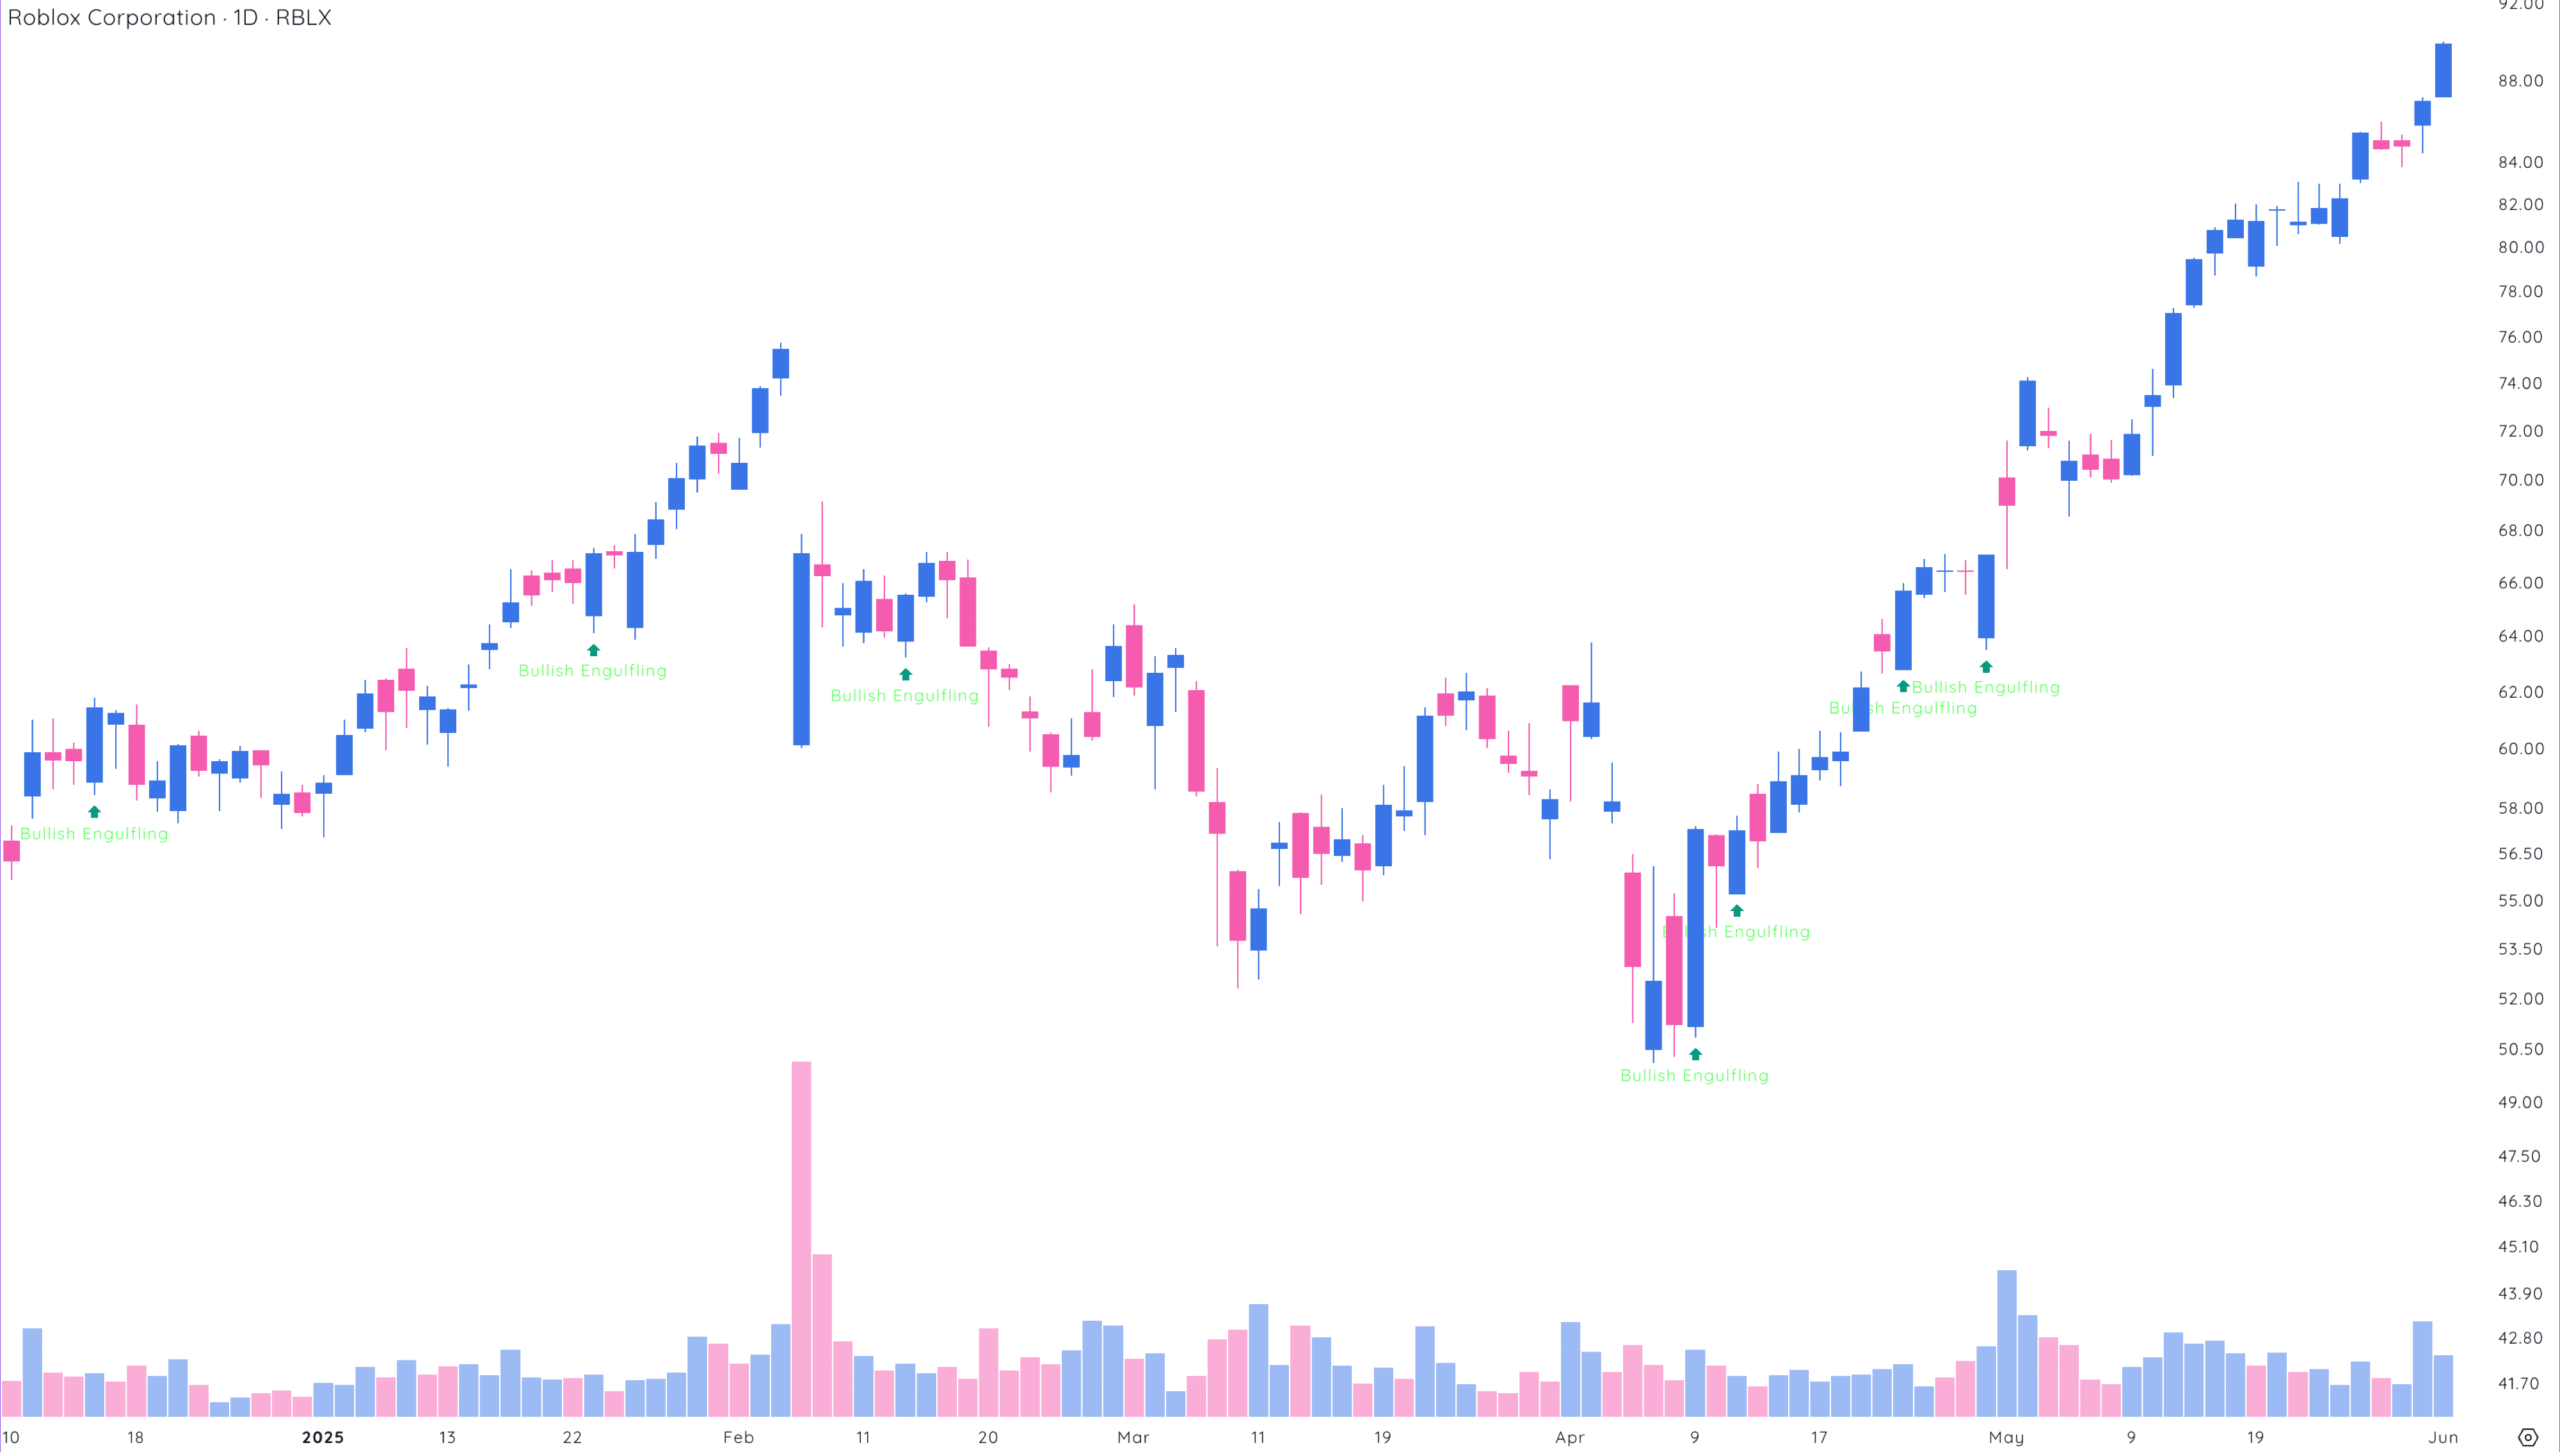
Bullish engulfing pattern
A bullish engulfing pattern is a popular candlestick pattern that signals a potential reversal in a downtrend. It forms when a small pink candle (where the price closes lower than it opened) is followed by a much larger blue candle (where the price closes higher than it opened).
The key is that the blue candle completely “engulfs” the body of the pink one.
This pattern suggests that selling pressure is fading and buying pressure is taking over. In other words, the bears are losing ground and the bulls are stepping in. That’s why traders often use this as a buy signal.
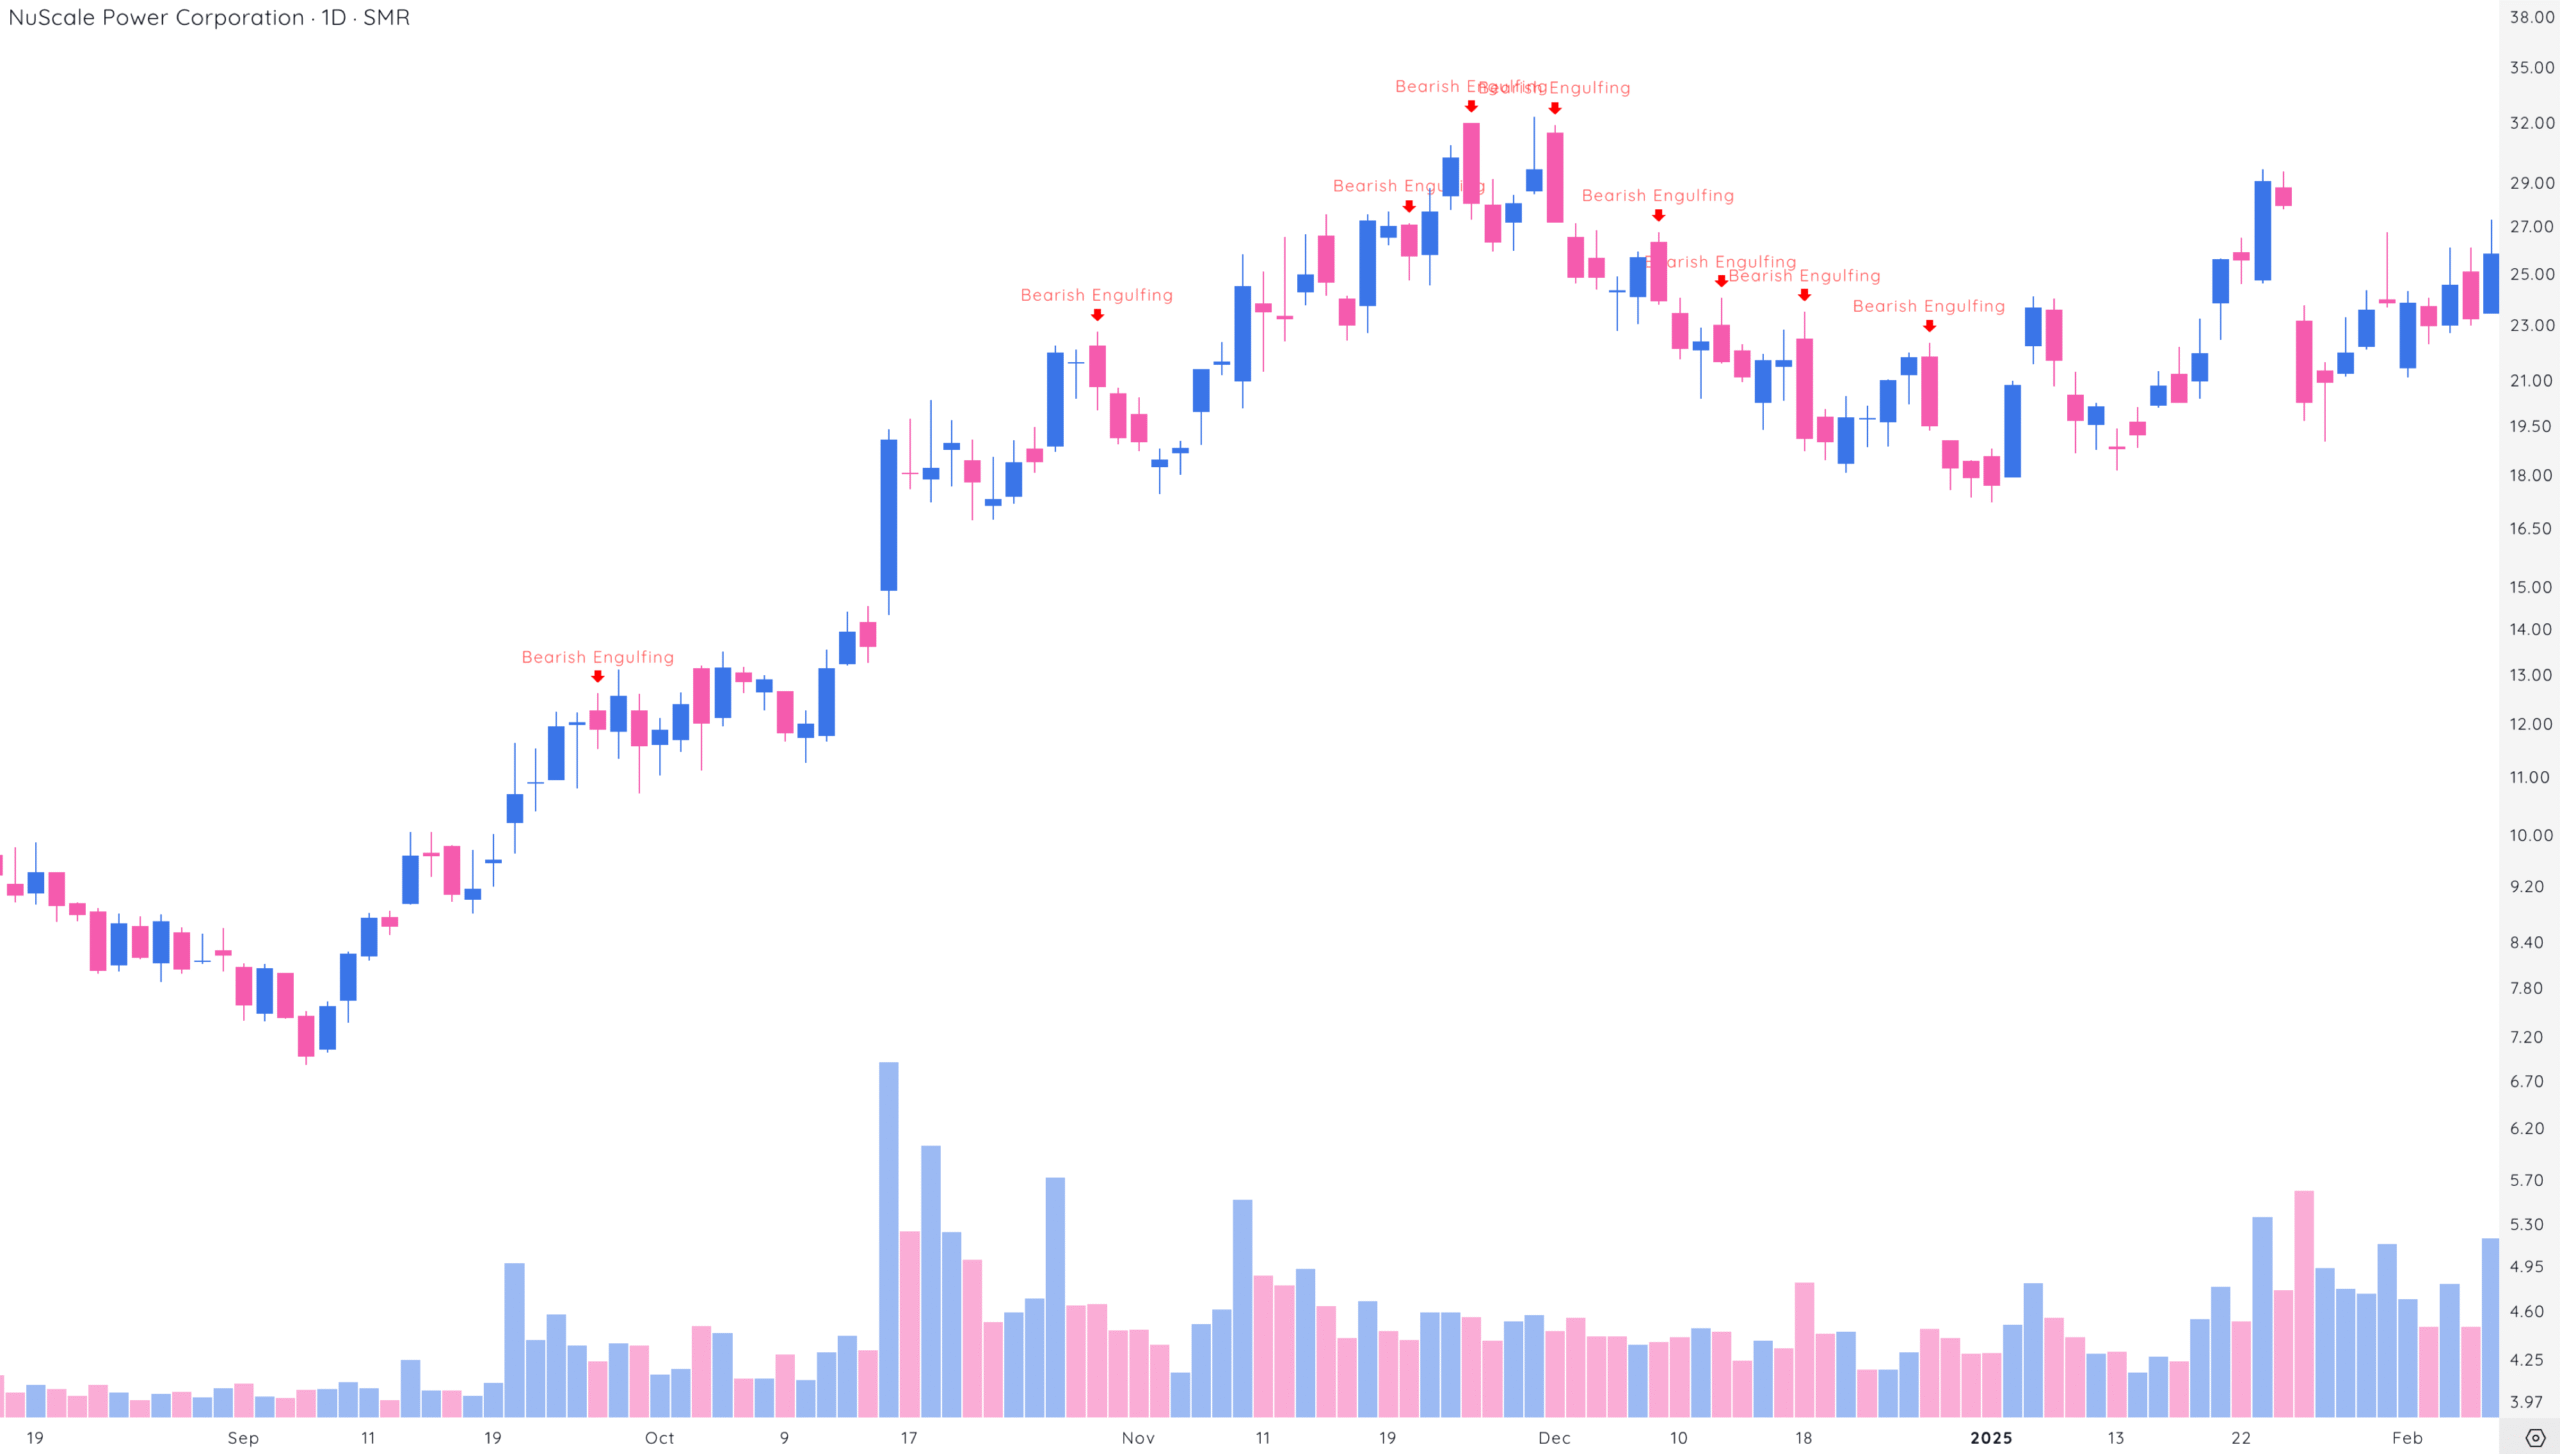
Bearish engulfing pattern
A bearish engulfing pattern is the opposite of the bullish version. It signals a possible reversal during an uptrend.
This happens when a small blue candle is followed by a large pink candle that completely covers the blue one’s body.
This pattern suggests that bulls are losing control and bears are stepping in. Traders often view this as a sign to consider shorting a stock or exiting a long position.
Both bullish and bearish engulfing patterns can help you understand shifts in market sentiment. But they shouldn’t be used in isolation.
For better results, combine them with other technical indicators, like trend lines, moving averages, and higher timeframe support and resistance.
Think of engulfing patterns as part of the bigger puzzle. They give you clues, but it’s up to you to see how they fit into the overall market picture.
Bullish hammer and shooting star patterns
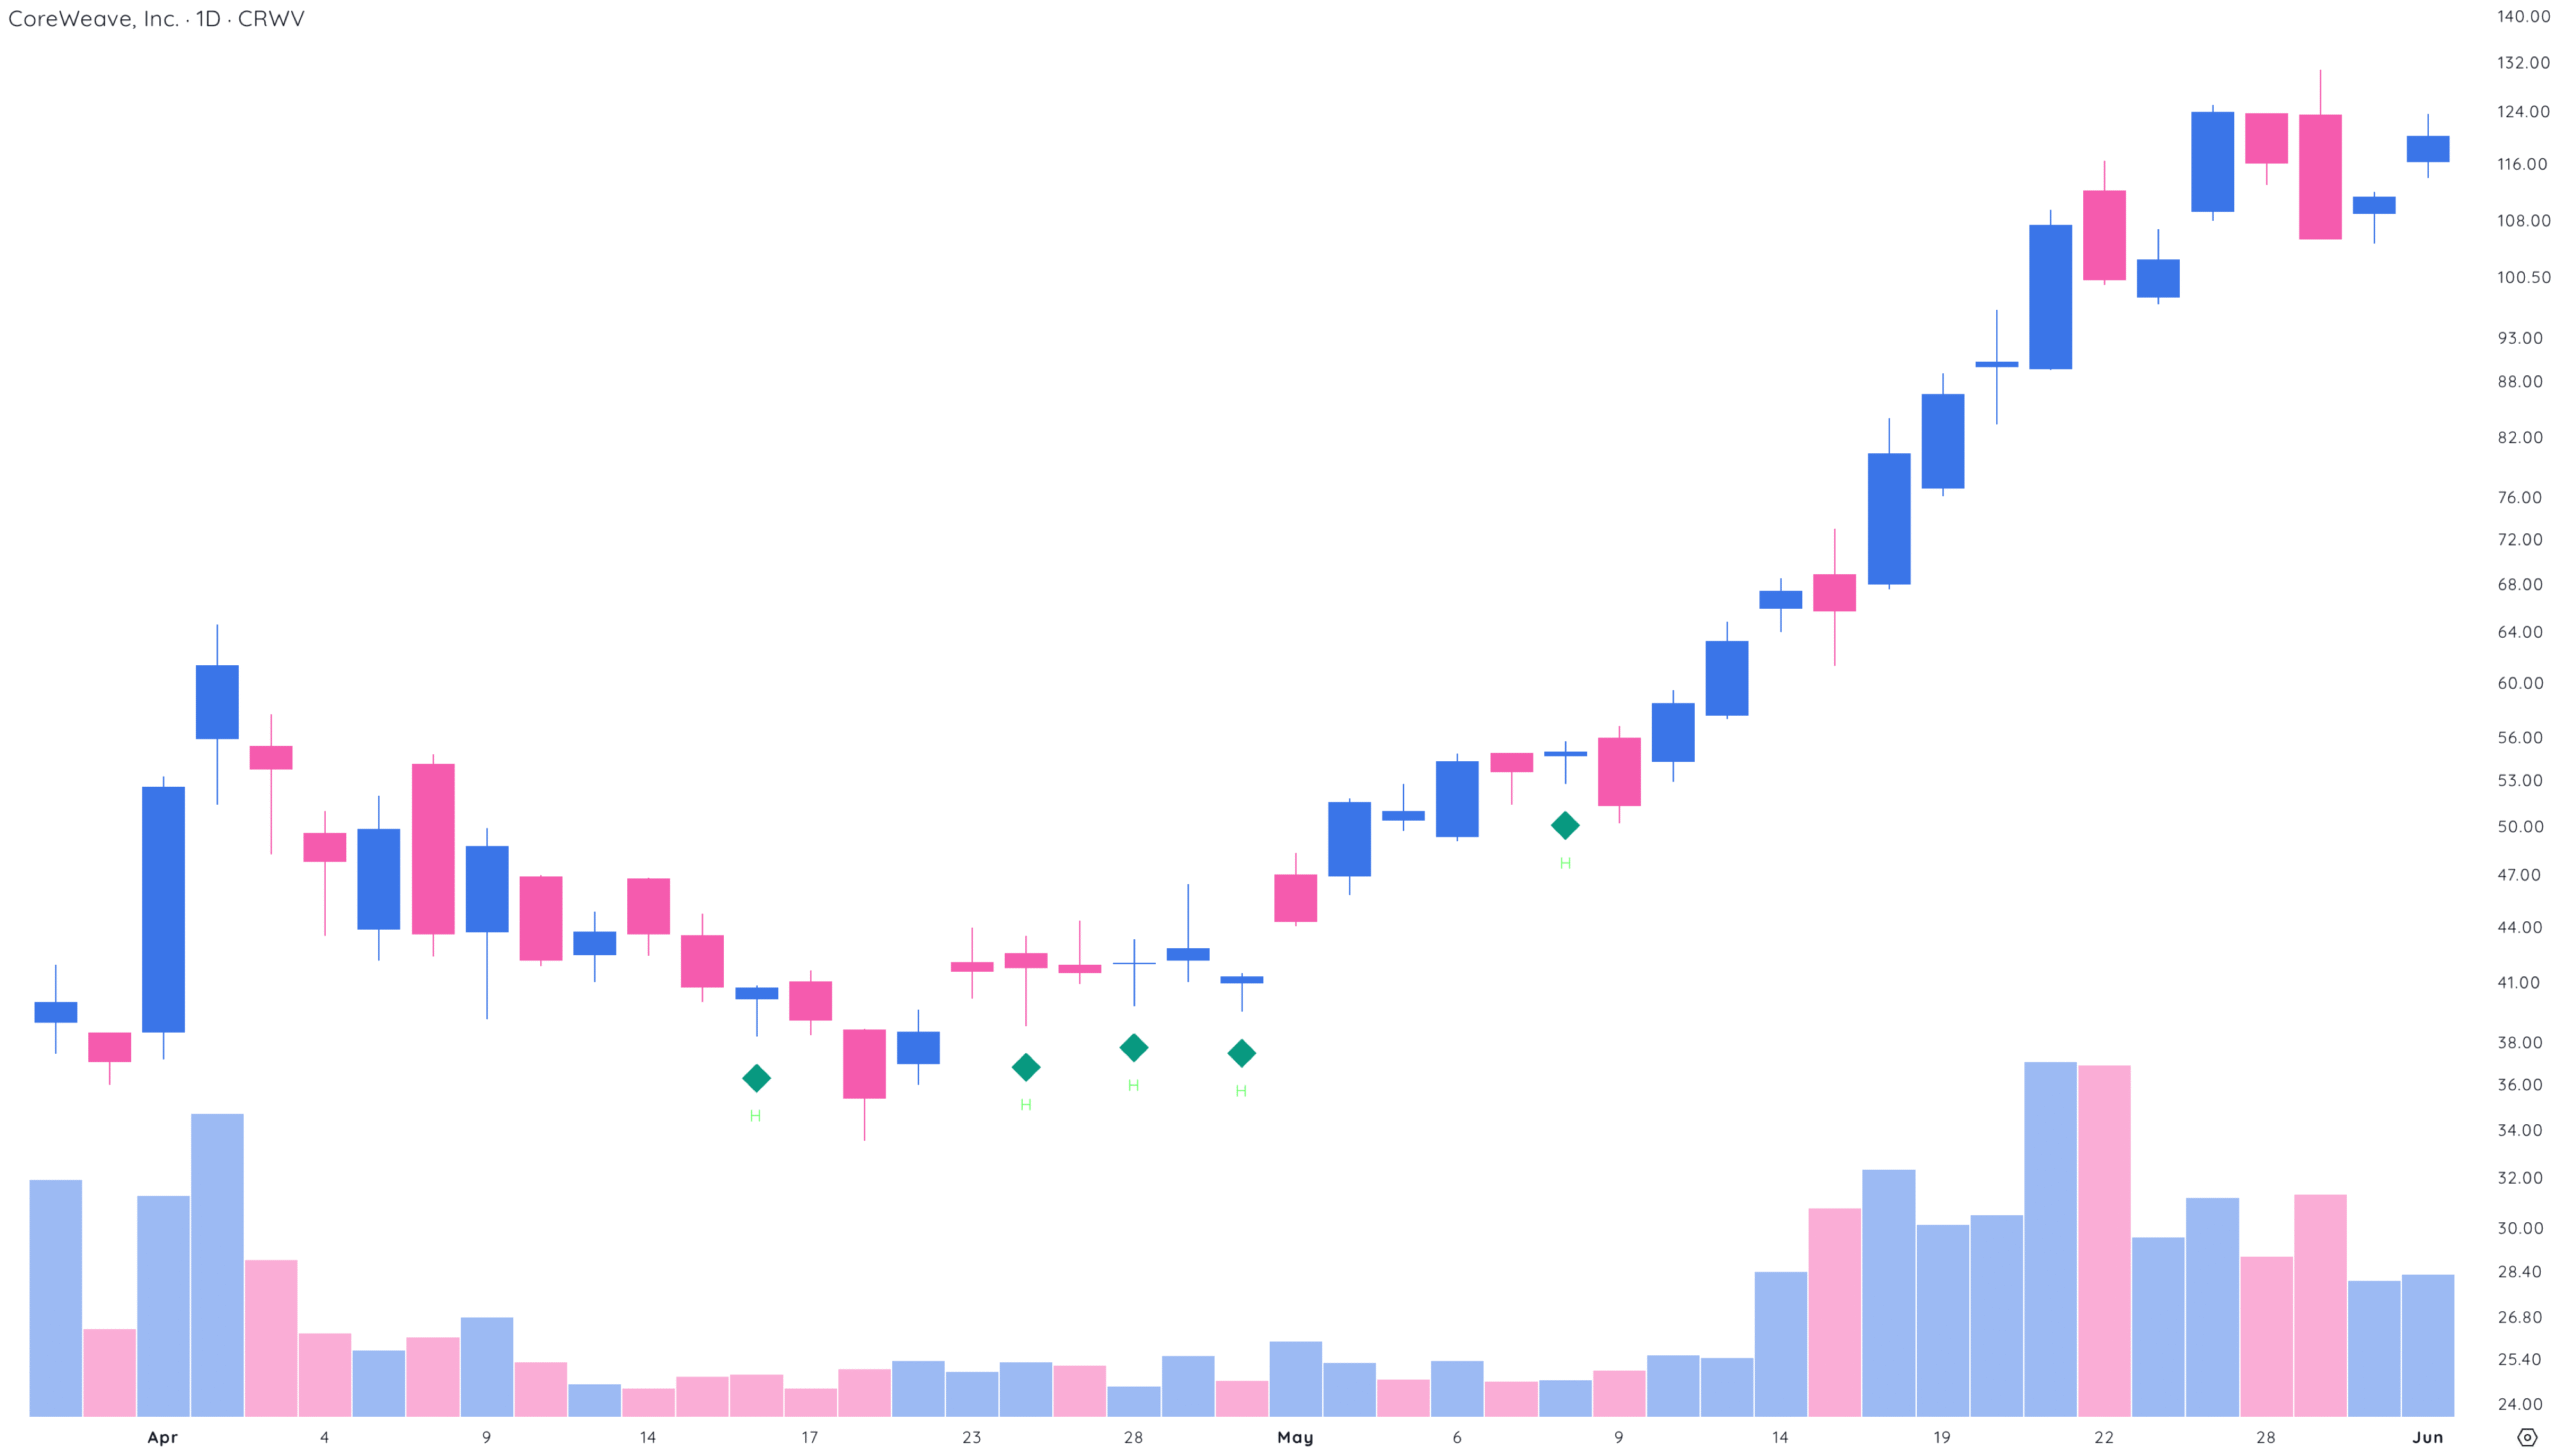
Bullish hammer candlestick
The hammer candlestick is a bullish reversal pattern that appears after a downtrend. It signals that sellers were strong earlier in the session, but buyers stepped in and pushed the price back up before the close.
This shift in momentum can be a sign that the downtrend may be coming to an end.
A hammer looks like a hammer — a small body near the top of the candle and a long lower shadow. It often has little to no upper wick.
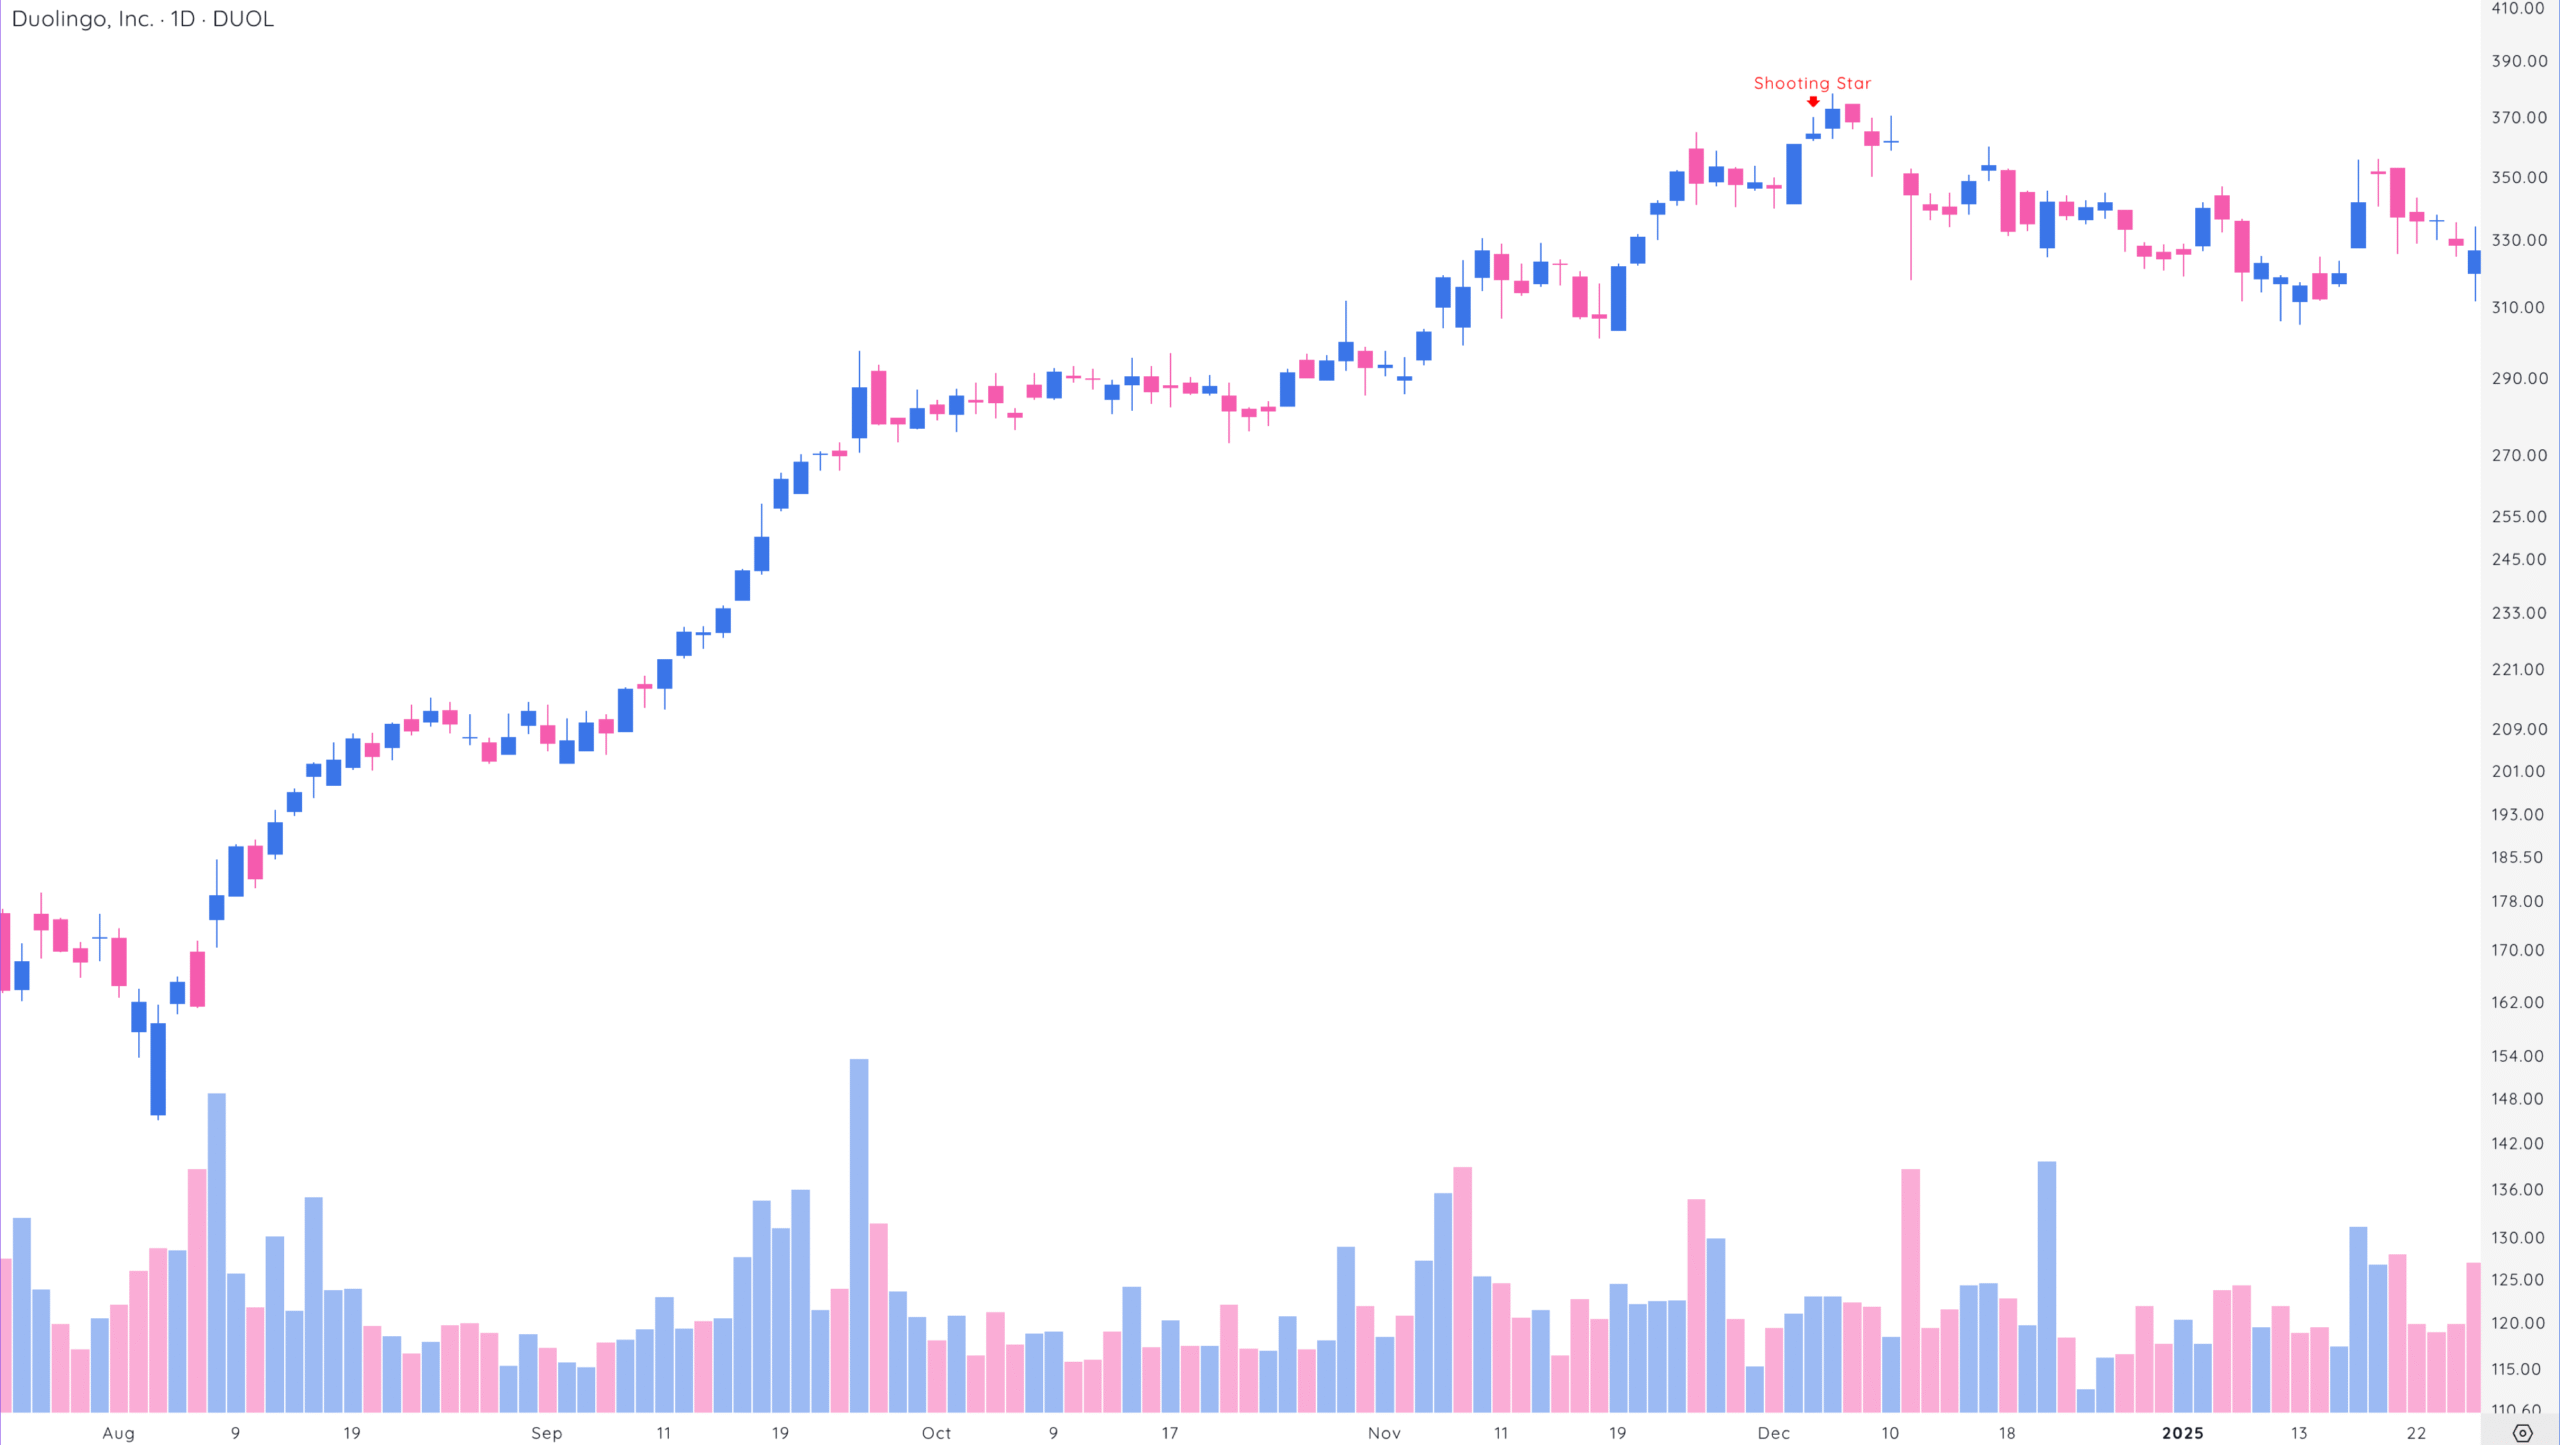
Shooting star candlestick
The shooting star is a bearish reversal pattern that shows up near the top of an uptrend. It suggests that buyers tried to push the price higher, but sellers took over and pushed it back down before the candle closed.
The result is a candlestick with a small real body at the bottom of the range and a long upper wick — it looks like a star falling from the sky.
Both the hammer and shooting star are reliable candlestick signals for spotting potential reversals. The hammer suggests a bottom may be forming, while the shooting star warns of a possible top.
Always use confirmation and proper risk management, and try combining candlestick analysis with other tools.
Bullish and bearish kicker patterns
Bullish kicker
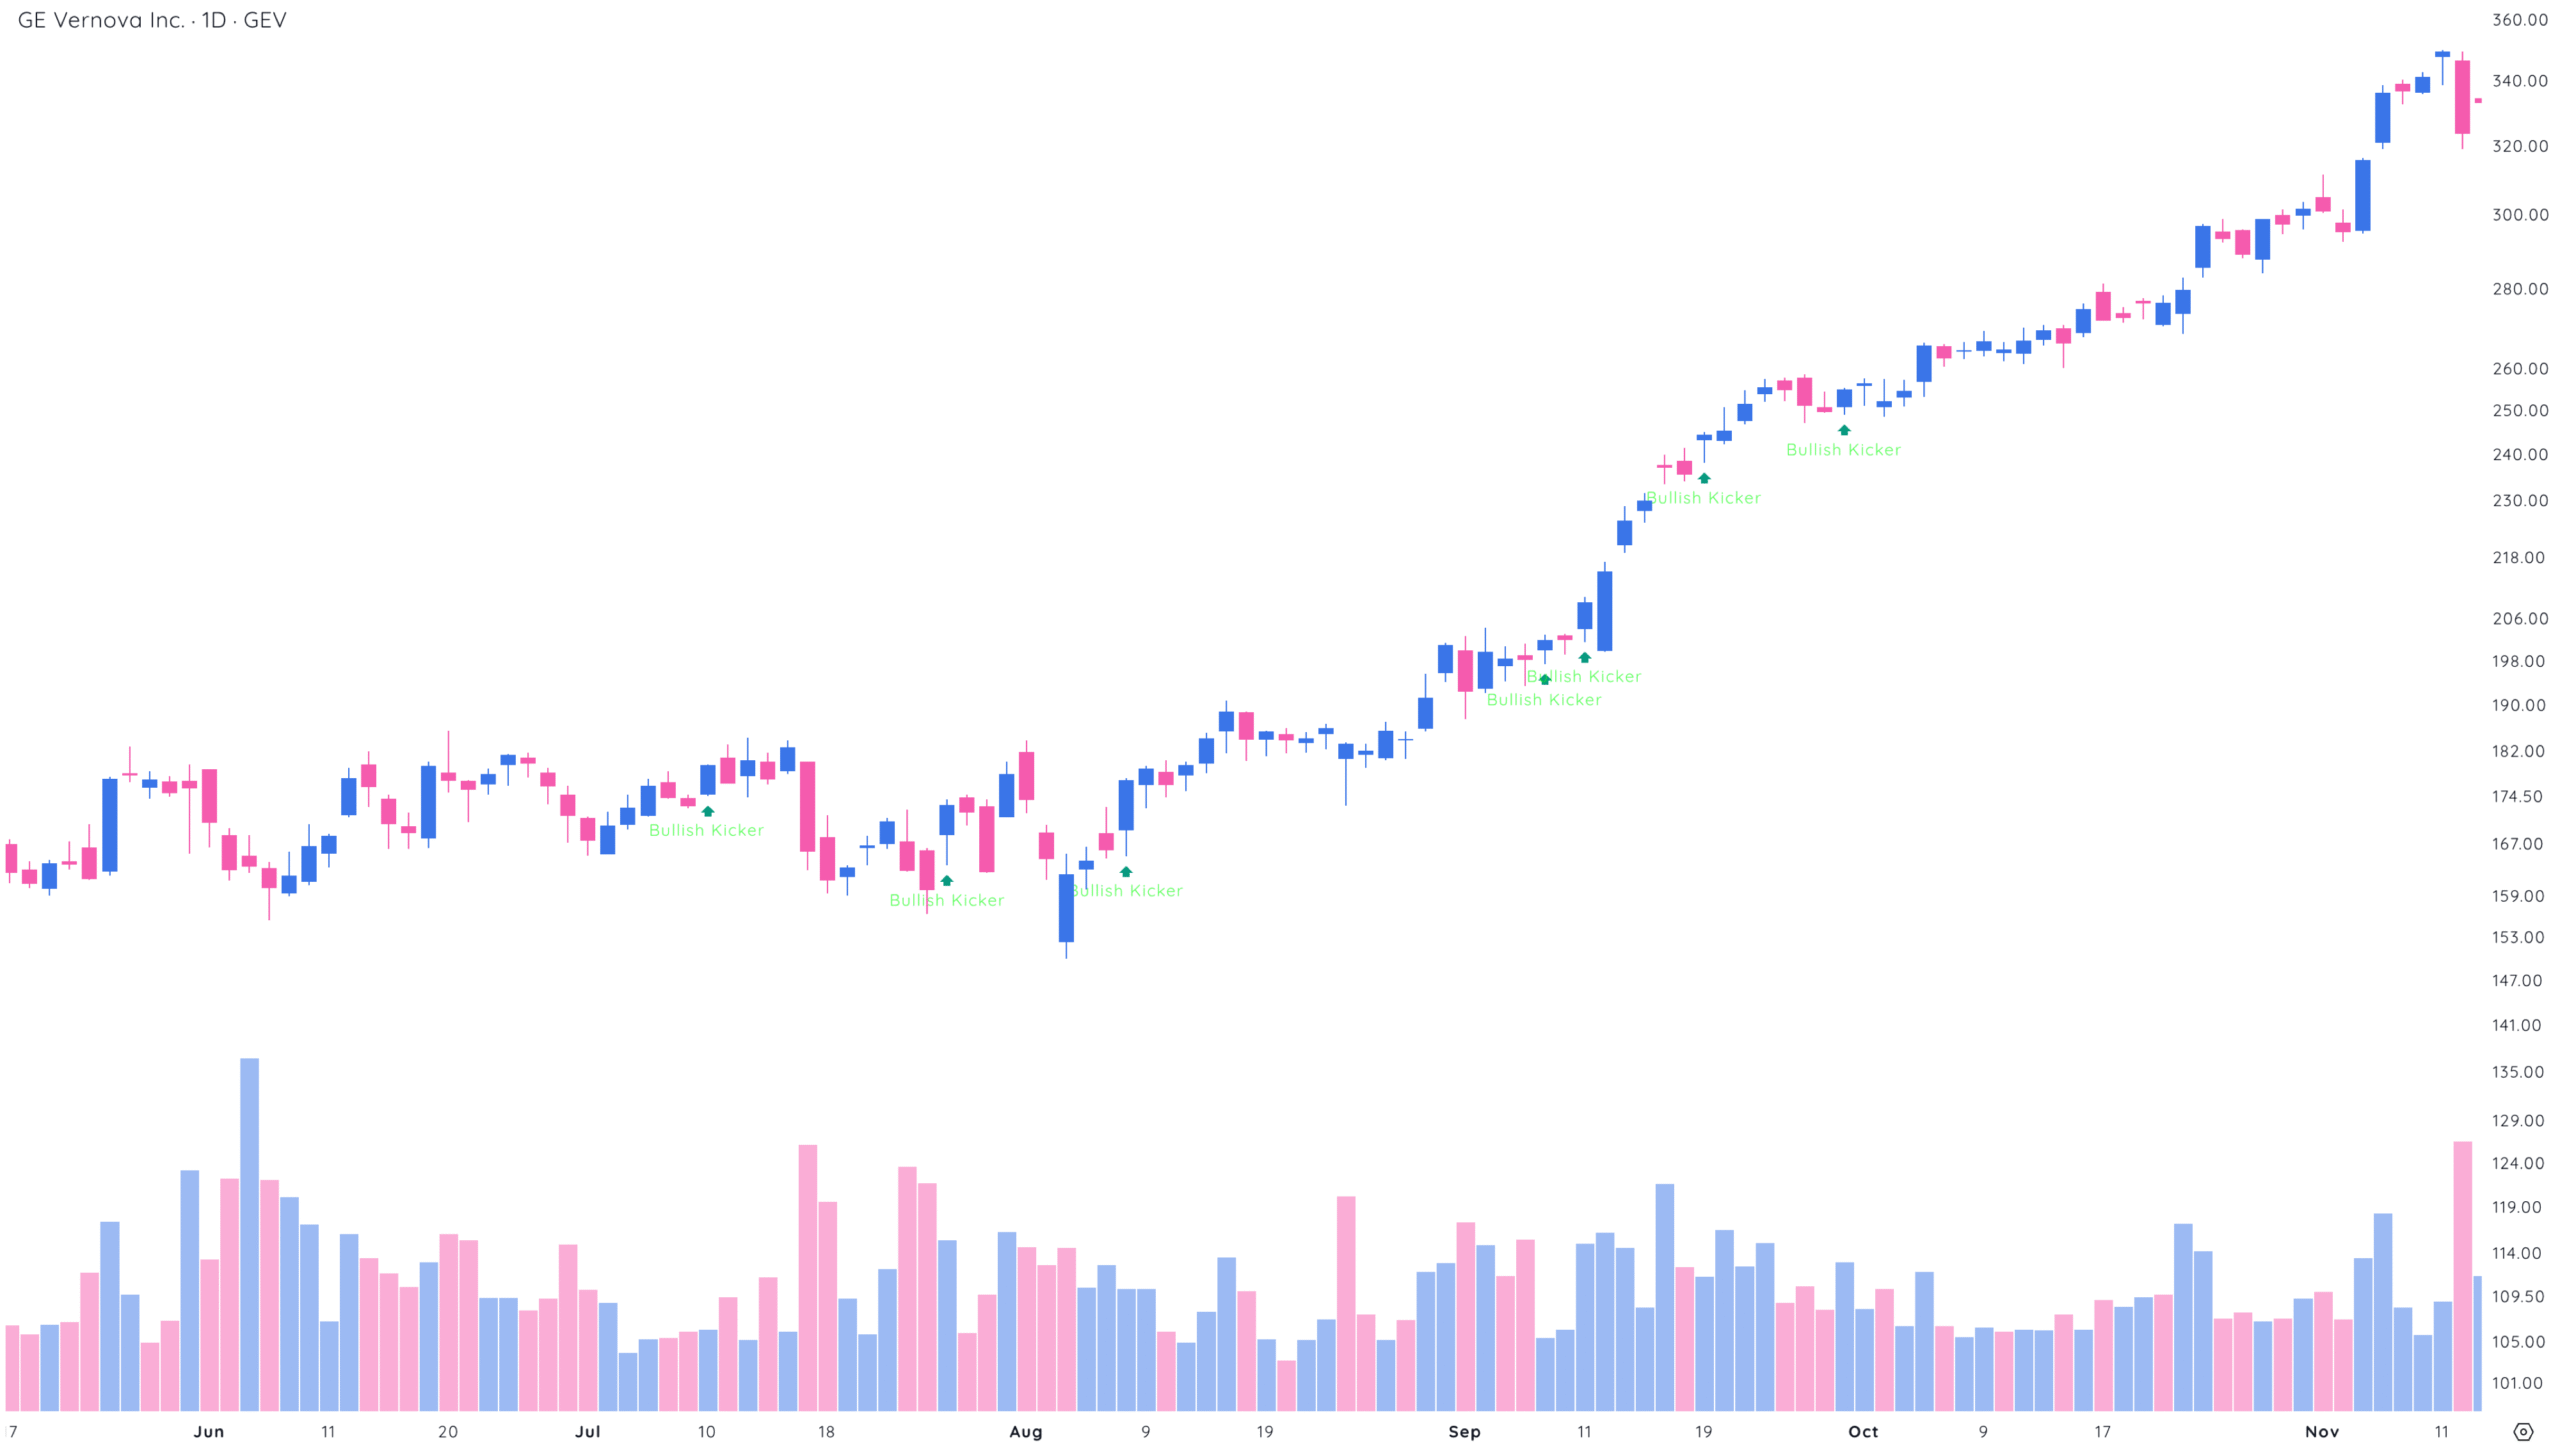
A bullish kicker is a powerful candlestick pattern that signals a sudden and strong shift from bearish to bullish sentiment. It starts with a bearish candle that closes lower, followed by a bullish candle that gaps up, opening above the previous day’s high, and then closes even higher.
This gap between the two candles, with no price overlap, makes the pattern stand out and often leads to strong upward momentum.
Bearish kicker
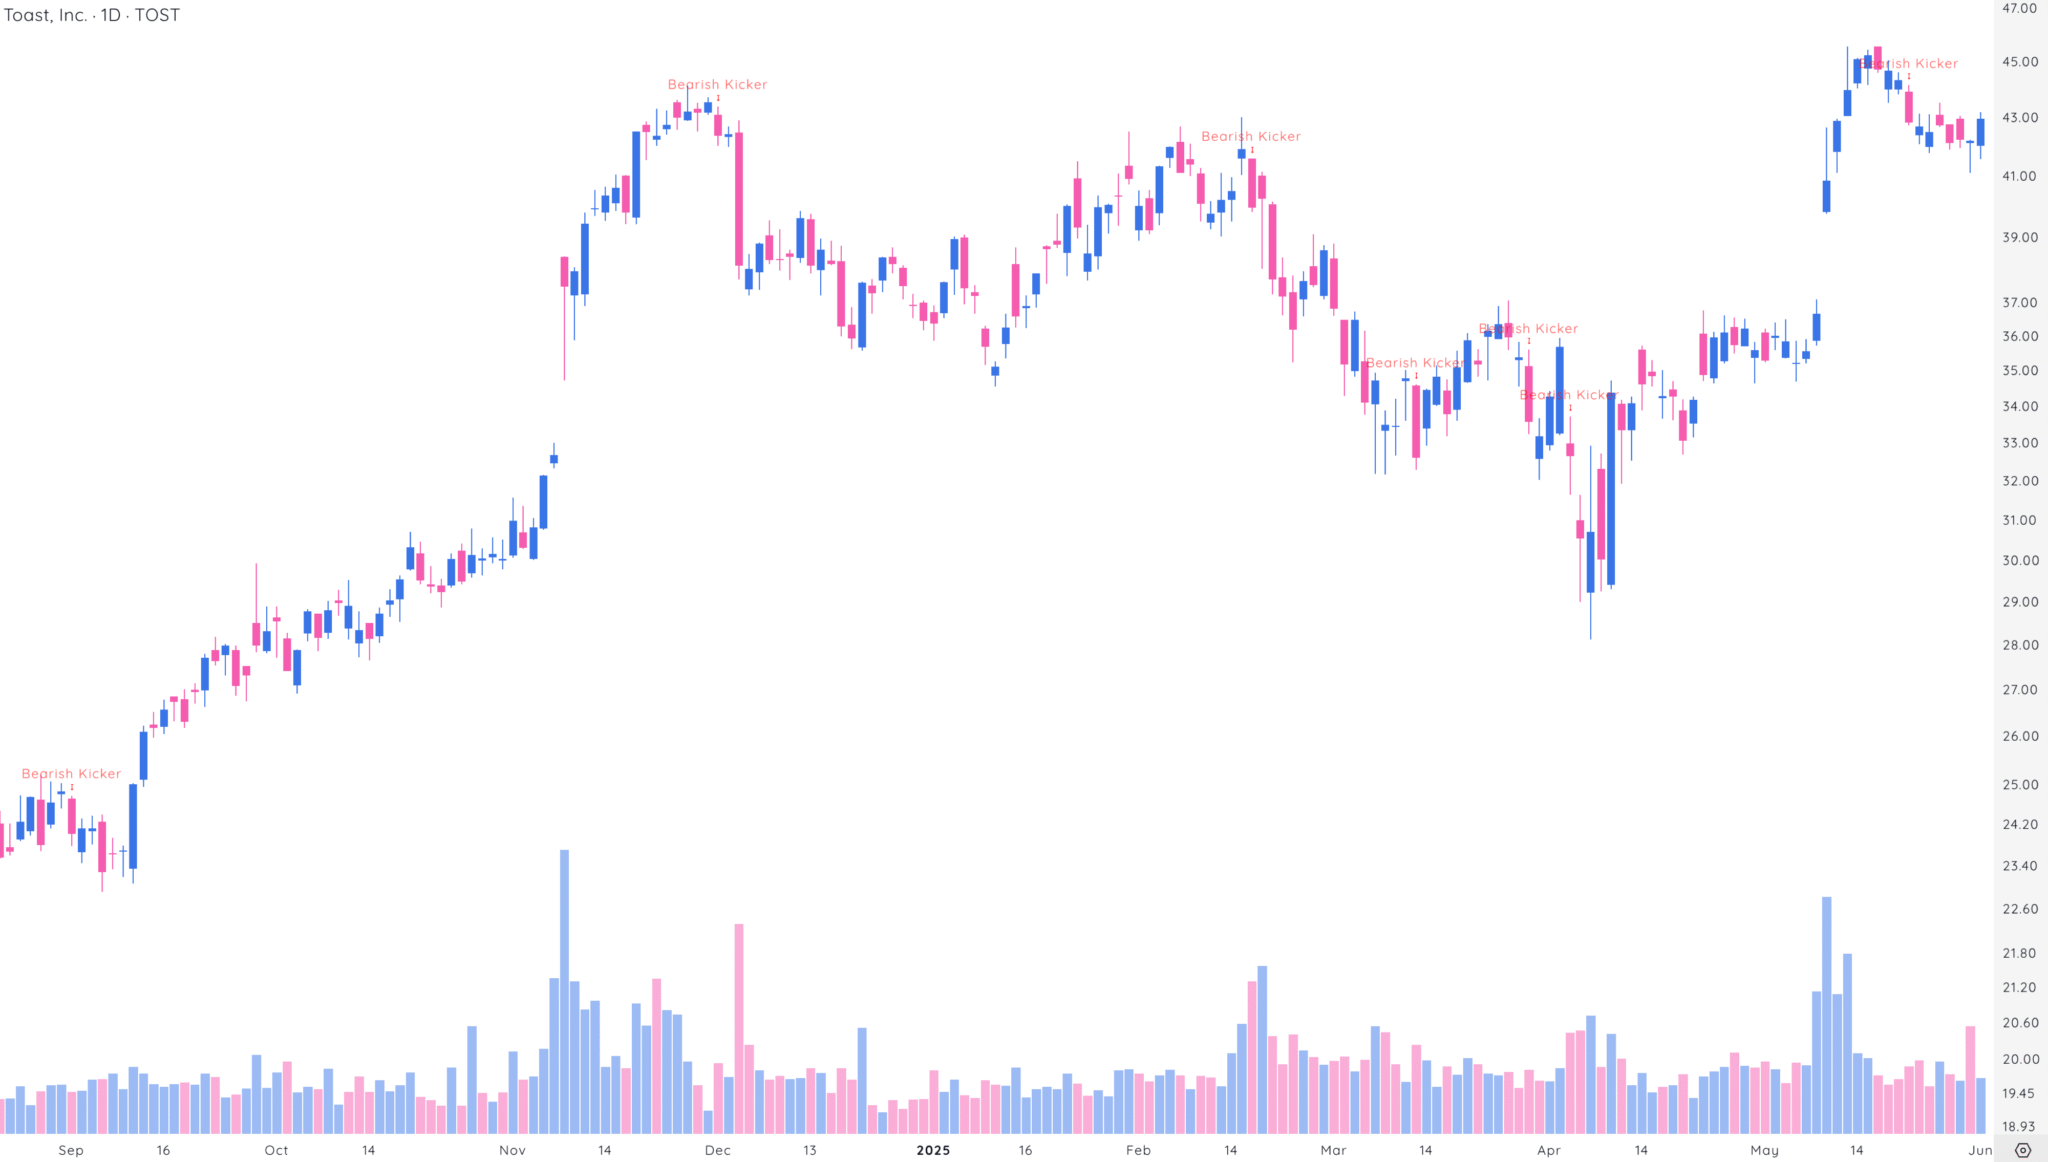
A bearish kicker is the opposite of the bullish version. It occurs during an uptrend and signals a sudden reversal to bearish sentiment.
The pattern begins with a strong bullish candle. But the next session gaps down, opening at or below the first candle’s open and closing even lower. This gap creates a clear separation between the two candles and shows that buyers lost control very quickly.
Both bullish and bearish kicker patterns are high-impact signals. Because of the gap and strong follow-through, they often indicate a shift in market sentiment that can lead to explosive moves.
How Deepvue’s candlestick pattern indicator makes analysis easier
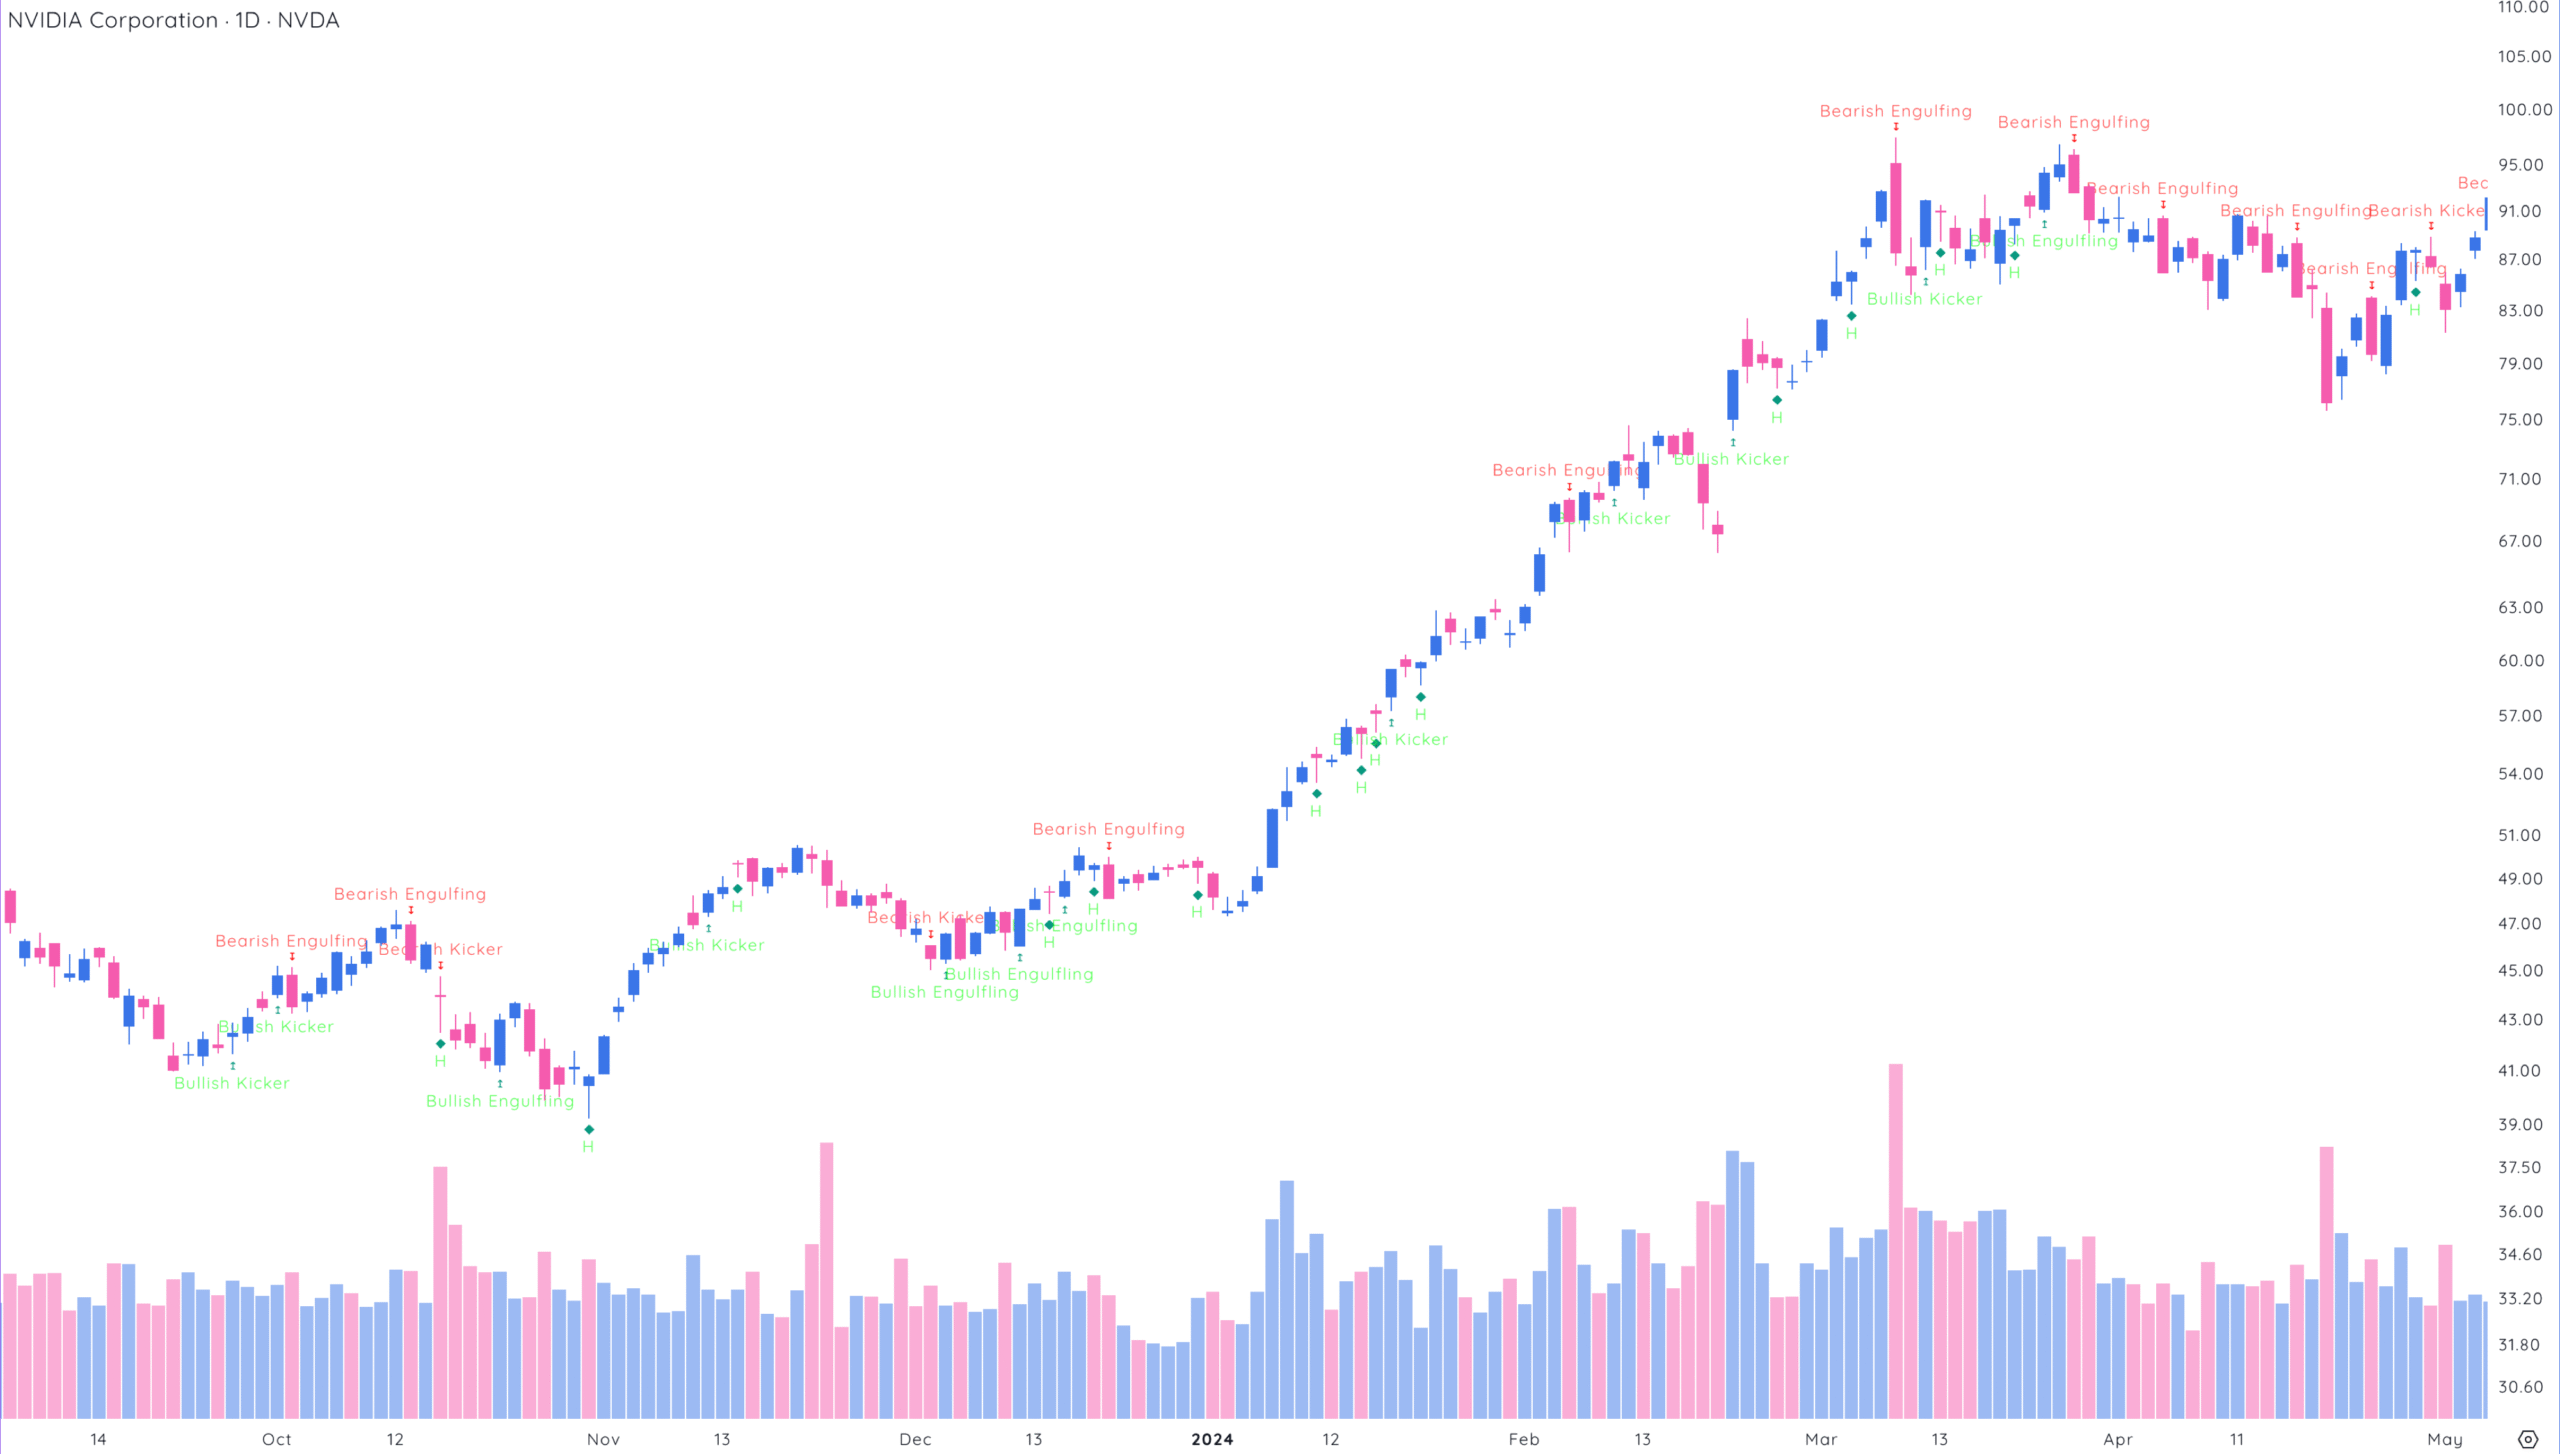
Deepvue takes the guesswork out of spotting candlestick patterns by automatically identifying and labeling over a dozen key candlestick formations directly on your chart. Whether you’re trading daily, weekly, or intraday setups, these visual cues make it easy to recognize potential turning points in real-time.
Let’s take a look at NVIDIA (NVDA) — one of the top-performing stocks between 2023 and 2024, with a 100% bullish advance. In this example, Deepvue’s candlestick pattern indicator shows the six different reversal patterns as mentioned above.
By making these candlestick patterns visible without needing to analyze every candle manually, Deepvue saves you time and boosts your confidence in trade timing.
How to add candlestick patterns to your stock charts
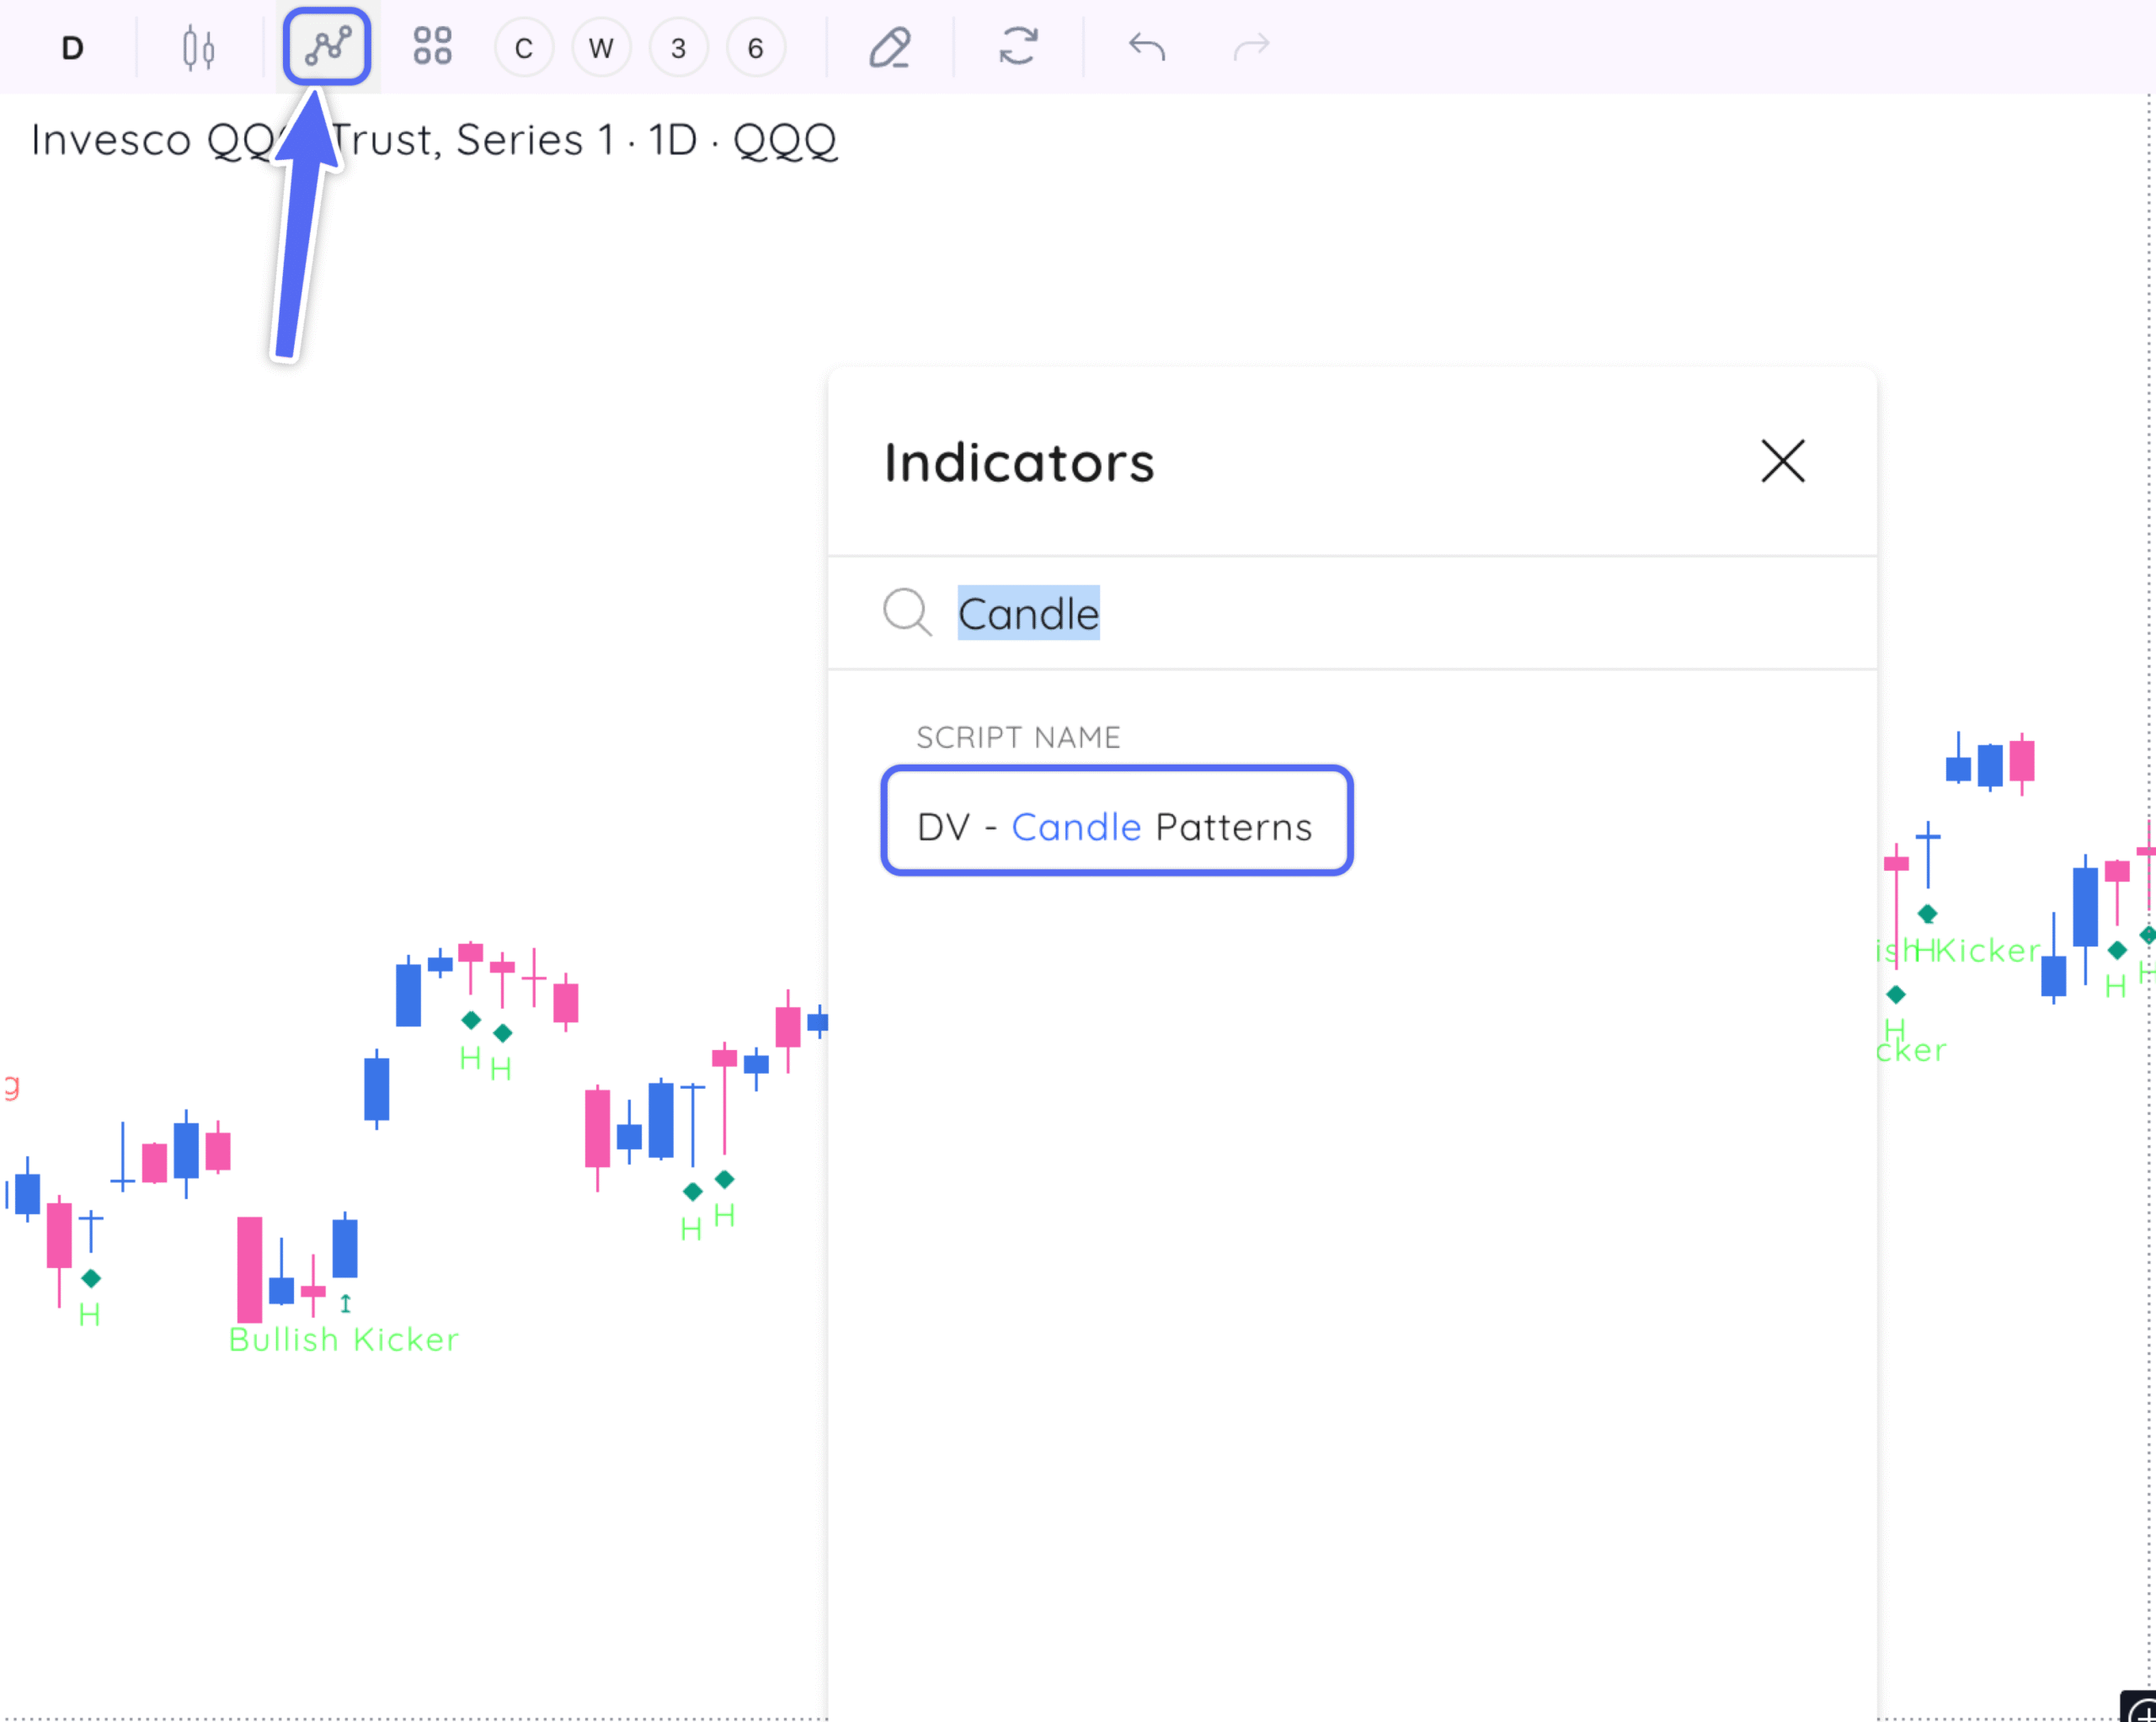
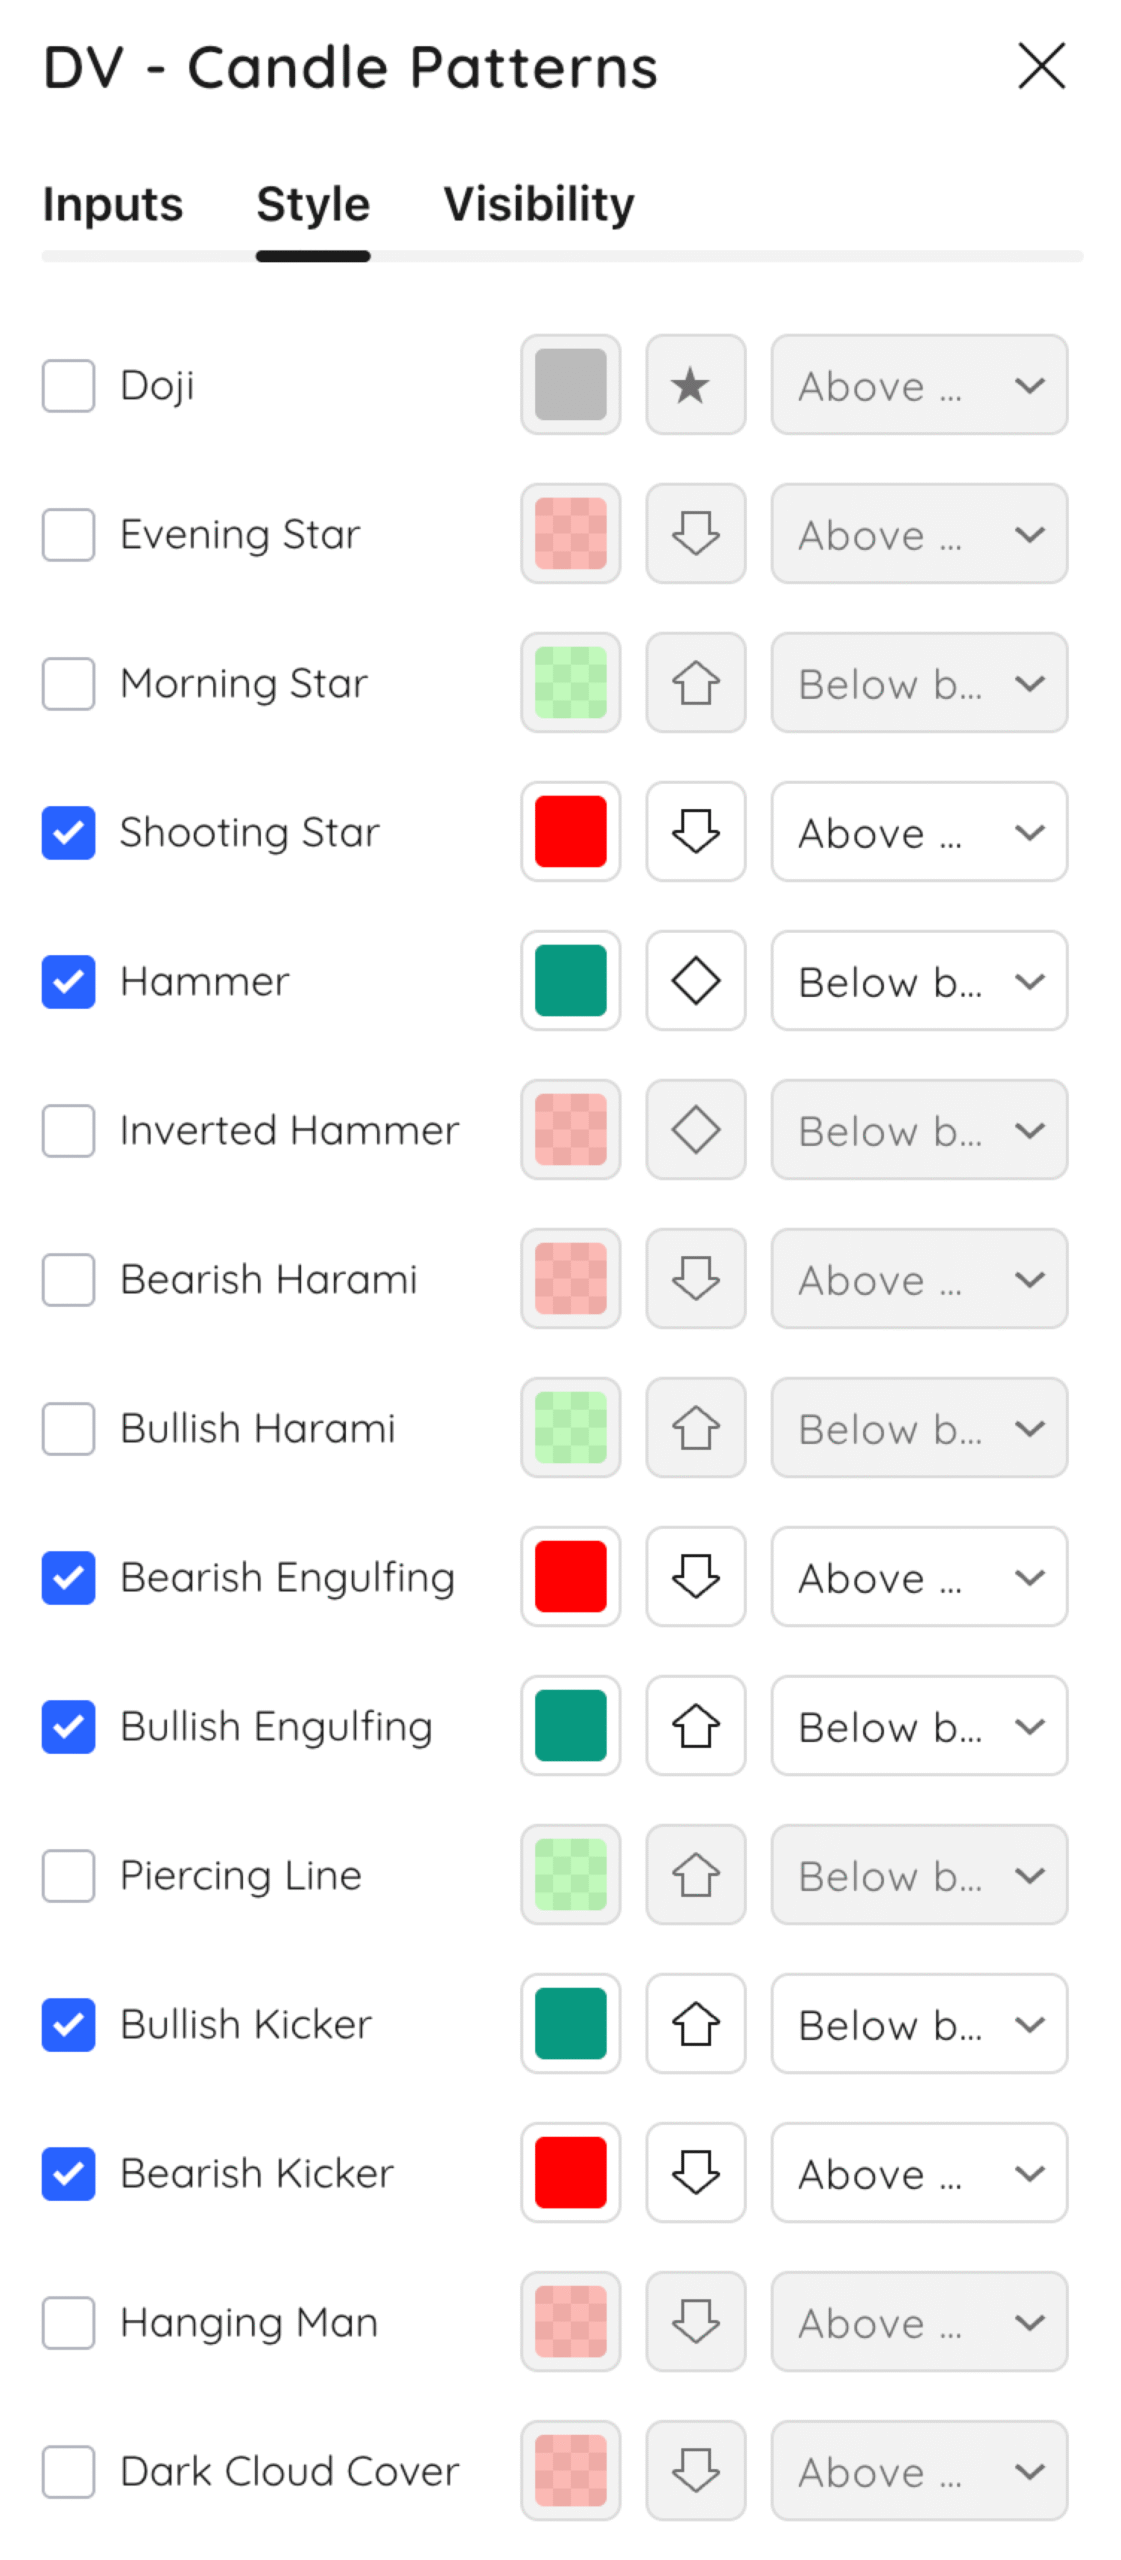
Add the Candlestick Patterns Indicator to see your favorite candlestick pattern on your charts.
Select which candlestick pattern you want to see on your charts in the settings. You can also change its color, icon style, and location.
Recognizing key candlestick patterns at a glance helps you make faster, smarter trading decisions. Whether you’re identifying a possible reversal, continuation, or breakout, seeing these patterns in real-time lets you stay in tune with the market.
Key Takeaways of stock candlestick patterns
Candlestick patterns are one of the most powerful visual tools in a trader’s toolkit. Each candlestick captures four crucial data points – the opening price, closing price, high, and low within a given timeframe.
Beyond the numbers, they also reveal real-time shifts in market psychology. The shape and size of each candle’s body and wicks provide insight into whether buyers or sellers are in control and whether fear, greed, strength, or hesitation is driving the action.
Recognizing these candlestick patterns can help traders anticipate price movement before it happens. Reversal and continuation patterns like the hammer, engulfing candles, shooting stars, and kicker setups offer early signals that a trend may be changing or continuing.
However, these signals are most reliable when paired with broader technical context, such as trend direction, support and resistance levels, and volume confirmation.
Understanding the difference between bullish and bearish candlestick patterns is critical.
Bullish candlestick patterns tend to appear at the end of a downtrend and suggest that buying momentum may be building. In contrast, bearish patterns usually show up near the top of an uptrend and often signal that sellers are beginning to take control.
Recognizing the shift in sentiment these patterns represent allows traders to better time entries, exits, and manage risk more effectively.

